xausd cook upGOLD have most potentail to sell , im publishing a gamer plan for next week but price is above my zone
Futures market

Silver Futures Rally: Riding the Upper Bollinger Band
Price is riding the upper band, a classic signal of strong bullish trend continuation.
Strong support near $34.50–$35.00 (prior consolidation zone and Bollinger midline).
Psychological support at $36.00 which was broken and now may act as support-turned-resistance.

Happy 4th July everyone quick break downIn this video I break down the pairs im looking at this upcoming week. My thoughts of the market this previous week & what I was able to learn coming from a $1000 Lost


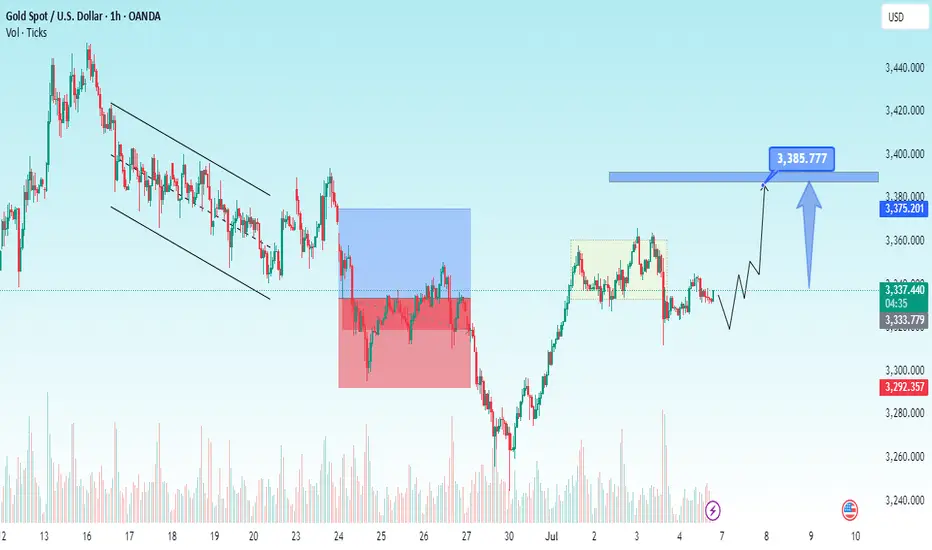
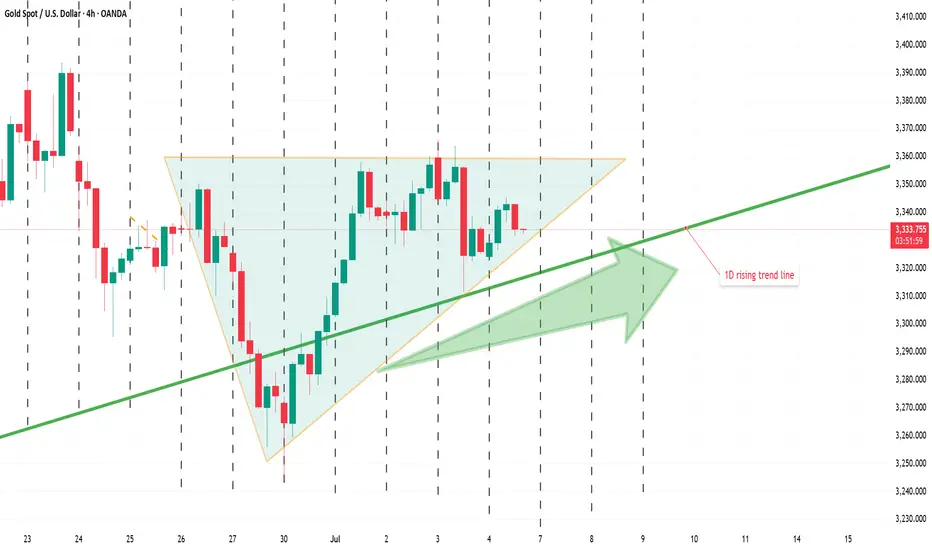
Are we likely to see bullish price action this month of JULY?Price is likely to make a bullish-like move as we got a recent price breakout from the descending channel! Technically we’re positioning for buy opportunities in this market. Price remains bullish!

BANKNIFTY LOVERS Ready towards 60000 + ?/ ( SHORT TERM IBANKNIFTY 30 Mins counts indicate a bullish wave structure.
Both appear to be optimistic, and this index invalidation number is 56910 ( 30 Mins closing)
target are already shared as per implus move
Investing in declines is a smart move for long-term players.
Every graphic used to comprehend & LEARN & understand the theory of Elliot waves, Harmonic waves, Gann Theory, and tTme theory
Every chart is for educational purposes.
We have no accountability for profit or loss.

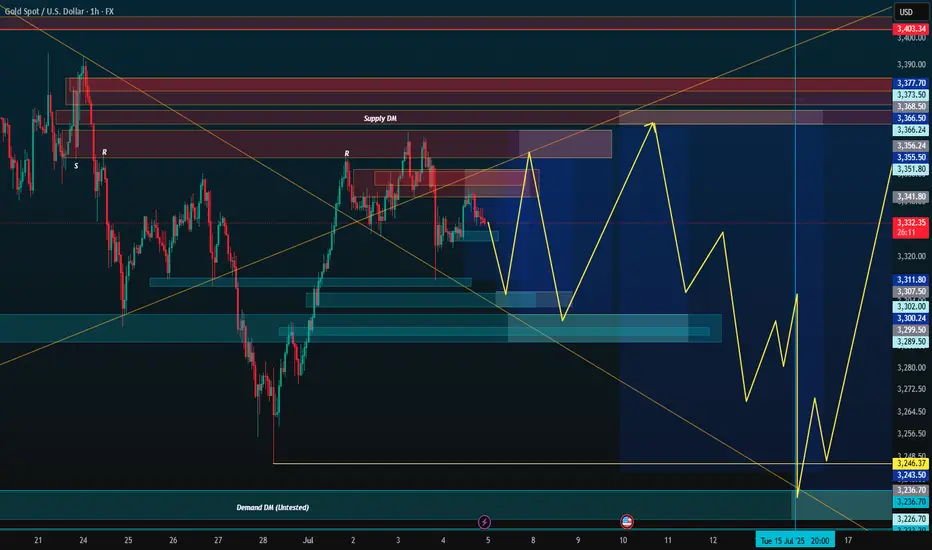
Market next target 🔄 Disruption Analysis:
📌 Current Scenario:
Price is trading around 3,336.400, just below the identified resistance zone (~3,340-3,343).
A range-bound structure is visible with repeated rejections at resistance and support.
---
🚨 Disruption View:
❌ Invalidating Bearish Bias:
The chart assumes a bearish move toward the 3,320 target, but there are early signs of strength near the mid-range (3,335 area).
Failed breakdowns and higher lows indicate buying pressure below 3,330.
---
🟢 Alternative Disruption Outlook (Bullish Flip):
If price breaks and holds above 3,343 resistance, we may see:
🔼 Upside breakout toward 3,355–3,360 zone.
📈 Continuation of the larger uptrend from July 1st rally.
---
🔁 Key Disruption Levels:
Support: 3,328–3,330 (interim zone to watch before full drop)
Resistance: 3,343–3,345 (bullish breakout point)
Invalidation of Bearish Bias: Closing above 3,345 on strong volume.

XAUUSD Going To Fly SoonGold price regains positive traction and reverses a part of Thursday’s upbeat NFP-inspired losses. US fiscal concerns weigh on the USD and lend support to the commodity amid trade uncertainties. Holiday-thinned liquidity might hold back the XAU/USD traders from placing fresh directional bets.
XAU/USD💰Symbol: { XAU/USD }
🟩Price: { 33077.35 }
🟥Stop: { 3282.67 }
1️⃣profit: { 3323.66 }
2️⃣profit: { 3346.85 }
3️⃣profit: { 3373.94 }
4️⃣profit: { 3394.65 }
📊Check your chart before entering.
🚨Check before use to make sure there is no important news.🚨

Might work, might not work. Today until CPIJust some fun projections before I go offline. Next week I won't be here anymore, at least on PC. going off-grid in hometown. Still have mt5 in my phone if anything happens tho. Goodluck traders.
Stronger NFP puts a lid on goldGold bounced quite strongly on 30 June from around $3,250 the week before that as traders monitored the debate around the American tax and spending bill and its likely effects on the deficit. However, 3 July’s stronger than expected NFP seems to have capped gains for the time being. Further implementations of tariffs has continued to be chaotic.
While there’s no definitive evidence yet that the main uptrend has ended, it certainly seems to have paused for now and been replaced by a short to medium-term sideways trend. 15 May brought a lower low intraday but $3,250 seems to be established as a fairly strong support since then, tested unsuccessfully twice at the end of May and June.
Resistance is less clear: $3,450 seems to be a likely area of reaction but this is approximate. ATR has declined fairly consistently since peaks in April and May but might now be bottoming out while volume is also relatively low now compared to the average early last quarter. The value area between the 20 and 50 SMAs is the main technical reference for now; whether the short-term direction is up or down seems to depend mainly on news, especially American politics.
This is my personal opinion, not the opinion of Exness. This is not a recommendation to trade.

Gold fluctuates near the resistance point, and the short positioSpot gold rose slightly in the European session on Friday (July 4), currently trading around $3,333/oz, up about 0.37%, and is expected to record a considerable increase of nearly 2% on a weekly basis. Behind this wave of gold price increases is the smooth passage of the massive tax cut and spending bill promoted by US President Trump in Congress, which has caused market concerns about the US fiscal situation. At the same time, the continued weakness of the US dollar index has further helped the rise in gold prices. As a traditional safe-haven asset, gold continues to be supported by bargain hunting.
Despite the continued rise in gold prices, physical gold demand in major Asian markets has been sluggish. Due to high prices, consumer purchasing interest has significantly weakened. In India in particular, the reduction in gold imports has led to a narrowing of the market discount. The weak demand in the Asian market is in sharp contrast to the risk aversion in the global financial market, highlighting the complexity of the current gold market. On the whole, fiscal concerns caused by the US tax cut bill, the weakening of the US dollar and the potential impact of Trump's tariff policy are jointly driving the upward trend of gold prices. The attractiveness of gold as a safe-haven asset is increasing, especially against the backdrop of increasing global economic uncertainty. In the future, as tariff policies are gradually implemented and the Federal Reserve's monetary policy becomes clearer, the gold market may have more opportunities to rise.
.

Xausdt techinical analysis.Xausdt techinical analysis next move posibale at h1 time frame.not finchinal analysis.

CL checks all boxes for a deeper drop towards $60!1). Banks are Selling! 2). Volume is dropping!). 3). Sequence needs the wave 5 drop!

DIESEL OIL GOES 'STILL-RUNNING', AND IT IS NOT A MEME AGAINDiesel Oil NY Harbor ULSD December 2025 futures contracts are trading around $2.25/gallon, once again above its 52-week average, with recent technical ratings indicating a strong buy.
The market has shown a 4.50% rise in the past 5-Day time span, reflecting bullish momentum.
Fundamental Perspective
Supply: Distillate inventories are 20% below the five-year seasonal average, the lowest since 2022. Refinery utilization is high at 94.7%, leaving little buffer for disruptions.
Demand: Distillate consumption has risen to 3.794 million barrels per day, up 260,000 b/d year-over-year, driven by robust industrial activity and summer travel.
Geopolitics: A U.S.-brokered ceasefire in the Middle East has reduced immediate supply risks, but the situation remains fragile and could quickly change.
Macroeconomic Risks: While fundamentals are bullish, potential U.S. recession risks and data reporting delays add uncertainty. Monitoring GDP growth and manufacturing PMIs is crucial.
Summary
ULSD futures are technically strong and fundamentally supported by tight inventories and robust demand, but traders should remain vigilant for macroeconomic and geopolitical shifts.
--
Best wishes,
@PandorraResearch Team 😎

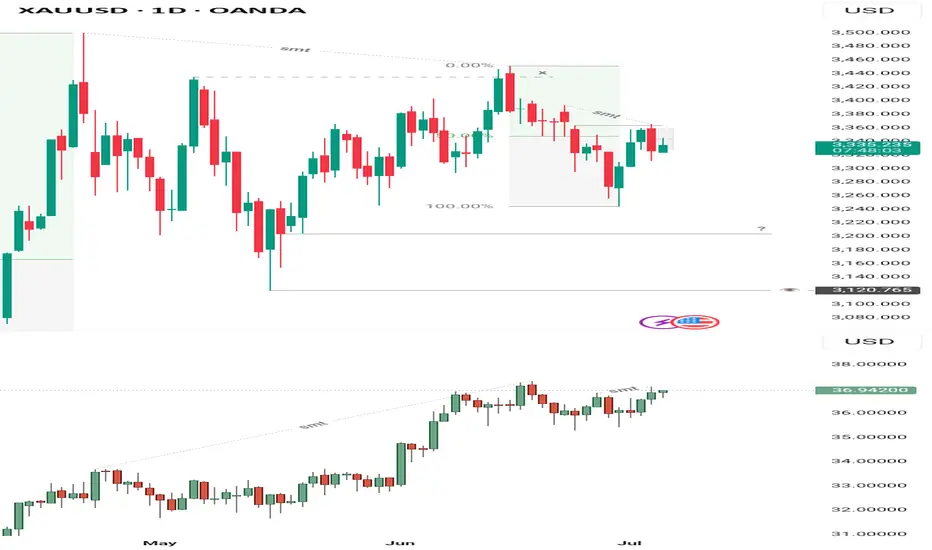
Gold-Silver Discrepancy Analysis – Reevaluation After NFP ReactiAfter taking a loss yesterday, I had to reassess my outlook on Gold. The market behavior leading into and following the NFP event revealed significant discrepancies between Gold and Silver that can’t be ignored.
Since April 24th — the day Gold printed its highest price in human history — the daily chart has shown consistent lower low formations. In contrast, Silver had been forming higher highs on the daily during this same period, showing relative strength.
However, this dynamic began to shift. On the 4-hour chart, Silver is now printing lower lows from last month’s high, aligning more closely with Gold, which has been bearish on both the daily and 4-hour timeframes since its peak.
A key moment occurred just before the NFP release: Silver made a strong run above last week’s high, while Gold failed to even trade above Wednesday’s high — which coincides with the gap fill from last week Tuesday’s open. This divergence in price behavior is crucial.
Gold closed yesterday with a full-bodied bearish engulfing candle, rejecting that same gap area. Meanwhile, Silver’s breakout above last week’s high, despite its internal weakness, is a clear discrepancy of value.
Now, with Silver beginning to shift into lower low structure on the daily and no bullish market structure shift present on the 4-hour chart, the bullish narrative weakens. This divergence between both metals—especially as Silver shows signs of internal breakdown—suggests a high-probability case that the market may be preparing for a broader downside move rather than continuation to the upside.
That said, the key level at 3225/3200, which I marked during my previous bullish outlook, remains on watch. Price reaction at this zone will be critical in determining whether the market still has a chance to reclaim bullish intent or if the short bias continues to play out. If the bearish pressure holds, 3120 becomes a likely target—and a deeper fall toward 2960 wouldn’t be surprising either, considering it aligns with a key discount zone from the weekly timeframe.
7.4 Gold shocks7.4 Gold shocks
Yesterday, the gold price plummeted, but did not fall below 3310. We have analyzed before that the bulls have the advantage above 3300. From yesterday's performance, we can see that the bulls are still in a dominant position.
Today is the last day of this week. At present, the gold price has not fluctuated much and is fluctuating in the range of 3320-3345. The fact that it can still fluctuate under the negative data shows that the bulls are strong and there is a high probability that it will rise next week.
Next, we will shift our focus to the tariff situation on July 9. If there is no definite intelligence report that it has been negotiated, then gold will still be the first choice for safe haven. If the tariff situation becomes tense, then the gold price may form a unilateral rise. If the situation eases, then the gold price may rise and then fall back.
Today, it is recommended to buy near 3320, with a stop loss at 3300. The target is 3340.
If my analysis can help you, I hope you can cheer me up and give me a thumbs up.
Copper1! at Best Support !!This is the 2 chart of Copper1! .
Chart 1 Analysis:
The stock is trading near a parallel channel support zone in the 880–890 range. This zone also aligns with the monthly pivot and weekly pivot support around 882–880. Additionally, the percentage fall is nearly complete near 885, further strengthening this level as a potential support zone.
Chart 2 Analysis:
On the monthly Heikin Ashi chart, support is observed near 864, while the weekly Heikin Ashi support lies around 880.6. By connecting key levels, it indicates that Copper may find support in the 880–885 zone.
Thank You !!


Gold Setup Double OB Confirmed | Targeting 3340+🚨 Hey Traders! 🚨
Yesterday was NFP day – we saw a great waterfall sell-off 💧📉, but the overall bullish trend remains strong! 🐂✨
🧠 NFP likely just swept the day’s low to grab liquidity… and now we’re looking UP again! 🚀📊
🔑 KEY AREA:
🟡 Order Blocks (OBs) formed on both 15min & 5min timeframes – double confirmation!
💥 High chance Gold taps this zone and pushes upward again! ⏫📈
🎯 TARGET ZONE:
🏁 3340 - 3350
✅ Stick to your plan
🔒 Follow Risk Management
💼 Trade smart, not emotional!

Gold suffered a heavy blow from non-farm payrolls! Yesterday's decline in gold prices was mainly affected by news, and such declines usually do not last too long. From a technical point of view, gold prices received support near 3322 at night, which is the key support level today. It is worth noting that on Wednesday, gold prices were under pressure in the 3340-3344 area, while on Thursday, prices formed support in this range, indicating that the area is forming a top-bottom conversion, so 3340-3345 has become an important pressure level today. It is expected to fluctuate and consolidate in the 3322-3340/45 range during the day. The impact of news on gold prices is usually short-term. When the fundamentals and technical directions are consistent, price fluctuations will be more obvious; when the two are inconsistent, price fluctuations will weaken, but will not change the technical trend. The rebound pattern established at the beginning of the week is still valid. After a short-term shock, gold prices are expected to re-stand above 3345 and continue to maintain the rebound trend.

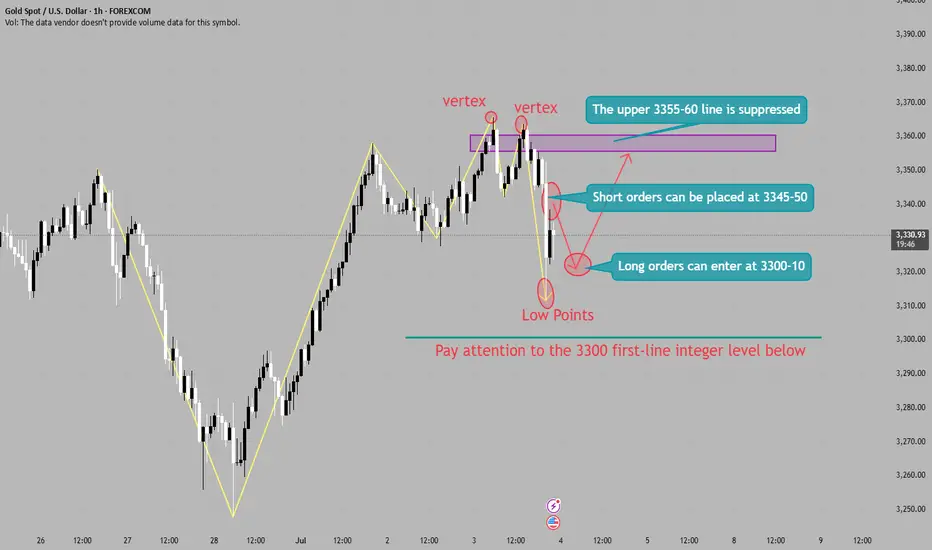
Important data such as non-agricultural are all negativeGold hourly chart;
Gold short-term analysis; Gold 4-hour analysis shows that the stochastic indicator is golden cross, which is a bullish signal; MACD indicator double lines stick together upward, which is a bullish signal; 4-hour bias continues to rise; 4-hour downward trend channel is temporarily suppressed, and the pressure position is around 3355-60.
Tariff tensions heat up againGold, the price rebounded quickly after the parallel attack and defense at 3245 at the beginning of the week. The article emphasizes that the short-term strength will continue. The high point of the week may appear around Thursday's non-agricultural data. The medium-term top idea of 3500-3452 is still maintained; on Tuesday, it actually hit 3358, and the daily K-line combination showed a long arrangement. In the morning, it was emphasized that it was still possible to follow the trend and wait for the non-agricultural data to break through on Thursday night;
The actual retracement rebounded from 3327 and is now reported at 3343, which is in line with expectations; the short-term support in the evening is 3340-3336, and the strong support is 3330; the short-term resistance is 3348, and the strong resistance is 3352-3358. If it breaks, it will look at 3365-3400;
