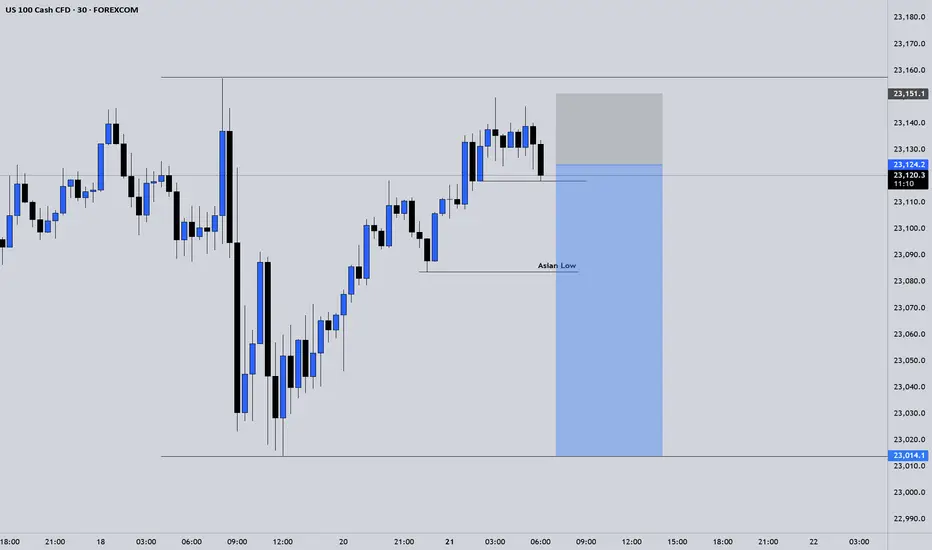
US100 continues to be in a clear uptrend.US100 continues to be in a clear uptrend.
After the price managed to break above 22900, we can see a strong bullish price action. The price increased by almost 2% in just 3 days and the volume still looks high.
There is a high possibility that even if US100 makes a small correction, it could rise
Market indices

Dow Jones is Nearing an Important Support!!Hey Traders, in today's trading session we are monitoring US30 for a buying opportunity around 43,950 zone, Dow Jones is trading in an uptrend and currently is in a correction phase in which it is approaching the trend at 43,950 support and resistance area.
Trade safe, Joe.

Bullish momentum to extend?DAX40 (DE40) is falling towards the pivot which has been identified as a pullback support and could bounce to the pullback resistance.
Pivot: 23,059.10
1st Support: 22,177.80
1st Resistance: 24,630.42
Risk Warning:
Trading Forex and CFDs carries a high level of risk to your capital and you shoul

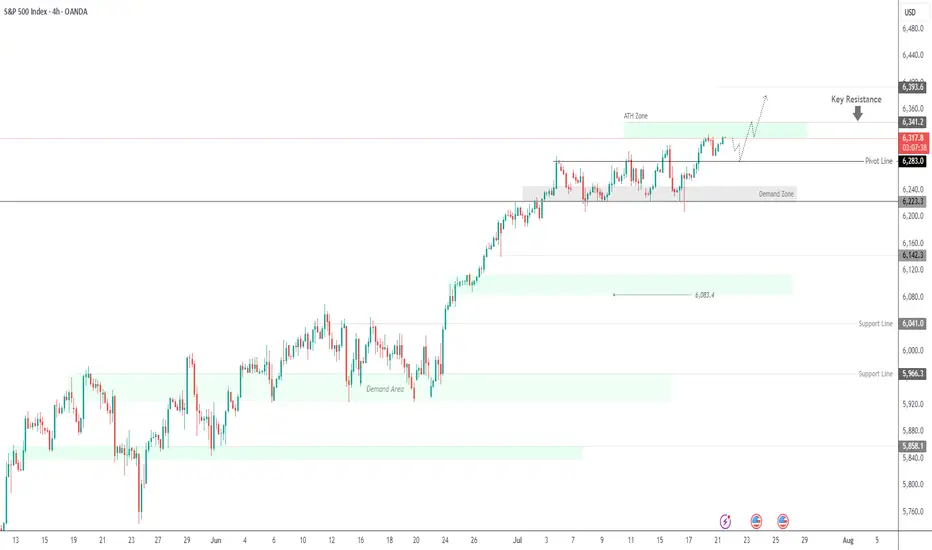
SPX500 Near ATH | Earnings Week Could Fuel Next MoveSPX500 | Weekly Outlook
The S&P 500 continues its bullish run, trading at record highs as investors await a critical week of tech earnings. Reports from Alphabet and Tesla could be key in justifying the lofty valuations driven by the AI boom.
Technical Outlook:
The price is expected to consolidate
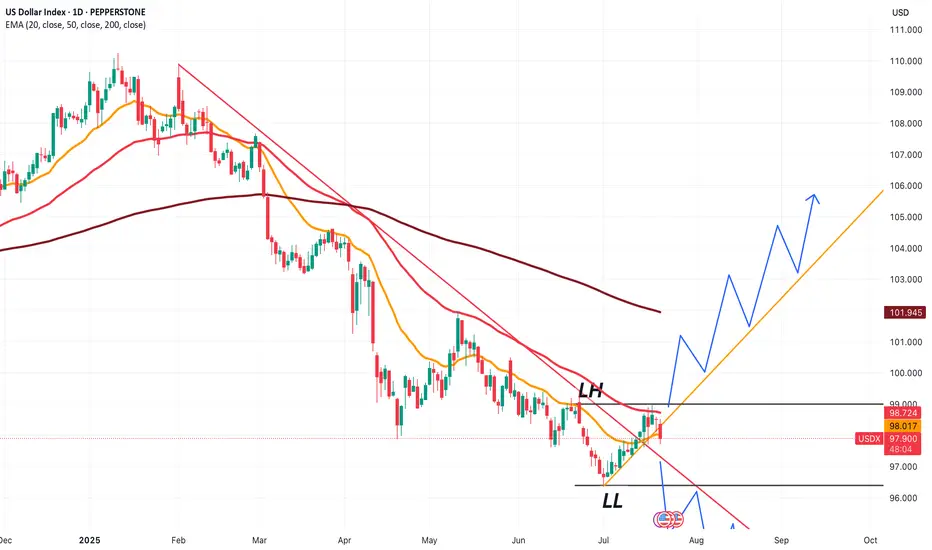
DXYThe latest COT data shows net short positions increasing on the U.S. Dollar, indicating a bearish sentiment from institutional traders. A rising short bias suggests weakening confidence in the dollar’s strength across major currencies.

USDX at a crucial price point, which will decide trendThe next few candles for USDX price will be extremely important to understand where the dollar index is headed.
Based on that, we'll be able to choose 'which' Forex pairs we can trade, and more importantly 'how' we can trade them.
If price starts to follow the green line, and takes out 99.000, we'
I am 100 % short spy and qqq I am BULLISH DXY the chart posted is now setup for the cycle top On several cycles and we have just popped the Shiller p/e above 3866 second highest reading ever . Cycle are into a peak that was due 7/5 to 7/14 So why are we now turning down .? wait the energy from one of the largest solar storms i

Short NAS100Elite Discretionary Analysis
Executed trade on 30m
Price is rejecting the previous liquidity pool zone.
Targeting New York Low and CIC LP.
Upward momentum of Nasdaq is weakeningUpward momentum of Nasdaq is weakening. Waiting for negative global cues to nreal trendline

The Nasdaq Composite Is at a Record. What Does Its Chart Say?The Nasdaq Composite NASDAQ:IXIC has set multiple new all-time highs in recent weeks, but what does its chart say might happen next?
Let's check it out, starting with the IXIC's year-to-date chart as of Thursday afternoon:
Readers will note that the Nasdaq Composite bottomed out on April 7, sh

See all popular ideas