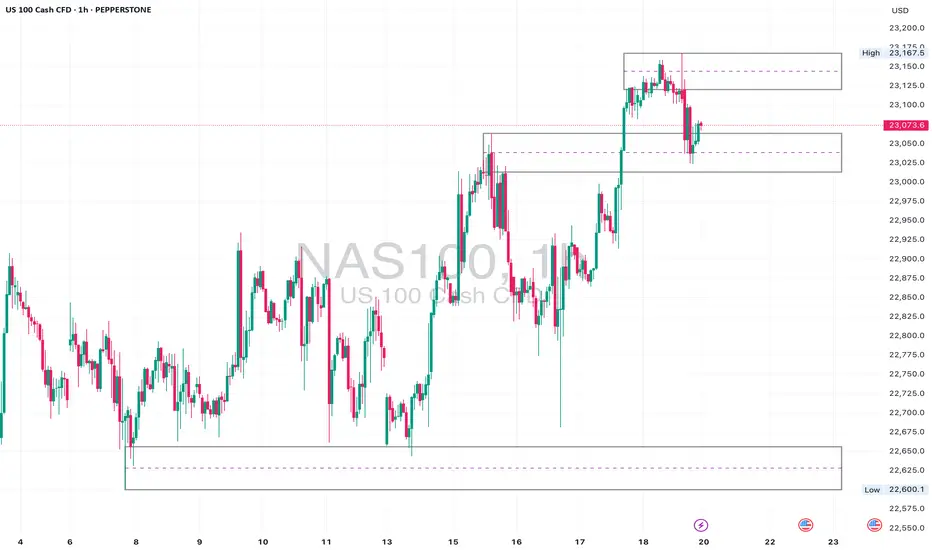
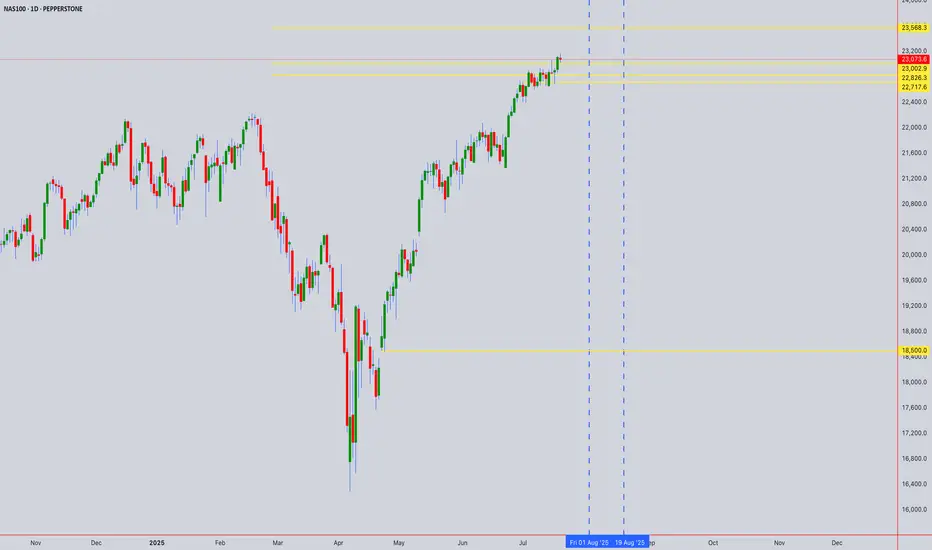
Nas100• Daily: Price is nearing the upper boundary of a rising wedge pattern — showing signs of overextension.
• 4H: Strong bullish structure with clean breaks and retests of minor consolidation ranges.
• 1H: Small range developing after recent high. A deeper pullback to 22,960–22,880 would offer a cleaner entry for continuation.
⚠️ Watch For:
• Wedge resistance on the daily chart.
• Bullish continuation only valid above 23,040.
• If we break below the 4H support zone (around 22,880), short-term pullbacks are likely.
Market indices
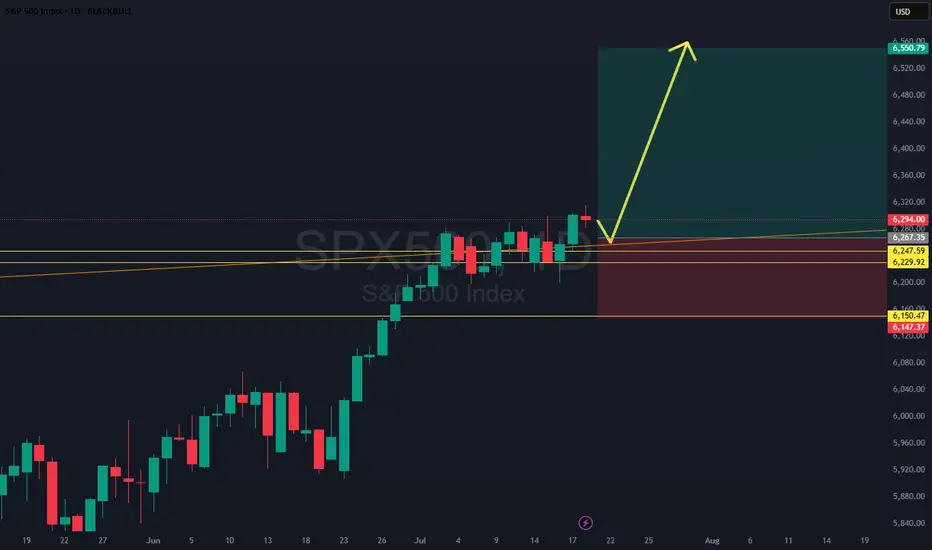
SPX500: Clean Breakout Setup - Trade of the Week?SPX500 just broke and closed above a key daily level, confirming strength after a bull flag formed off a skinny leg up. The plan? Wait for a retest of that flag structure, then ride momentum higher. We’ve got a conservative stop below solid support, making this one of the cleanest, most technically sound setups of the week. Only watch-out: price may not give the retest and could continue running. Either way, structure favors the bulls.
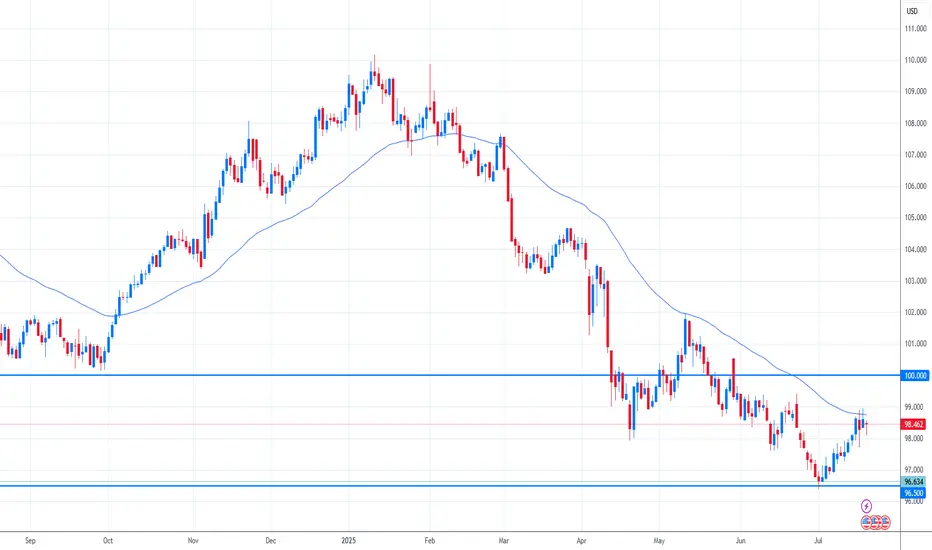
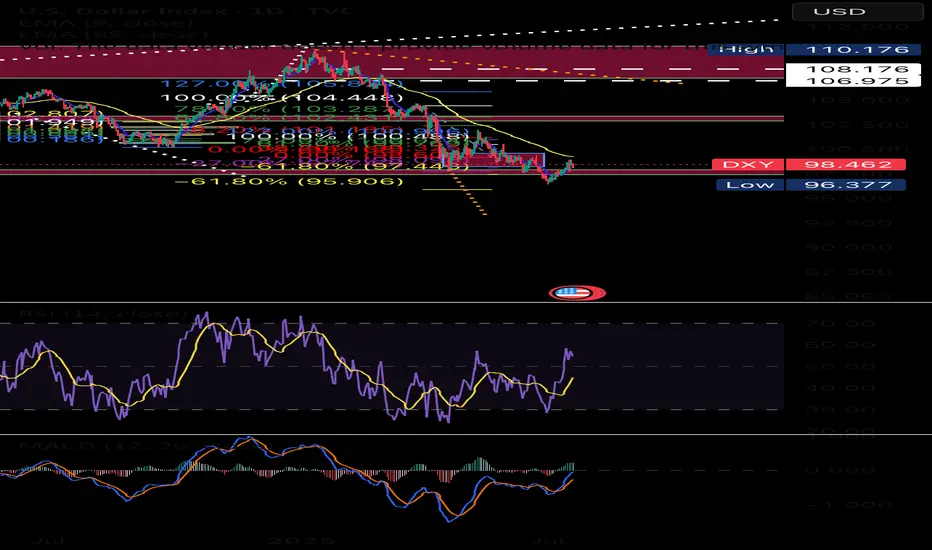
DXY Eyes Breakout – Dollar Strength Gaining GroundThe U.S. Dollar Index (DXY) is testing its 50-day moving average on the daily chart, with bulls eyeing a potential breakout. A move above 98.75 could confirm a short-term trend reversal and open the path for further gains.
Stronger-than-expected U.S. economic data continues to support the greenback. Recent inflation prints, job market resilience, and solid retail spending have pushed back expectations for imminent Fed rate cuts. This shift in rate outlook provides fundamental support for the dollar.
In addition, strong U.S. corporate earnings are bolstering equity markets, attracting capital flows into U.S. assets and indirectly supporting dollar demand. Rising Treasury yields, especially on the short end, also offer more attractive returns for dollar-based investments.
Geopolitical uncertainties and trade tensions in Asia and Europe are prompting a rotation into the dollar as a safe-haven currency.
Meanwhile, some emerging market currencies are under pressure, increasing global demand for dollar liquidity.
Technically, a close above 98.75 could confirm bullish momentum, with 99.80 as the next upside target. As long as macro and risk dynamics lean in the dollar’s favor, DXY may continue its rebound from recent lows.
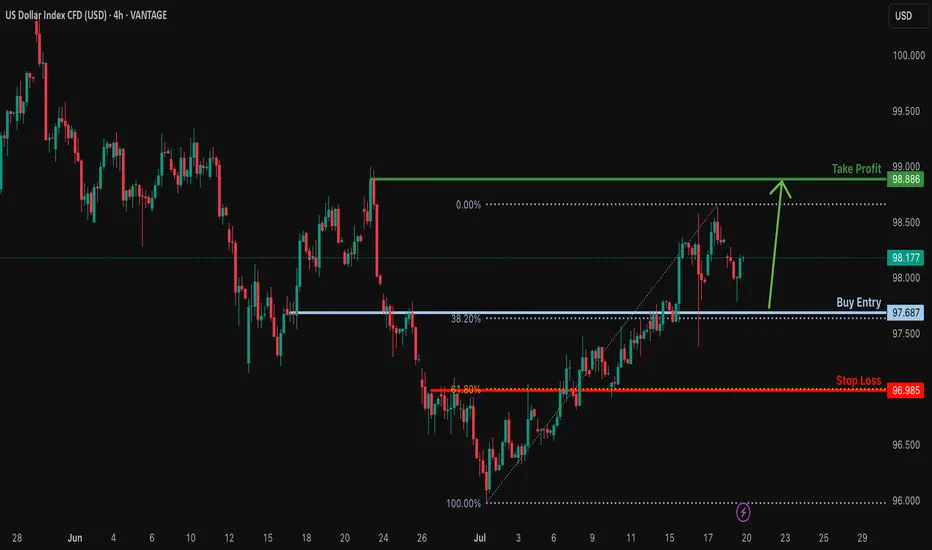
Bullish continuation for the Dollar?The price is falling towards the support level which is a pullback support that lines up with the 38.2% Fibonacci retracement and could bounce from this level to our take profit.
Entry: 97.68
Why we like it:
There is a pullback support that aligns with the 38.6% Fibonacci retracement.
Stop loss: 96.98
Why we lik eit:
There is an overlap support that aligns with the 61.8% Fibonacci retracement.
Take profit: 98.88
Why we like it:
There is a pullback resistance.
Enjoying your TradingView experience? Review us!
Please be advised that the information presented on TradingView is provided to Vantage (‘Vantage Global Limited’, ‘we’) by a third-party provider (‘Everest Fortune Group’). Please be reminded that you are solely responsible for the trading decisions on your account. There is a very high degree of risk involved in trading. Any information and/or content is intended entirely for research, educational and informational purposes only and does not constitute investment or consultation advice or investment strategy. The information is not tailored to the investment needs of any specific person and therefore does not involve a consideration of any of the investment objectives, financial situation or needs of any viewer that may receive it. Kindly also note that past performance is not a reliable indicator of future results. Actual results may differ materially from those anticipated in forward-looking or past performance statements. We assume no liability as to the accuracy or completeness of any of the information and/or content provided herein and the Company cannot be held responsible for any omission, mistake nor for any loss or damage including without limitation to any loss of profit which may arise from reliance on any information supplied by Everest Fortune Group.
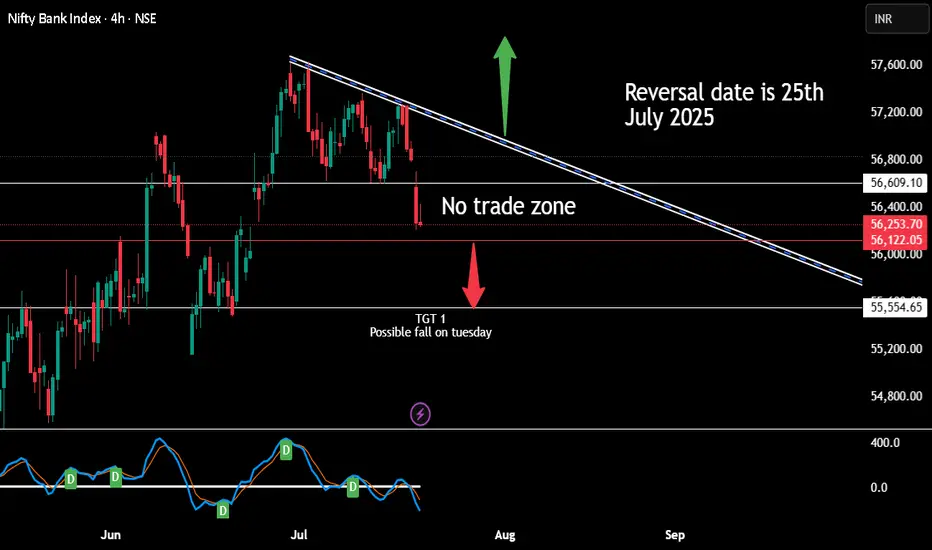
For next three days positional trading Once indicated level on red is broken and candle is closed even in 5 mins time frame then next candle execute the order. The only condition is the market has to halt before break out and consolidate for some time.
Sell future with 20-50 point stop loss for tgt of 55555
This trade is applicable only till 25th july 2025 there after we need to be watchful for reversal
NAS100 - Bullish Trend Continuation Setup• Pair: NAS100 (Nasdaq)
• Bias: Bullish
• HTF Overview (4H):
• Strong bullish structure and momentum from last week.
• Price consistently printing higher highs with no signs of reversal.
• MTF Refinement (30M):
• Waiting for a clean sweep of SSL (sell-side liquidity).
• Looking for price to dip into 30M OB for continuation opportunity.
• Entry Zone:
• Watch 30M OB — once price sweeps liquidity and confirms, execute long.
• Targets:
• Structure highs / previous weekly highs.
• Mindset Note:
• Simple execution plan — ride the trend, trust the structure.
• Wait for confirmation before switching from analyst to trader mode.
Bless Trading!
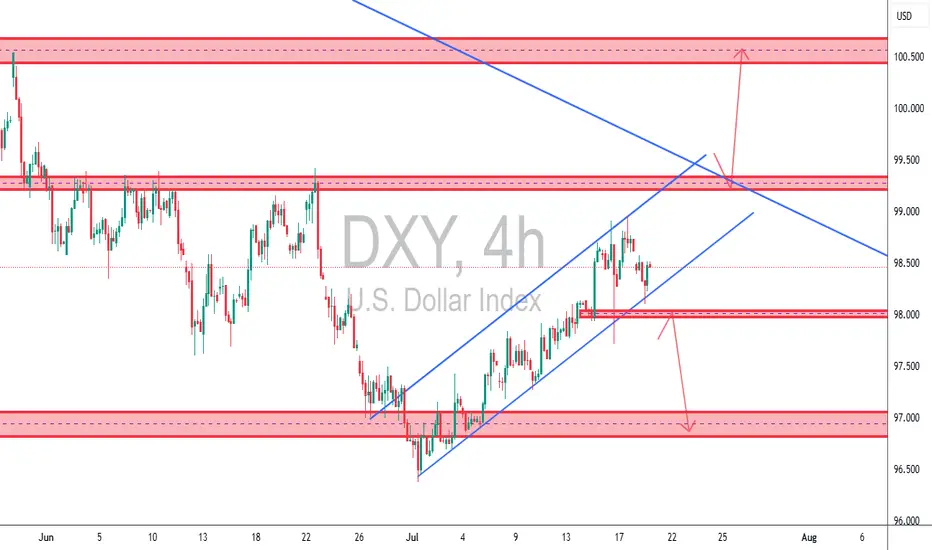
TCB Strategy Application on DXY 4H✅ TCB Strategy Application on DXY 4H
🔹 Trend → Countertrend → Breakout Structure:
• Trend: We’ve had a bullish recovery from the 97.00 zone (bottom demand), moving within an ascending channel.
• Countertrend Zone: Price has now pulled back from the 99.00–99.200 supply area.
• Breakout Watch:
o A break below the ascending channel (support line) + 98.00 zone would signal countertrend breakout → opens potential for 97.000 retest.
o A break above 99.200 would be a bullish breakout targeting the 100.500–101.000 macro supply zone.
________________________________________
🔄 What This Means for Dollar Pairs (Especially XAUUSD):
🟥 Scenario 1: Bearish DXY Breakout (98.00 loss)
• Expect XAUUSD bullish continuation, possibly reclaiming upside zones (especially if DXY targets 97.00).
• GBPUSD, EURUSD, etc., likely to gain against USD.
🟩 Scenario 2: Bullish DXY Breakout (Above 99.200)
• XAUUSD may reject from resistance or fall back toward support zones.
• USD strength will put pressure on GBPUSD, EURUSD, and other majors.
________________________________________
🧠 TCB Notes:
• Checklist Score (Pre-Breakout): ~75%
o ✔ Structure zones marked
o ✔ Channel support tested
o ✔ Reaction to supply zone
o ✖ Awaiting breakout candle + NY session confirmation
________________________________________
🔔 Suggested Alerts (Set in TradingView):
• DXY Breakout Alert: 98.00 (bearish trigger)
• DXY Bullish Trigger Alert: 99.20 or trendline breakout
• Match these alerts with corresponding TCB setups on XAUUSD, GBPUSD, etc.
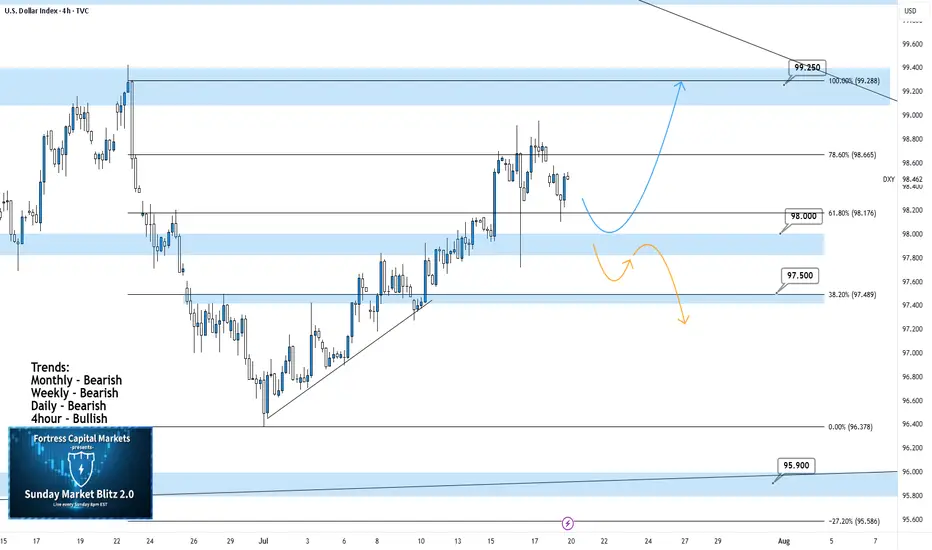
DXY 4Hour TF - July 20th, 2025DXY 7/20/2025
DXY 4hour Neutral Idea
Monthly - Bearish
Weekly - Bearish
Dailly - Bearish
4hour - Bullish
Higher timeframe trend analysis suggests that DXY is primarily bearish and is currently retracing to potential resistance.
Going into this week we are looking to see if our 98.000 zone will stay as support or transition into resistance. Here are two scenarios which highlight both a bullish and bearish outcome:
Bullish Continuation - Last week we saw a strong rally through our 98.000 zone which seems to still be holding. If this 4hour bullish trend is to continue we would like to see some sort of rejection off 98.000 support while also confirming a higher low. If this happens look to target higher toward major resistance levels like 99.250.
Bearish Reversal- If we are to consider DXY bearish again on the 4hour we would need to see a break below 98.000 support and confirm this level as new resistance.
There are a few major support levels to watch out for but DXY has the potential to fall dramatically if we see price get below 97.500.
Technical Analysis: NIFTY50 (Closing: ₹24,968.40 on 18-Jul-2025)*Analysis as of 21-Jul-2025 (Monday)*
1. Candlestick Patterns
Daily: A bearish engulfing pattern formed on 18-Jul-2025, closing below the prior candle’s low. Signals short-term reversal risk.
Weekly: Doji formation (indecision) near all-time highs. Weekly close below ₹25,000 warns of exhaustion.
Intraday (4H): Bearish pin bars at ₹25,100 resistance. Watch for follow-through selling below ₹24,900.
2. Harmonic Patterns
Daily: Potential Bearish Bat pattern in development:
XA: ₹23,200 → ₹25,200 (100%)
B: 61.8% retracement at ₹24,400 (pending)
Confirmation below ₹24,400 targets ₹23,800 (0.886XA).
3. Elliott Wave Theory
Weekly: Final waves of Wave 5 (impulse) likely complete at ₹25,200.
Daily: Starting ABC corrective wave:
Wave A: ₹25,200 → ₹24,800 (if breaks ₹24,900)
Wave B: Rally to ₹25,000–25,100 (short opportunity)
Wave C: Target ₹24,300 (1.618xA).
Intraday (1H): Minute wave iii down in progress below ₹24,950.
4. Wyckoff Theory
Phase: Potential distribution near highs:
Upthrust (18-Jul high ₹25,120) failed to hold.
Spring Level: ₹24,900. Break confirms downtrend (test supply).
Downside target: ₹24,500 (fall after distribution).
5. W.D. Gann Analysis
Square of 9:
Key support: √24,968 ≈ 158.0 → 158² = 24,964 (critical pivot).
Close below 24,964 opens ₹24,650 (next square).
Time Cycles:
21-Jul is 180° from 21-Jan 2025 high. Watch for trend change.
Gann Angle: 1x1 angle from Jul-2025 high at ₹25,200 → breaks below imply ₹400/day decline.
6. Ichimoku Kinko Hyo (Daily)
Tenkan: ₹24,950 (resistance)
Kijun: ₹24,800 (support)
Cloud: Lagging span below price; cloud thinning (bearish momentum).
Signal: Price below Kijun → trend weakness.
7. Key Indicators
RSI (Daily): 62 → declining from overbought (70). Bearish divergence.
Bollinger Bands (4H): Price testing lower band (₹24,900). Break targets ₹24,600 (2σ lower).
VWAP (1H): ₹25,050 → intraday resistance.
Moving Averages:
Death Cross (50-DMA/200-DMA): Not triggered, but 5-DMA (₹25,020) crossed below 20-DMA (₹25,050).
Timeframe Summary
Timeframe Key Levels Bias Pattern/Thesis
5M/15M Res: ₹24,990 Bearish Scalp shorts below VWAP (₹25,050)
30M/1H Res: ₹25,050 Sup: ₹24,900 Bearish Bearish EW wave iii; RSI < 50
4H Res: ₹25,100 Sup: ₹24,800 Neutral Break below ₹24,800 confirms Wyckoff distribution
Daily Res: ₹25,200 Sup: ₹24,400 Bearish Bearish Bat + ABC correction
Weekly Res: ₹25,500 Sup: ₹24,000 Neutral Doji warns of reversal; hold ₹24,400 key
Actionable Outlook
Intraday (21-Jul):
Short below ₹24,900 (SL: ₹25,050) → Target ₹24,800.
Break below ₹24,800 extends to ₹24,650.
Swing (1–2 Weeks):
Sell rallies near ₹25,100 (SL: ₹25,250) → Target ₹24,400.
Weekly close > ₹25,200 invalidates bearish view.
Critical Supports: ₹24,800 (Wyckoff spring) → ₹24,400 (Harmonic/EW target) → ₹24,000 (psychological).
Key Resistances: ₹25,050 (VWAP) → ₹25,200 (ATH) → ₹25,500 (Gann square).

$DXY🧠 What if the U.S. is intentionally slowing down the economy to weaken the dollar…
Letting the Chinese yuan strengthen so China is forced to shift from exports to consumption?
A stronger yuan means China imports more.
That’s a win for U.S. companies ready to sell.
DXY is on real powerful uptrend!hi all. for who wants to know the Long Term Direction of the market, DXY is the key. market end the retrace leg and will jump up. As you see the Tariffs effect Started and in quote of President Trump, MAGA. be happy and have a powerful trade (wink)

US100 (NASDAQ 100) 24-Hour Technical Analysis ForecastCurrent Price: 23,076.60 (Close: Friday, July 18th, 2025)
Analysis Period: Next 24 Hours (July 19-20, 2025)
Market Status: Weekend - Preparing for Monday Open
---------------------------------------------------------------------------------------------
EXECUTIVE SUMMARY - 24H OUTLOOK
Primary Bias: Neutral to Bullish (Short-term consolidation expected)
Key Resistance: 23,150 - 23,250
Critical Support: 22,850 - 22,950
Expected Range: 22,900 - 23,200
Volatility Level: Moderate (Tech earnings season approach)
---------------------------------------------------------------------------------------------
1. CANDLESTICK PATTERN ANALYSIS
Friday's Close Formation
---------------------------------------------------------------------------------------------
Pattern: Small-bodied candle with upper shadow at 23,076
Significance: Indecision after testing resistance near 23,150
Volume: Above-average volume suggesting institutional activity
Context: Failed to break cleanly above psychological 23,100 level
---------------------------------------------------------------------------------------------
Expected 24H Patterns
---------------------------------------------------------------------------------------------
Monday Gap: Potential small gap up to 23,100-23,120 area
Continuation Pattern: Bullish flag/pennant formation developing
Key Reversal: Watch for hammer formation at 22,950 support if decline occurs
---------------------------------------------------------------------------------------------
Pattern Probability Assessment
---------------------------------------------------------------------------------------------
Doji/Spinning Top: 40% probability (continued indecision)
Bullish Engulfing: 35% probability (if gap up occurs)
Bearish Reversal: 25% probability (if resistance holds)
---------------------------------------------------------------------------------------------
2. HARMONIC PATTERN ANALYSIS
Current Harmonic Setup
---------------------------------------------------------------------------------------------
Primary Pattern: Bullish Cypher Pattern in Development
---------------------------------------------------------------------------------------------
X: 22,400 (previous major low)
A: 23,250 (recent swing high)
B: 22,800 (61.8% retracement)
C: 23,150 (127.2% extension - current test area)
D (Completion): 22,650-22,750 (78.6% retracement zone)
---------------------------------------------------------------------------------------------
Alternative Pattern: Bull Flag
---------------------------------------------------------------------------------------------
Pole: 22,400 → 23,250 (850-point move)
Flag: Current consolidation 22,950-23,150
Target: 23,250 + 850 = 24,100 (extended projection)
---------------------------------------------------------------------------------------------
Fibonacci Levels (24H Focus)
---------------------------------------------------------------------------------------------
Golden Ratio Support: 22,950 (61.8% of recent swing)
38.2% Retracement: 23,025
23.6% Retracement: 23,050
Extension Target: 23,375 (161.8% projection)
---------------------------------------------------------------------------------------------
3. ELLIOTT WAVE THEORY - 24H COUNT
Primary Wave Count (Bullish Scenario)
---------------------------------------------------------------------------------------------
Macro Structure: Wave 5 of larger degree impulse in progress
Current Position: Wave 4 correction completing
Mini-wave Count: Flat correction pattern (A-B-C structure)
---------------------------------------------------------------------------------------------
24-Hour Wave Projection
---------------------------------------------------------------------------------------------
Wave A: 23,250 → 22,800 (Completed)
Wave B: 22,800 → 23,150 (Completed - 70% retrace)
Wave C: 23,150 → 22,950 (In Progress - Equal to A)
Wave 5 Target: 24,000-24,200 (1.618 extension)
---------------------------------------------------------------------------------------------
Alternative Count (Corrective Scenario)
---------------------------------------------------------------------------------------------
Structure: Double zigzag correction
Current Phase: Second zigzag development
Target: 22,750-22,850 (Wave Y completion)
---------------------------------------------------------------------------------------------
Critical Elliott Levels
---------------------------------------------------------------------------------------------
Wave 4 Low: 22,750 (must hold for bullish count)
Invalidation: Below 22,400 (Wave 1 high)
Confirmation: Break above 23,250 (Wave 3 high)
---------------------------------------------------------------------------------------------
4. WYCKOFF THEORY - 24H PHASE
Current Market Phase Assessment
---------------------------------------------------------------------------------------------
Primary Phase: Reaccumulation (Phase B-C transition)
Composite Operator Action: Testing supply at 23,150 area
Volume Analysis: Absorption of selling pressure evident
Smart Money Activity: Institutional buying on dips below 23,000
---------------------------------------------------------------------------------------------
Expected 24H Wyckoff Dynamics
---------------------------------------------------------------------------------------------
Phase Progression: Moving toward Phase D (Sign of Strength)
Testing Action: Final test of support at 22,950-23,000
Volume Expectation: Declining volume on any weakness
Breakout Setup: Spring action possible below 22,950
---------------------------------------------------------------------------------------------
Key Wyckoff Signals (24H Watch List)
---------------------------------------------------------------------------------------------
Sign of Strength (SOS): Break above 23,150 with volume
Last Point of Support (LPS): 22,950 area test
No Supply: Expected on rallies to 23,100-23,150
Backup to Edge of Creek: Potential dip to 22,850
---------------------------------------------------------------------------------------------
5. W.D. GANN THEORY - 24H ANALYSIS
Square of Nine Analysis
---------------------------------------------------------------------------------------------
Current Position: 23,076° on Gann wheel
Next Cardinal Point: 23,100° (significant psychological resistance)
Natural Support: 23,000° (perfect square - strong magnetic level)
Critical Angle: 22,900° (45-degree angle support from recent low)
---------------------------------------------------------------------------------------------
Time Theory - 24H Cycle
---------------------------------------------------------------------------------------------
Natural Time Cycle: 24-hour cycle from Friday's close
Critical Time Windows:
---------------------------------------------------------------------------------------------
6 hours: 02:00 UTC Monday (potential turn time)
18 hours: 14:00 UTC Monday (major turn potential)
24 hours: 20:00 UTC Monday (cycle completion)
---------------------------------------------------------------------------------------------
Angle Theory Application
---------------------------------------------------------------------------------------------
Rising 45° Line: Currently at 22,950 (critical support)
Rising 63.75° Line: 23,100 (steep resistance angle)
Declining 26.25° Line: 23,150 (gentle resistance)
---------------------------------------------------------------------------------------------
Gann Price Forecasting
---------------------------------------------------------------------------------------------
Square Root Method:
---------------------------------------------------------------------------------------------
Current: √23,076 ≈ 151.9
Next resistance: 152² = 23,104
Major resistance: 153² = 23,409
---------------------------------------------------------------------------------------------
Primary Target: 23,104 (natural Gann resistance)
Extended Target: 23,409 (next perfect square)
---------------------------------------------------------------------------------------------
Time-Price Harmony
---------------------------------------------------------------------------------------------
Harmonic Time: 144 hours from last major low
Price Harmony: 23,076 in harmony with 22,500 base
Next Harmony Level: 23,400 (Fibonacci price relationship)
---------------------------------------------------------------------------------------------
6. MULTI-TIMEFRAME INTRADAY ANALYSIS
5-Minute Chart Analysis
---------------------------------------------------------------------------------------------
Micro Trend: Consolidating triangle pattern
Support: 23,050-23,060 (recent lows)
Resistance: 23,090-23,100 (intraday highs)
Volume Profile: Balanced - no clear direction
RSI (5M): 48-52 range (neutral)
Pattern: Symmetrical triangle (breakout pending)
---------------------------------------------------------------------------------------------
15-Minute Chart Analysis
---------------------------------------------------------------------------------------------
Structure: Bull flag formation
Flag Boundaries: 23,040-23,120
Breakout Level: Above 23,120 (bullish)
Breakdown Level: Below 23,040 (bearish)
Moving Averages: EMA20 at 23,065 (support)
MACD: Consolidating above zero line
---------------------------------------------------------------------------------------------
30-Minute Chart Analysis
---------------------------------------------------------------------------------------------
Primary Pattern: Ascending triangle
Horizontal Resistance: 23,150 (multiple tests)
Rising Support Line: From 22,950 to current levels
Breakout Target: 23,350 (triangle height projection)
Volume: Decreasing (typical triangle behavior)
Bollinger Bands: Contracting (low volatility)
---------------------------------------------------------------------------------------------
1-Hour Chart Analysis
---------------------------------------------------------------------------------------------
Major Structure: Bullish continuation pattern
Cup and Handle: Handle formation in progress
Handle Depth: 7% correction (healthy)
Breakout Level: 23,175 (handle resistance)
Target: 24,000 (cup depth projection)
RSI (1H): 55 (bullish but not overbought)
---------------------------------------------------------------------------------------------
4-Hour Chart Analysis
---------------------------------------------------------------------------------------------
Macro Trend: Strong uptrend intact
Correction Type: Shallow pullback (wave 4 character)
Support Cluster: 22,900-23,000 (multiple confluences)
Resistance Zone: 23,150-23,250
Ichimoku Cloud: Price above cloud (bullish)
Volume Trend: Higher lows pattern (accumulation)
---------------------------------------------------------------------------------------------
7. TECHNICAL INDICATORS MATRIX
Momentum Indicators
---------------------------------------------------------------------------------------------
RSI (4H): 58 (Bullish momentum, room for upside)
RSI (1H): 55 (Neutral-bullish)
Stochastic %K: 62 (Above %D line - bullish)
Williams %R: -35 (Not oversold, upside potential)
---------------------------------------------------------------------------------------------
Trend Indicators
---------------------------------------------------------------------------------------------
MACD (4H): Above signal line, histogram positive
ADX: 35 (Strong trend strength)
Parabolic SAR: 22,950 (supportive)
Supertrend: 22,850 (strong support)
---------------------------------------------------------------------------------------------
Volume Indicators
---------------------------------------------------------------------------------------------
OBV: Rising trend (accumulation pattern)
Volume Rate of Change: Positive
Chaikin Money Flow: +0.15 (buying pressure)
Accumulation/Distribution: Uptrend
---------------------------------------------------------------------------------------------
8. KEY SUPPORT & RESISTANCE LEVELS (24H)
Critical Resistance Levels
---------------------------------------------------------------------------------------------
R1: 23,100 (Psychological + Gann)
R2: 23,150 (Technical resistance + harmonic)
R3: 23,200 (Minor resistance)
R4: 23,250 (Major swing high)
R5: 23,350 (Extended target)
---------------------------------------------------------------------------------------------
Vital Support Levels
---------------------------------------------------------------------------------------------
S1: 23,040 (Immediate support)
S2: 23,000 (Psychological + Gann)
S3: 22,950 (Critical support cluster)
S4: 22,900 (Strong technical support)
S5: 22,850 (Major support zone)
---------------------------------------------------------------------------------------------
9. 24-HOUR TRADING SCENARIOS
Scenario 1: Bullish Breakout (50% Probability)
---------------------------------------------------------------------------------------------
Trigger: Break above 23,120 with volume expansion
Initial Target: 23,180-23,200
Extended Target: 23,300-23,350
Stop Loss (Longs): Below 22,990
Expected Timeline: 12-18 hours from breakout
---------------------------------------------------------------------------------------------
Scenario 2: Continued Consolidation (35% Probability)
---------------------------------------------------------------------------------------------
Range: 23,000-23,150
Trading Strategy: Range-bound scalping
Buy Zone: 23,020-23,040
Sell Zone: 23,120-23,140
Duration: Full 24-hour period
---------------------------------------------------------------------------------------------
Scenario 3: Bearish Breakdown (15% Probability)
---------------------------------------------------------------------------------------------
Trigger: Break below 22,990 on volume
Target 1: 22,900-22,950
Target 2: 22,850-22,900
Bounce Level: 22,800-22,850
Recovery Above: 23,050 negates bearish scenario
---------------------------------------------------------------------------------------------
10. RISK FACTORS & CATALYSTS (24H)
Bullish Catalysts
---------------------------------------------------------------------------------------------
Tech earnings optimism building
AI sector momentum continuation
Institutional portfolio rebalancing (month-end flows)
Strong economic data expectations
Risk-on sentiment from Asia markets
---------------------------------------------------------------------------------------------
Bearish Risk Factors
---------------------------------------------------------------------------------------------
Profit-taking ahead of earnings
Rising bond yields concern
Geopolitical tensions impact
Overbought technical condition worries
Sector rotation out of tech
---------------------------------------------------------------------------------------------
High-Impact Events (Next 24H)
---------------------------------------------------------------------------------------------
Asian market opening (risk sentiment gauge)
Weekend news flow analysis
Pre-earnings positioning
Options expiry effects
Futures gap analysis
---------------------------------------------------------------------------------------------
11. TRADING RECOMMENDATIONS (24H)
For Scalpers (5M-15M Timeframes)
---------------------------------------------------------------------------------------------
Primary Setup: Triangle breakout trade
Entry Long: Above 23,120
Target: 23,160-23,180
Stop Loss: 23,080
Risk/Reward: 1:2 ratio
---------------------------------------------------------------------------------------------
For Intraday Traders (30M-1H)
---------------------------------------------------------------------------------------------
Strategy: Bull flag continuation
Entry Zone: 23,050-23,070 (on dips)
Target 1: 23,150
Target 2: 23,200
Stop Loss: 23,000
---------------------------------------------------------------------------------------------
For Swing Setup (4H basis)
---------------------------------------------------------------------------------------------
Approach: Pullback buying opportunity
Optimal Entry: 22,950-23,000
Primary Target: 23,350-23,400
Extended Target: 23,600
Stop Loss: 22,850
---------------------------------------------------------------------------------------------
12. CONFLUENCE ANALYSIS
Bullish Confluence at 22,950-23,000
---------------------------------------------------------------------------------------------
Gann Theory: 23,000° perfect square support
Elliott Wave: Wave 4 completion zone
Wyckoff: Last Point of Support (LPS)
Fibonacci: 61.8% retracement level
Moving Averages: EMA 50 confluence
Volume Profile: High volume node support
---------------------------------------------------------------------------------------------
Resistance Confluence at 23,150-23,200
---------------------------------------------------------------------------------------------
Harmonic: Cypher pattern C-point resistance
Previous Structure: Multiple test area
Psychological: Round number resistance
Gann Angles: 63.75° resistance line
Elliott Wave: Wave B completion area
Technical: Flag pattern upper boundary
---------------------------------------------------------------------------------------------
FINAL 24H FORECAST SUMMARY
Most Likely Scenario: Continued consolidation with upward bias, testing 23,150 resistance with potential breakout to 23,200+ levels.
Trading Range Expectation: 22,980 - 23,180 (primary range)
Breakout Levels:
---------------------------------------------------------------------------------------------
Bullish: Above 23,120 → targets 23,200-23,350
Bearish: Below 22,980 → targets 22,900-22,950
---------------------------------------------------------------------------------------------
Key Time Windows:
---------------------------------------------------------------------------------------------
Asian Open: 00:00-02:00 UTC (gap direction)
US Pre-market: 08:00-13:30 UTC (institutional flows)
US Cash Open: 13:30 UTC (volume confirmation)
---------------------------------------------------------------------------------------------
Risk Management Notes:
---------------------------------------------------------------------------------------------
Position sizing should account for tech sector volatility
Weekend gap risk considerations
Earnings season positioning effects
---------------------------------------------------------------------------------------------
Probability Assessment:
---------------------------------------------------------------------------------------------
50% - Bullish breakout scenario
35% - Range-bound consolidation
15% - Bearish breakdown
---------------------------------------------------------------------------------------------
Disclaimer: This analysis is for educational purposes only. Trading involves substantial risk of loss. Always use appropriate risk management and never risk more than you can afford to lose. Past performance does not guarantee future results.
---------------------------------------------------------------------------------------------
---------------------------------------------------------------------------------------------
For those interested in further developing their trading skills based on these types of analyses, consider exploring the mentoring program offered by Shunya Trade.
I welcome your feedback on this analysis, as it will inform and enhance my future work.
Regards,
Shunya Trade
⚠️ Disclaimer: This post is educational content and does not constitute investment advice, financial advice, or trading recommendations. The views expressed here are based on technical analysis and are shared solely for informational purposes. The stock market is subject to risks, including capital loss, and readers should exercise due diligence before investing. We do not take responsibility for decisions made based on this content. Consult a certified financial advisor for personalized guidance.
USNAS100 signs of a potential bearish trend Nasdaq Composite ended Friday little changed, recovering from a brief dip triggered by financial reports suggesting that former President Donald Trump is pushing for new tariffs. This geopolitical uncertainty is adding pressure to tech-heavy indices, with broader market sentiment turning cautious.
The price action on USNAS100 currently appears weak, showing early signs of a potential bearish trend in the upcoming week. However, before further downside, we may see the price retest key resistance levels.
You may find more details in the chart Ps Support with like and comments for better analysis.

SPX 500 TO CONTINUE HIGHER Week of July 20, 2025 SPX500 will continue going higher as we don't have any reversal setup yet on the higher time frames, although there is a lot of hesitation on the chart as the past week's new high was not supported. The trend on 4 hours to weekly is still up and has no break of major moving averages yet. I am looking forward to either a capitulation new high candle or a bullish new high candle that breakout of the weekly consolidation zone as we enter another trading week. I hope my thought process and analysis is helpful for making your own trading or investment decisions.
Thank you for listening and wish everyone a great trading week.
Cheers

Review and plan for 21st July 2025Nifty future and banknifty future analysis and intraday plan.
Quarterly results.
This video is for information/education purpose only. you are 100% responsible for any actions you take by reading/viewing this post.
please consult your financial advisor before taking any action.
----Vinaykumar hiremath, CMT

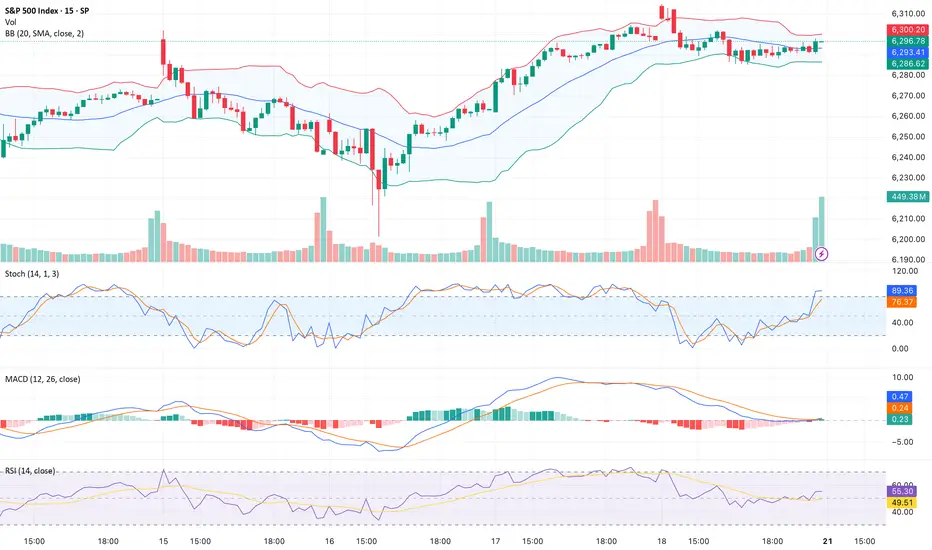
15_MinThis is a 15-minute timeframe chart, where each candlestick represents 15 minutes of trading activity. It is primarily used by intraday traders and scalpers to identify short-term trends, breakout zones, and momentum plays.
This chart of the S&P 500 (SPX) reflects intraday movements with real-time tracking of support/resistance zones, volume spikes, and short-term patterns.
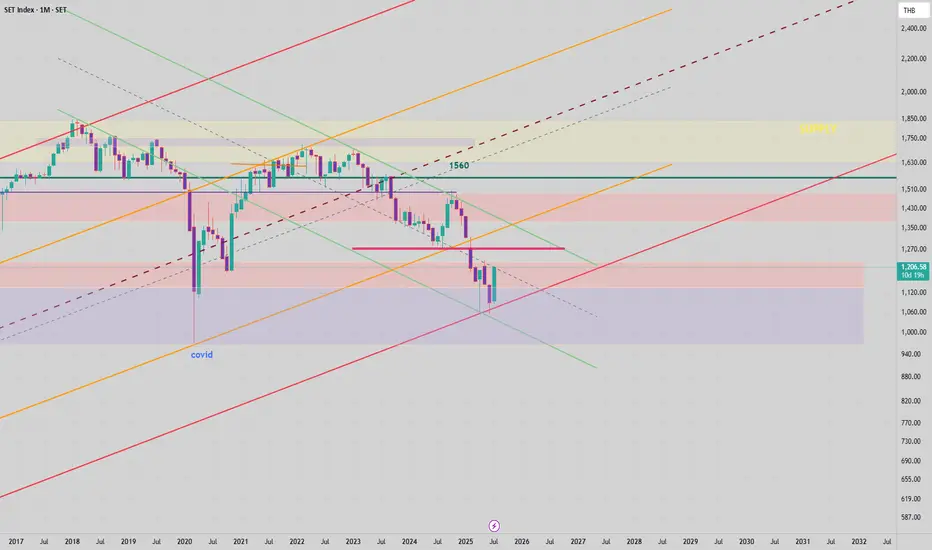
The SET Index has recently retested a major long-term support The SET Index has recently retested a major long-term support level, with the latest monthly candle showing a strong rebound. The large green candle clearly reverses the direction of several previous months' declines, suggesting a potential shift in market sentiment.
This decisive price action indicates strong buying interest at a critical support zone, reinforcing its technical significance. The recovery is especially notable on the monthly timeframe, where the rebound stands out more clearly.
Additional observations:
Price closed well above recent lows, reflecting firm rejection of further downside.
Momentum indicators are stabilizing, hinting at a possible pause or reversal in the downtrend.
If this upward move continues, immediate resistance lies in the 1270 area.
Monitoring price action in the coming weeks will be key to assessing whether this is the start of a broader recovery or a short-term bounce.
Weekly Review: The S&P and NASDAQ once again hit all time highs during the week starting Monday 14 July. Which is a sign of confidence despite the ongoing external threats (tariffs / Middle East). I've noticed the current earnings season wasn't approached with as much trepidation as recent earnings seasons have been. Of course, that could come crashing down as companies continue to report over the next couple of weeks.
Once again, the currencies didn't quite react in accordance with the overall 'positive risk environment'. As each of the 'risk off currencies' offers their own separate challenges:
Ever since the recent NFP data, the USD had been strong, the FED continues to maintain a view for a 'slow pace of rate cuts' and US data backs up that view. Particularly this week's retail sales data, even CPI, although relatively benign, wasn't soft enough to warrant a 'FED pivot' towards a more dovish stance. The USD spent most of the week on the front foot, although the 'higher for longer' narrative was put to the test when the president once again offered his views on Mr Powell. Also FED board member WALLER chipped in with some dovish comments. Currently, it's up in the air as to how many more rate cut the FED will implement before year end (if any). The narrative at the July FOMC meeting could go a long way to determine the dollar's direction for the rest of the summer. But ultimately, it'll be the data that decides.
Recently, I've been encouraged by the re-emergence of JPY weakness. This past week, I put any periods of JPY strength down to profit taking before this weekends election. I need to do some reading regarding the implications of the result. But I'm 'hopeful' that over the coming weeks and months the 'old fashioned, JPY short 'risk on trade', will be prevalent.
The CHF continues to have a mind of it's own. It could be tracking EUR strength, it could be the article I read about gold, it could be SNB intervention, It could be random, or something I'm not aware of. Ultimately, until I'm comfortable the CHF is back in correlation with the risk environment, my preference is to short the JPY instead.
In other news, disappointing AUD data took the shine off the hawkish RBA. But I still view the AUD as a good 'risk on' long.
I'll begin the new week with an open mind. My preference remains for 'risk on' trades. But it's a case of keeping up to date with all of the narratives, if momentum aligns with logic and a narrative. And you feel comfortable with a stop loss and profit target, place the trade. But, be aware that the narrative the market is focused on can change from day to day.
On a personal note, it was a week of two trades. A post US CPI 'risk on' AUD JPY long. The trade stopped out. And as discussed during the week, it was one of those situations where if I would have been at the charts and hour later, I would have traded a different pair. That's life.
The second trade was AUD USD long. Post WALLER'S dovish comments, I felt the USD short momentum could continue. On my account the trade hit profit by the skin of its teeth before reversing. Again, that's life. Sometimes you get good luck, sometimes you get bad luck. I feel it's important to acknowledge good luck, as we often only focus on the bad luck we have.
The USD is finely poised and I'm intrigued to see where the data and rate cut narrative takes it over the coming weeks.
Results:
Trade 1: AUD JPY -1
Trade 2: AUD USD +1.2
Total = +0.2%

US30 - Pattern & SMA PerspectiveDear Friends in Trading,
How I see it,
Pattern suggests there is room for more upside action.
1) SMA's are weaving - tight state - accumulation
2) As long as price respects the pattern a bullish breakout is likely.
Keynote:
A very healthy bull trend full of liquidity lies beneath this holding pattern
An unforeseen fundamental catalyst may force a correction at any time
I sincerely hope my point of view offers a valued insight.
Thank you for taking the time study my analysis.

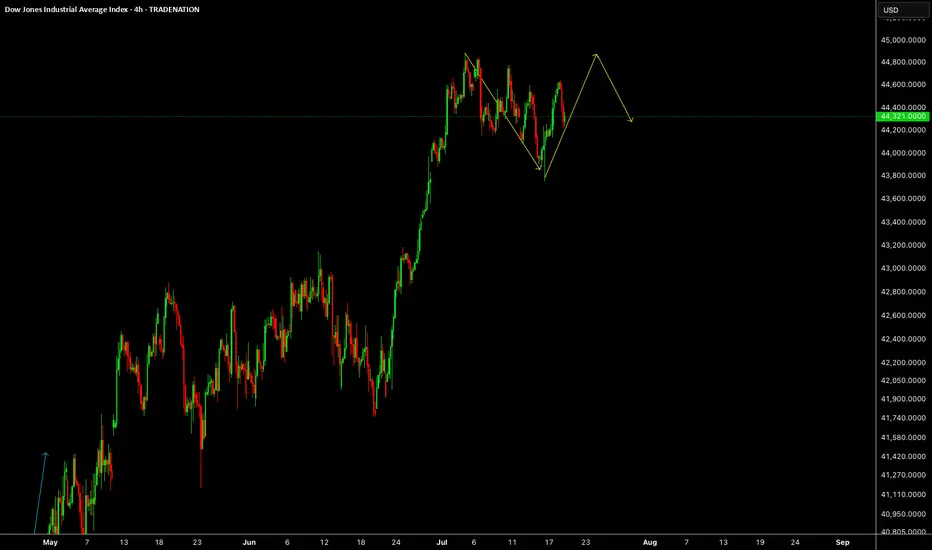
US30US30 needs some more correction, this week will be up and down both moves.
Disclosure: We are part of Trade Nation's Influencer program and receive a monthly fee for using their TradingView charts in our analysis.
NAS100 - Pattern & SMA PerspectiveDear Friends in Trading,
How I see it,
Not much new to report...
Exhaustion rising wedge continuation
1) Short corrections, new demands keep forming.
2) Can price break out to ignite an even steeper climb?
3) Or will price keep on respecting the wedge above 22900?
4) Still no catalyst to ignite a free fall...
I sincerely hope my point of view offers a valued insight.
Thank you for taking the time study my analysis.

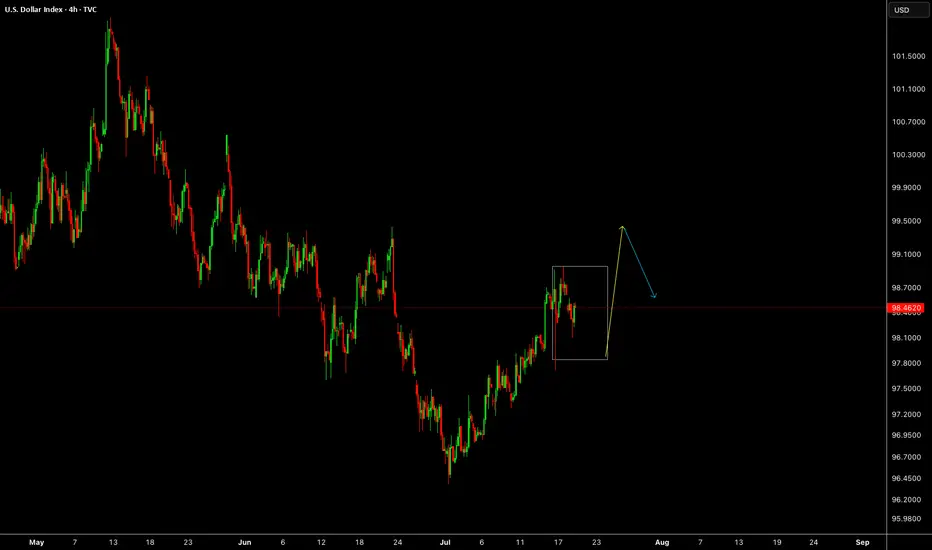
DXYDXY still have some more upside, let the market correct and push up further.
Disclosure: We are part of Trade Nation's Influencer program and receive a monthly fee for using their TradingView charts in our analysis.
TECHNICAL ANALYSIS: KSE-100 (PSX) – 20 JULY 2025 TECHNICAL ANALYSIS: KSE-100 (PSX) – 20 JULY 2025
The index has completed its spike phase marked in light blue color channel and has transitioned into a channel phase marked with yellow channel. This channel phase signifies deeper pullbacks and slower upward movement.
The index recently gave a break of structure at around 137600 and marked a high of 140594. We expect the pullback to continue downwards, potentially retesting the LTF at 137600, before resuming the third leg of this channel phase.
The market remains in long, and every dip is considered a buying opportunity.
