US30: The Market Is Looking Down! Short!
My dear friends,
Today we will analyse US30 together☺️
The recent price action suggests a shift in mid-term momentum. A break below the current local range around 44,306.1 will confirm the new direction downwards with the target being the next key level of 44,263.8..and a reconvened placement of a stop-loss beyond the range.
❤️Sending you lots of Love and Hugs❤️
Market indices

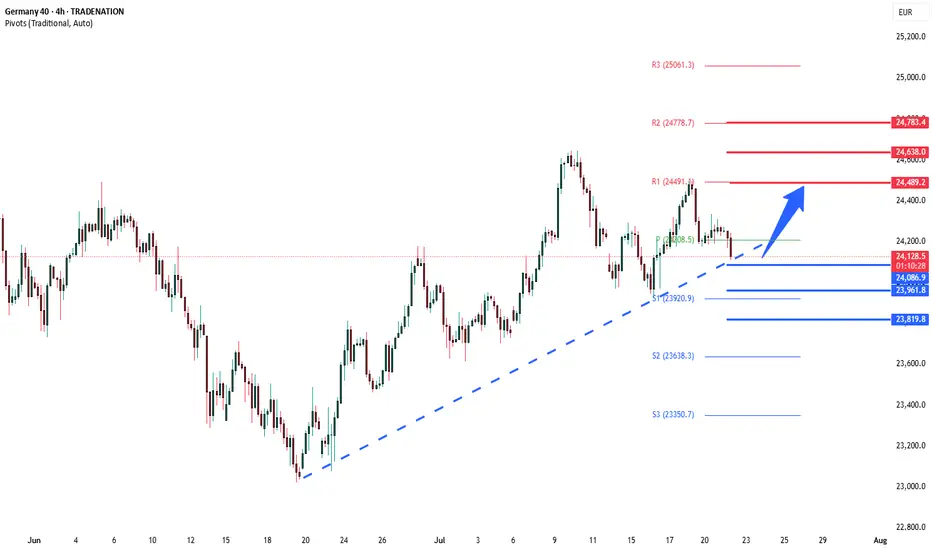
DowJones corrective pullback supported at 23920Key Support and Resistance Levels
Resistance Level 1: 24490
Resistance Level 2: 24640
Resistance Level 3: 24780
Support Level 1: 23920
Support Level 2: 23790
Support Level 3: 23646
This communication is for informational purposes only and should not be viewed as any form of recommendation as to a particular course of action or as investment advice. It is not intended as an offer or solicitation for the purchase or sale of any financial instrument or as an official confirmation of any transaction. Opinions, estimates and assumptions expressed herein are made as of the date of this communication and are subject to change without notice. This communication has been prepared based upon information, including market prices, data and other information, believed to be reliable; however, Trade Nation does not warrant its completeness or accuracy. All market prices and market data contained in or attached to this communication are indicative and subject to change without notice.

China A50 Breakout: 14% Opportunity Amid Summer Lull?Markets are quiet, but the China A50 is heating up. A bullish inverse head and shoulders pattern has formed, backed by stimulus hopes. Target upside is 14% with a strong risk-reward setup. Are you ready to trade it, or still on holiday?
This content is not directed to residents of the EU or UK. Any opinions, news, research, analyses, prices or other information contained on this website is provided as general market commentary and does not constitute investment advice. ThinkMarkets will not accept liability for any loss or damage including, without limitation, to any loss of profit which may arise directly or indirectly from use of or reliance on such information.

S&P500 sideways consolidation breakoutKey Developments:
Fed Politics: Treasury Secretary Scott Bessent called for a review of the Fed’s $2.5B HQ renovation, continuing political pressure on Jerome Powell. This adds to the uncertainty around Fed independence and rate path.
Meme Stock Surge:
Opendoor soared 121% amid a retail-driven frenzy.
Major institutional investors are also chasing the rally, pushing broader equities to record highs.
However, upcoming Alphabet and Tesla earnings could be a turning point for momentum.
Corporate News:
Hewlett Packard Enterprise suffered a $985M loss in the Autonomy case—corporate governance and M&A risks in spotlight.
Sarepta paused drug shipments amid backlash—biotech volatility rising.
LA Times plans IPO—media valuations may resurface.
Crypto Moves:
Trump Media bought $2B in Bitcoin and related assets, aiming to become a crypto treasury.
JPMorgan may lend against crypto, signaling broader institutional adoption.
Tech & AI:
MIT’s Andrew Lo predicts AI will make real investment decisions in 5 years.
OpenAI–Oracle to expand US data center capacity by 4.5 GW—significant tech infrastructure tailwind.
Conclusion for S&P 500 Trading:
The S&P 500 remains supported by strong risk appetite, AI optimism, and crypto momentum, but faces near-term tests from key tech earnings (Alphabet, Tesla). Political noise around the Fed and signs of speculative froth (meme stocks) could introduce volatility. Stay bullish with caution—watch earnings and Fed commentary closely for market direction.
Key Support and Resistance Levels
Resistance Level 1: 6340
Resistance Level 2: 6390
Resistance Level 3: 6457
Support Level 1: 6270
Support Level 2: 6224
Support Level 3: 6156
This communication is for informational purposes only and should not be viewed as any form of recommendation as to a particular course of action or as investment advice. It is not intended as an offer or solicitation for the purchase or sale of any financial instrument or as an official confirmation of any transaction. Opinions, estimates and assumptions expressed herein are made as of the date of this communication and are subject to change without notice. This communication has been prepared based upon information, including market prices, data and other information, believed to be reliable; however, Trade Nation does not warrant its completeness or accuracy. All market prices and market data contained in or attached to this communication are indicative and subject to change without notice.
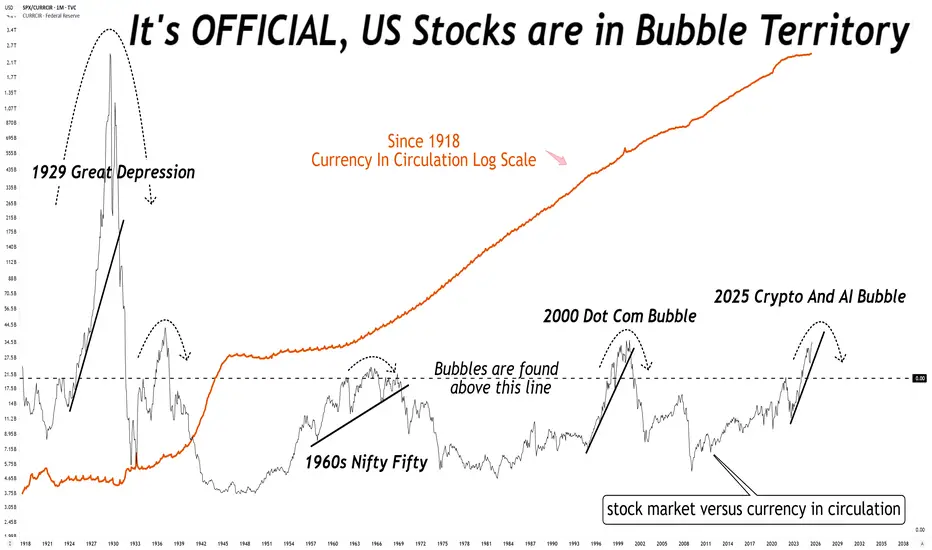
What do you mean the stock market is not in a bubble?What do you mean the stock market is not in a bubble?
No, it is not different this time, there is always a reversion to mean.
NasdaqThis is 3-5 day buy setup. Followed by a M formation. Inside day formation
Great to scale in near High of day & low of the day after a clear detailed setup with confirmations.

Nifty Analysis EOD – July 22, 2025 – Tuesday🟢 Nifty Analysis EOD – July 22, 2025 – Tuesday 🔴
"Bulls Tried, Bears Decided – Tug of War Ends Below Support"
Nifty opened with an 88-point gap-up, continuing the bullish sentiment, right at the resistance zone of 25,180 ~ 25,212. However, the market opened at the high (OH) and quickly slipped around 100 points to form the Initial Balance (IB). After a brief bounce back to the mean, it faced resistance, leading to a breakdown of IB and further losses of 77 points.
A supportive bounce emerged near 25,060 ~ 25,080, but the price was pushed down again by PDH + VWAP + R1. The day closed below PDC and under the support zone at 25,065, showing bearish dominance despite a volatile tug-of-war between bulls and bears.
Today’s low tested the 0.5 Fibonacci retracement level (from yesterday’s low to today’s high). If this is truly a retracement, 25K must hold in upcoming sessions, and bulls will need to reclaim 25,200 to regain their grip.
🕯 5 Min Time Frame Chart with Intraday Levels
🕯 Daily Time Frame Chart with Intraday Levels
📊 Daily Candle Breakdown
Open: 25,166.65
High: 25,182.00
Low: 25,035.55
Close: 25,060.90
Change: −29.80 (−0.12%)
Candle Structure:
Real Body: Red (−105.75 pts) → Decent bearish body
Upper Wick: 15.35 pts → Small
Lower Wick: 25.35 pts → Moderate
Interpretation:
Price opened strong but faced selling near 25,180, leading to a steady drop throughout the session. The lower wick shows some buying attempt near 25,035, but the close below open signals bears dominated.
Candle Type:
Bearish candle with moderate lower wick – resembles a Bearish Engulfing setup after a green candle, suggesting profit-booking or fresh selling.
Key Insight:
Sellers defending 25,180–25,200 firmly
Holding above 25,030–25,050 is critical; breaking this could retest 24,950–25,000
Bulls must reclaim 25,120–25,150 for momentum revival
🛡 5 Min Intraday Chart
⚔️ Gladiator Strategy Update
ATR: 182.32
IB Range: 92.6 → Medium
Market Structure: Balanced
Trades Triggered:
10:45 AM – Short Trade → Trailing SL Hit (1:0.8)
12:45 PM – Long Trade → SL Hit
📌 Support & Resistance Levels
Resistance:
25,080 ~ 25,060
25,125
25,168
25,180 ~ 25,212
Support:
25,037
25,000 ~ 24,980
24,965
24,894 ~ 24,882
24,825
24,800 ~ 24,768
🧠 Final Thoughts:
"Markets often dance between zones of power — where bulls flex and bears press. It's not chaos, it's the choreography of sentiment."
The 25,000–25,212 zone continues to be the battlefield. Let’s see who seizes the upper hand tomorrow.
✏️ Disclaimer:
This is just my personal viewpoint. Always consult your financial advisor before taking any action.
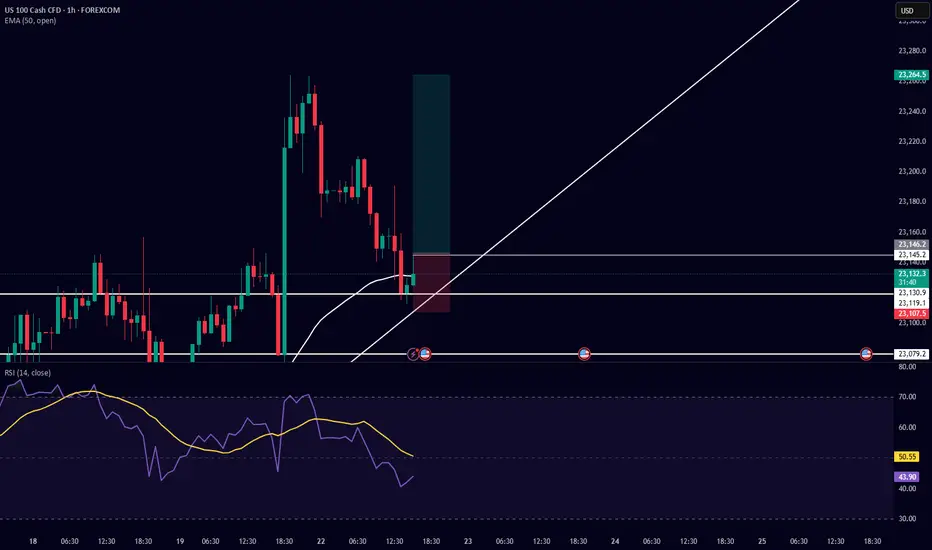
Trade Setup Description (Buy Side) – US100 (Nasdaq 100) 5-MinuteI am taking a buy-side trade on US100 based on the following confluences:
Support & Trendline Respect:
Price respected a horizontal support level near 23,079.2 and is currently bouncing from a rising trendline, showing potential for a bullish move.
Bullish Candlestick Reaction:
After testing the trendline, bullish candles formed, indicating buying interest at this zone.
EMA 50 Reclaim Potential:
Price is attempting to reclaim the 50 EMA (currently at 23,141.3). A successful break and hold above it would confirm bullish momentum.
RSI Confirmation:
RSI is currently around 47 and curving upwards, indicating a potential reversal from oversold/neutral territory. The RSI yellow moving average is also turning up.
Risk-Reward Ratio:
The setup has a favorable risk-to-reward ratio with the stop loss placed just below the trendline and recent wick low, and the target placed above the recent high around 23,264.5.
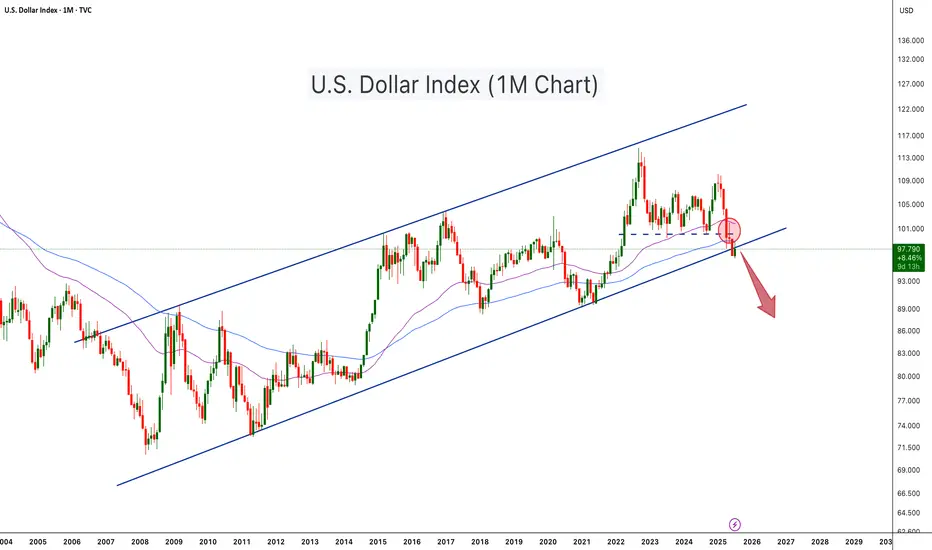
U.S. Dollar Index Loses Key Support – Crypto Bull Run Loading?The U.S. Dollar Index (DXY) has just broken below a long-term ascending channel, which has held since 2008. After losing the key horizontal support (~100 level), DXY retested and rejected from it (red circle), confirming a potential trend reversal. The move is technically significant and hints at further downside, possibly toward the 88–90 zone or lower.
This breakdown aligns with classic macro cycles, where a weaker dollar often fuels bullish momentum in risk assets, especially crypto. Historically:
-DXY downtrends in 2017 and 2020–2021 coincided with major Bitcoin and altcoin bull runs.
-DXY strength during 2018 and 2022 contributed to crypto bear markets.
With DXY now below both horizontal and diagonal support, Bitcoin and the broader crypto market may be entering the next expansion phase, especially if the dollar continues its downward trajectory
-DXY has broken below a 17 year rising channel – a macro bearish signal.
-Rejection from former support turned resistance confirms breakdown.
-A falling DXY historically corresponds with Bitcoin rallies and altseason expansions.
-Declining dollar strength could be the fuel that propels Bitcoin past $140K and Ethereum above $6K.
-A dollar bear trend may fuel total crypto market cap breakout beyond $4T+.
As DXY weakens, liquidity tends to rotate into risk-on assets like crypto. This setup mirrors pre-bull run environments seen in 2017 and 2020. A structural breakdown in the dollar could act as a catalyst for Bitcoin’s next major leg up.
Cheers
Hexa
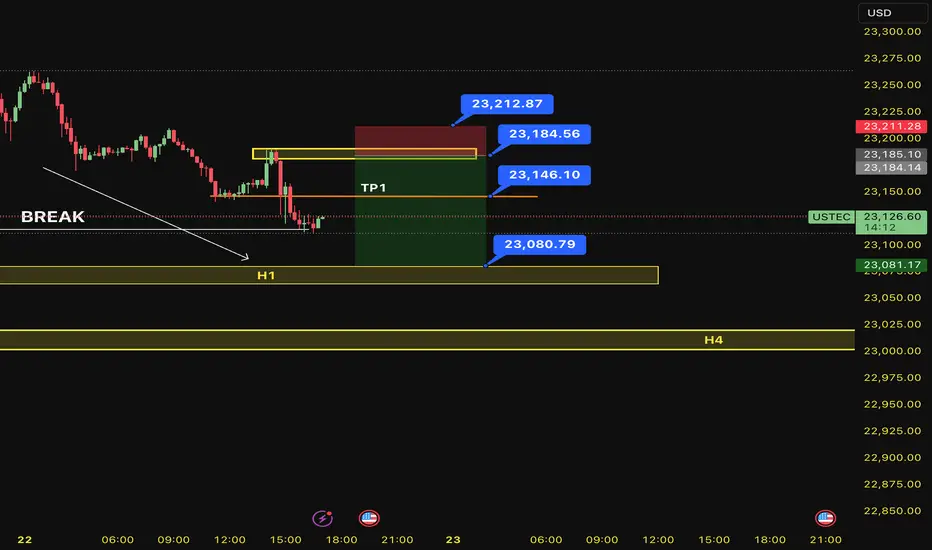
SELL USTEC 22.7.2025Confluence trade order: SELL at M15
Type of entry: Limit order
Condition:
- If the price break down THE LAST TOP confirming the down trend into H1.
Note:
- Management of money carefully at the price of bottom (23,146)
Set up entry:
- Entry sell at 23,184
- SL at 23,212
- TP1: 23,146
- TP2: 23,080
Trading Method: Price action (No indicator, only trend and candles)
BankNifty levels - Jul 23, 2025Utilizing the support and resistance levels of BankNifty, along with the 5-minute timeframe candlesticks and VWAP, can enhance the precision of trade entries and exits on or near these levels. It is crucial to recognize that these levels are not static, and they undergo alterations as market dynamics evolve.
The dashed lines on the chart indicate the reaction levels, serving as additional points of significance. Furthermore, take note of the response at the levels of the High, Low, and Close values from the day prior.
We trust that this information proves valuable to you.
* If you found the idea appealing, kindly tap the Boost icon located below the chart. We encourage you to share your thoughts and comments regarding it.
Wishing you successful trading endeavors!

Nifty levels - Jul 23, 2025Nifty support and resistance levels are valuable tools for making informed trading decisions, specifically when combined with the analysis of 5-minute timeframe candlesticks and VWAP. By closely monitoring these levels and observing the price movements within this timeframe, traders can enhance the accuracy of their entry and exit points. It is important to bear in mind that support and resistance levels are not fixed, and they can change over time as market conditions evolve.
The dashed lines on the chart indicate the reaction levels, serving as additional points of significance to consider. Furthermore, take note of the response at the levels of the High, Low, and Close values from the day prior.
We hope you find this information beneficial in your trading endeavors.
* If you found the idea appealing, kindly tap the Boost icon located below the chart. We encourage you to share your thoughts and comments regarding it.
Wishing you success in your trading activities!

US30Given the current COT data, technical indicators, and economic factors, the bias for the US30 is bearish. Traders should monitor upcoming economic reports and Federal Reserve announcements for potential shifts in market sentiment.

Straight into my SELL zone! NAS100A long into my sell zone, small lot, biggish SL..
I believe this will hit TP before the Powell speech, if both trades work out, it will be a great day!
good luck
NextGenTraders
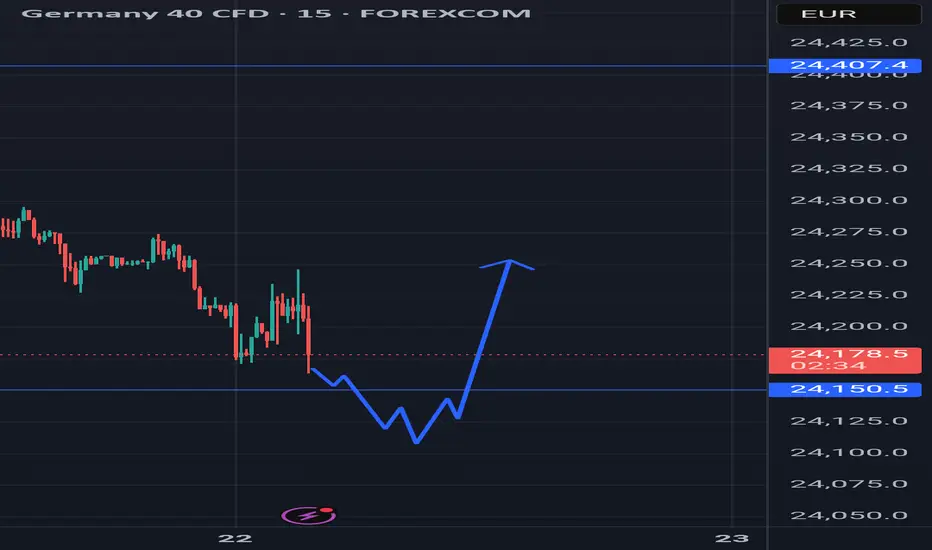
DAX40 Support retest at 24085The DAX remains in a bullish trend, with recent price action showing signs of a resistance breakout within the broader uptrend.
Support Zone: 24085 – a key level from previous consolidation. Price is currently testing or approaching this level.
A bullish rebound from 24085 would confirm ongoing upside momentum, with potential targets at:
24490 – initial resistance
24640 – psychological and structural level
24780 – extended resistance on the longer-term chart
Bearish Scenario:
A confirmed break and daily close below 24085 would weaken the bullish outlook and suggest deeper downside risk toward:
23970 – minor support
23800 – stronger support and potential demand zone
Outlook:
Bullish bias remains intact while the DAX holds above 24085. A sustained break below this level could shift momentum to the downside in the short term.
This communication is for informational purposes only and should not be viewed as any form of recommendation as to a particular course of action or as investment advice. It is not intended as an offer or solicitation for the purchase or sale of any financial instrument or as an official confirmation of any transaction. Opinions, estimates and assumptions expressed herein are made as of the date of this communication and are subject to change without notice. This communication has been prepared based upon information, including market prices, data and other information, believed to be reliable; however, Trade Nation does not warrant its completeness or accuracy. All market prices and market data contained in or attached to this communication are indicative and subject to change without notice.
NAS100 Bullish Setup: Clean Structure & Entry Zone Pending📊 NASDAQ 100 (NAS100) remains bullish, showing a clean, well-structured uptrend—higher highs and higher lows 🔼📈.
Price has now pulled back into my optimal entry zone 🎯. At this stage, I’m waiting for a bullish break in market structure before considering an entry 🟢🔓.
Patience is key—let the structure confirm first.
Not financial advice ❌💼

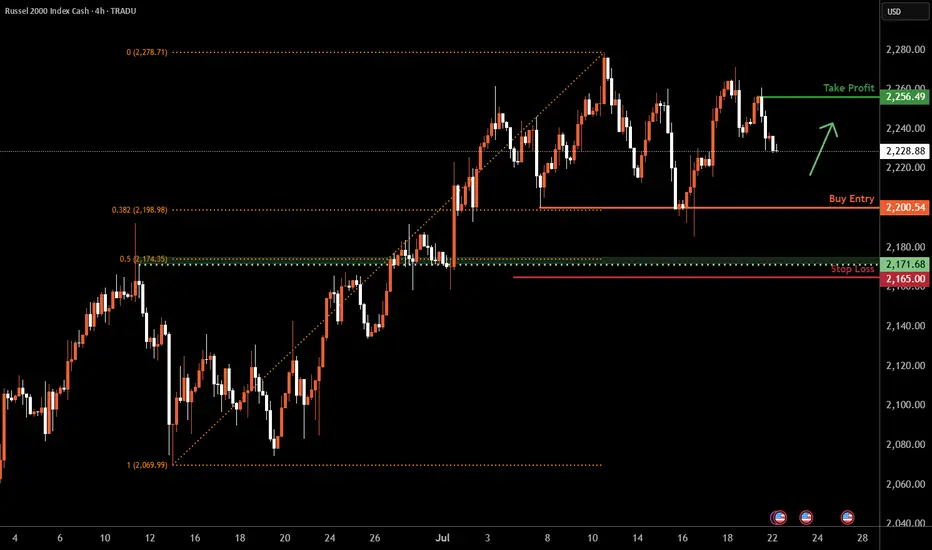
Russell 2000 H4 | Falling toward a multi-swing-low supportThe Russell 2000 (US2000) is falling towards a multi-swing-low support and could potentially bounce off this level to climb higher.
Buy entry is at 2,200.54 which is a multi-swing-low support that aligns with the 38.2% Fibonacci retracement.
Stop loss is at 2,165.00 which is a level that lies underneath an overlap support and the 50% Fibonacci retracement.
Take profit is at 2,256.49 which is a swing-high resistance.
High Risk Investment Warning
Trading Forex/CFDs on margin carries a high level of risk and may not be suitable for all investors. Leverage can work against you.
Stratos Markets Limited (tradu.com ):
CFDs are complex instruments and come with a high risk of losing money rapidly due to leverage. 66% of retail investor accounts lose money when trading CFDs with this provider. You should consider whether you understand how CFDs work and whether you can afford to take the high risk of losing your money.
Stratos Europe Ltd (tradu.com ):
CFDs are complex instruments and come with a high risk of losing money rapidly due to leverage. 66% of retail investor accounts lose money when trading CFDs with this provider. You should consider whether you understand how CFDs work and whether you can afford to take the high risk of losing your money.
Stratos Global LLC (tradu.com ):
Losses can exceed deposits.
Please be advised that the information presented on TradingView is provided to Tradu (‘Company’, ‘we’) by a third-party provider (‘TFA Global Pte Ltd’). Please be reminded that you are solely responsible for the trading decisions on your account. There is a very high degree of risk involved in trading. Any information and/or content is intended entirely for research, educational and informational purposes only and does not constitute investment or consultation advice or investment strategy. The information is not tailored to the investment needs of any specific person and therefore does not involve a consideration of any of the investment objectives, financial situation or needs of any viewer that may receive it. Kindly also note that past performance is not a reliable indicator of future results. Actual results may differ materially from those anticipated in forward-looking or past performance statements. We assume no liability as to the accuracy or completeness of any of the information and/or content provided herein and the Company cannot be held responsible for any omission, mistake nor for any loss or damage including without limitation to any loss of profit which may arise from reliance on any information supplied by TFA Global Pte Ltd.
The speaker(s) is neither an employee, agent nor representative of Tradu and is therefore acting independently. The opinions given are their own, constitute general market commentary, and do not constitute the opinion or advice of Tradu or any form of personal or investment advice. Tradu neither endorses nor guarantees offerings of third-party speakers, nor is Tradu responsible for the content, veracity or opinions of third-party speakers, presenters or participants.
US 100 (NDQ) : Stay Heavy on PositionsApril Fear & Buy Signals
In early April, the Nasdaq 100 experienced a sharp sell-off, triggering extreme fear sentiment across the market.
At that point, scale-in buy signals appeared—classic "buy the fear" conditions.
Markets swing between greed and fear—unless the whole country collapses. Right now, greed is taking the lead, but the real blow-off top volatility hasn’t even started yet.
Stay Heavy on Positions
Despite short-term uncertainty, I’m maintaining an overweight position on the Nasdaq 100.
As long as we don’t see a major breakdown, the bias remains bullish.

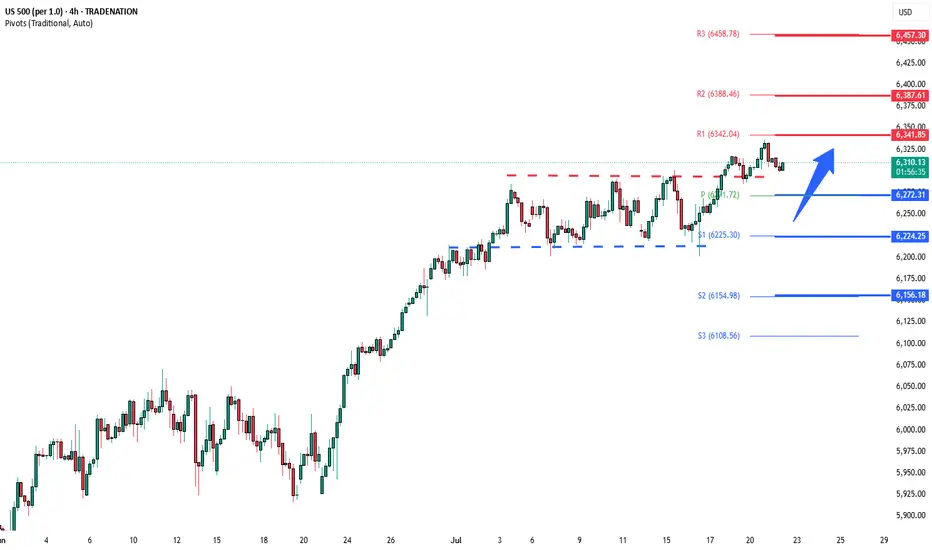
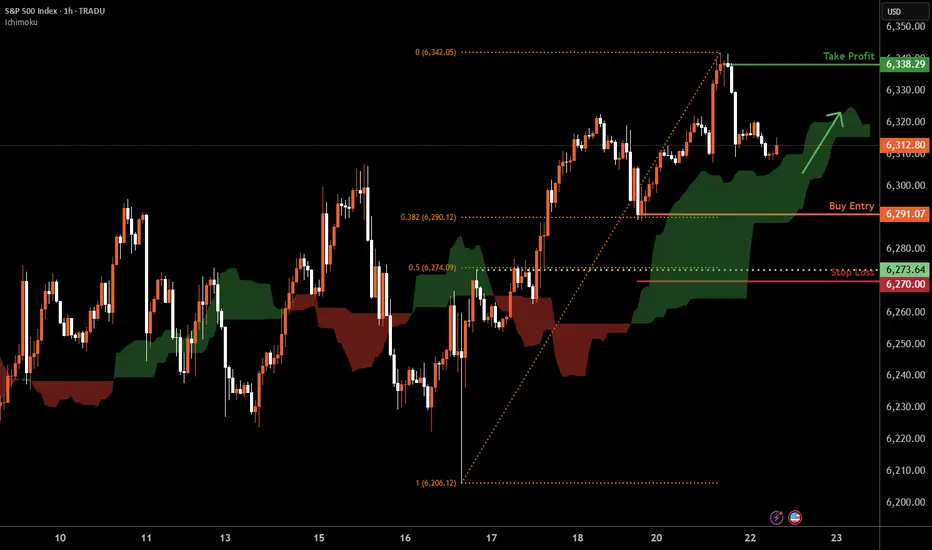
S&P 500 H1 | Swing-low support at 38.2% Fibonacci retracementThe S&P 500 (SPX500) is falling towards a swing-low support and could potentially bounce off this level to climb higher.
Buy entry is at 6,291.07 which is a swing-low support that aligns with the 38.2% Fibonacci retracement.
Stop loss is at 6,270.00 which is a level that lies underneath a pullback support and the 50% Fibonacci retracement.
Take profit is at 6,338.29 which is a swing-high resistance.
High Risk Investment Warning
Trading Forex/CFDs on margin carries a high level of risk and may not be suitable for all investors. Leverage can work against you.
Stratos Markets Limited (tradu.com ):
CFDs are complex instruments and come with a high risk of losing money rapidly due to leverage. 66% of retail investor accounts lose money when trading CFDs with this provider. You should consider whether you understand how CFDs work and whether you can afford to take the high risk of losing your money.
Stratos Europe Ltd (tradu.com ):
CFDs are complex instruments and come with a high risk of losing money rapidly due to leverage. 66% of retail investor accounts lose money when trading CFDs with this provider. You should consider whether you understand how CFDs work and whether you can afford to take the high risk of losing your money.
Stratos Global LLC (tradu.com ):
Losses can exceed deposits.
Please be advised that the information presented on TradingView is provided to Tradu (‘Company’, ‘we’) by a third-party provider (‘TFA Global Pte Ltd’). Please be reminded that you are solely responsible for the trading decisions on your account. There is a very high degree of risk involved in trading. Any information and/or content is intended entirely for research, educational and informational purposes only and does not constitute investment or consultation advice or investment strategy. The information is not tailored to the investment needs of any specific person and therefore does not involve a consideration of any of the investment objectives, financial situation or needs of any viewer that may receive it. Kindly also note that past performance is not a reliable indicator of future results. Actual results may differ materially from those anticipated in forward-looking or past performance statements. We assume no liability as to the accuracy or completeness of any of the information and/or content provided herein and the Company cannot be held responsible for any omission, mistake nor for any loss or damage including without limitation to any loss of profit which may arise from reliance on any information supplied by TFA Global Pte Ltd.
The speaker(s) is neither an employee, agent nor representative of Tradu and is therefore acting independently. The opinions given are their own, constitute general market commentary, and do not constitute the opinion or advice of Tradu or any form of personal or investment advice. Tradu neither endorses nor guarantees offerings of third-party speakers, nor is Tradu responsible for the content, veracity or opinions of third-party speakers, presenters or participants.
US30Recent COT data shows rising net short positions on U.S. equity indices, reflecting bearish sentiment from institutional traders toward the Dow (US30). This indicates growing caution or expectations of downside pressure.

DXYThe latest COT data shows net short positions increasing on the U.S. Dollar, indicating a bearish sentiment from institutional traders. A rising short bias suggests weakening confidence in the dollar’s strength across major currencies.

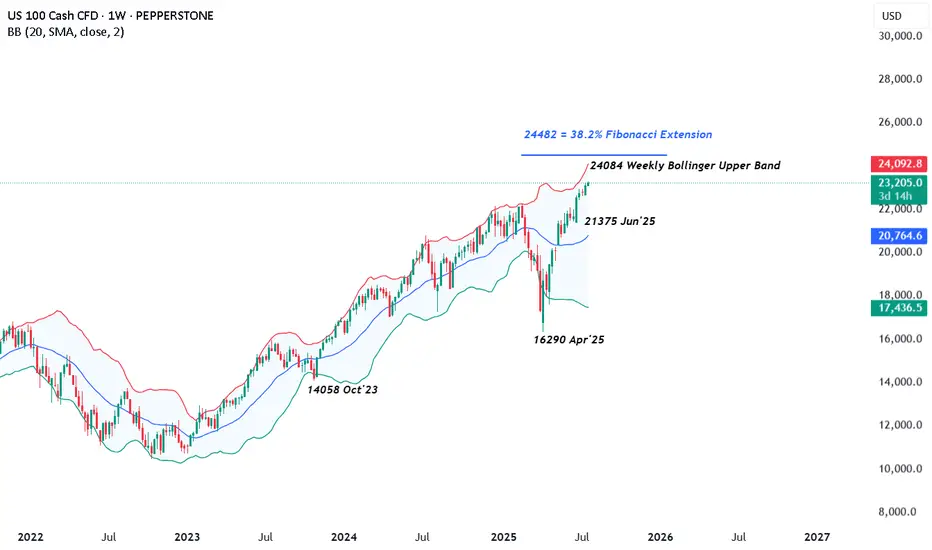
US 100 – All Eyes on Tariffs, Trade Deals and Tech EarningsRenewed demand for US assets has been evident throughout July so far and this has helped to lift the US 100 index to new heights with gains of over 2.5% across the month. The technology heavy index has risen from opening levels around 22650 on July 1st, then recorded several all time highs, before eventually finding some selling interest after printing the most recent record peak at 23282 yesterday afternoon.
This upside has been supported by fresh trader hopes of interest rate cuts, after Federal Reserve (Fed) policymaker Waller suggested last Thursday that he would consider a 25bps (0.25%) reduction at their next meeting on July 30th, despite Fed Chairman Powell maintaining the view that the US central bank are currently pursuing a wait and see approach, as they look for more information on inflation and growth trends to assist them to determine the on-going impact of tariffs.
Part of the reason for the Fed’s reluctance to cut rates has also been the resilience of US economic data. With US consumers still spending and employment yet to feel the negative impact of President Trump’s tariff policies, leading to a potential positive knock-on impact for growth and corporate earnings, when considered against prior downbeat market expectations.
This all leads nicely onto what could be a key sentiment driver for the direction of the US 100 this week, the start of earnings updates from the ‘Magnificent Seven’ tech companies, two of which, Alphabet and Tesla, report their earnings after the market close tomorrow. These are then followed by Microsoft and Meta on Wednesday July 30th, then Amazon and Apple on Thursday July 31st.
Traders will be keen to judge actual earnings against market expectations, alongside updates on AI spending and investment, forward guidance on the impact of tariffs and more specifically for Tesla, the time Elon Musk may dedicate to the company, rather than the distractions of politics.
The technical outlook could also be important.
Technical Update: Can The Positive Trend Extend Further?
There appears to be no clear-cut signs of a negative sentiment shift in the US 100 index yet, as fresh buying has continued to develop above support provided by the rising daily Bollinger mid-average, currently at 22785 (see chart below).
Of course, there is no guarantee this positive pattern of higher price highs and higher price lows will continue, especially given the on-going trade discussion between the US and its allies, as well as the earnings announcements from Alphabet and Tesla.
However, it can be useful for traders to prepare for any future volatility by assessing potential support and resistance levels that could impact the direction of the US 100 moving forward.
Potential Support Levels:
It is possible the rising Bollinger mid-average, currently at 22785, represents a first support focus for traders, and as such, closing breaks below this level might lead to a more extended phase of price weakness.
Such moves could see a deeper sell-off towards 22533, which is equal to the 38.2% Fibonacci retracement of June 23rd to July 18th 2025 price strength.
Potential Resistance Levels:
With fresh price strength emerging with the US 100 index above the rising Bollinger mid-average, a positive price pattern of higher highs and higher lows, may still be evident. This reflects buyers are currently willing to pay higher prices, each time a setback materialises.
However, to maintain this uptrend pattern in price, the focus could now be on resistance provided by the July high at 23282 (July 21st). Closing breaks above this level might be required to suggest further strength, towards the next potential resistance level at 24084, which is the weekly Bollinger upper band, even 24482, which is equal to the 38.2% Fibonacci extension.
The material provided here has not been prepared in accordance with legal requirements designed to promote the independence of investment research and as such is considered to be a marketing communication. Whilst it is not subject to any prohibition on dealing ahead of the dissemination of investment research, we will not seek to take any advantage before providing it to our clients.
Pepperstone doesn’t represent that the material provided here is accurate, current or complete, and therefore shouldn’t be relied upon as such. The information, whether from a third party or not, isn’t to be considered as a recommendation; or an offer to buy or sell; or the solicitation of an offer to buy or sell any security, financial product or instrument; or to participate in any particular trading strategy. It does not take into account readers’ financial situation or investment objectives. We advise any readers of this content to seek their own advice. Without the approval of Pepperstone, reproduction or redistribution of this information isn’t permitted.