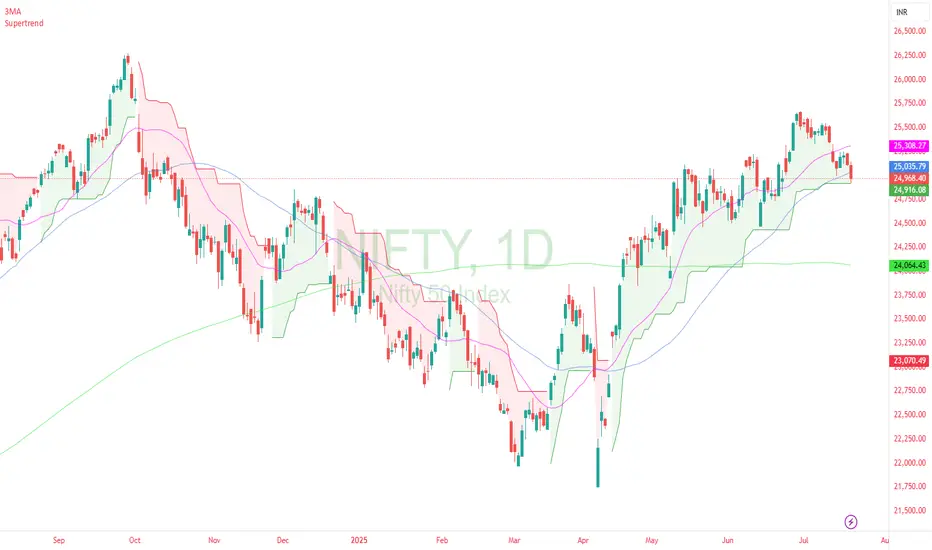
nifty dailyThis is great chart . Price is at Supertrend support on daily chart. Lowest risk in going long. Best technical chart in while .
Market indices
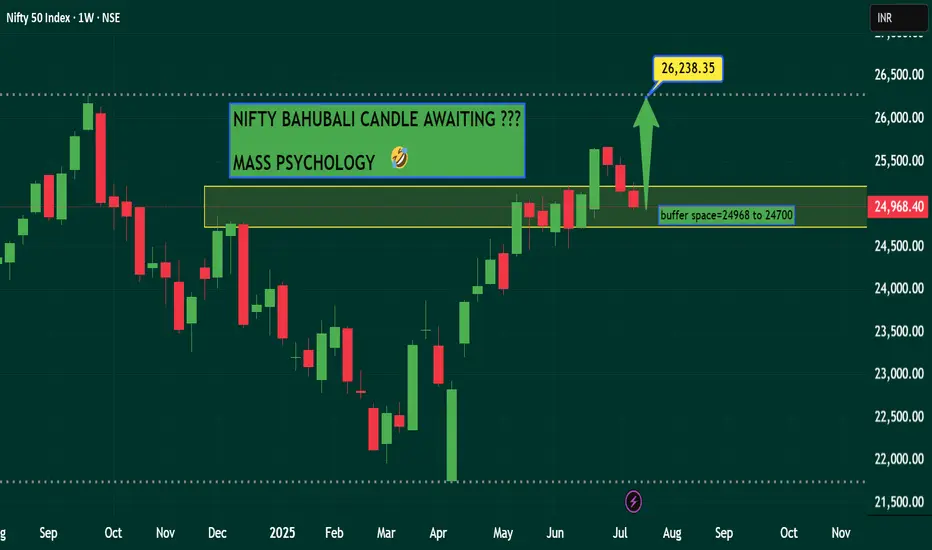
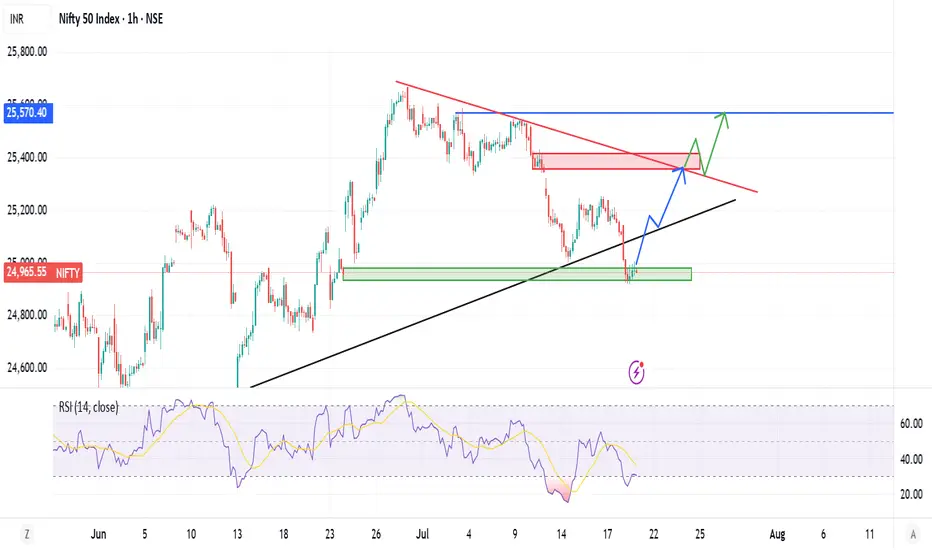
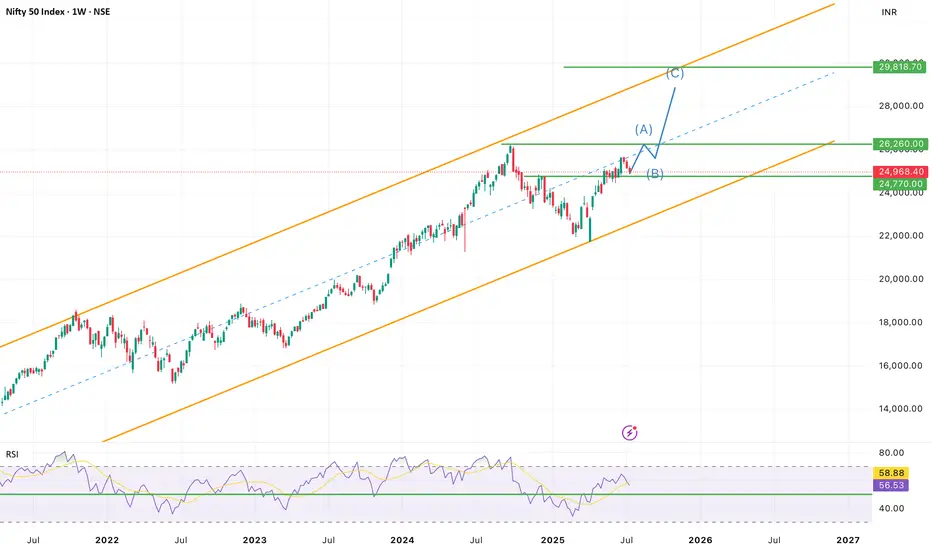
NIFTY - NEW HIGH SOON...NSE:NIFTY Weekly chart showing negative closing from last three weeks, but undertone of the market showing something big to come on price. Rsi giving positive divergence on intraday timeframes.
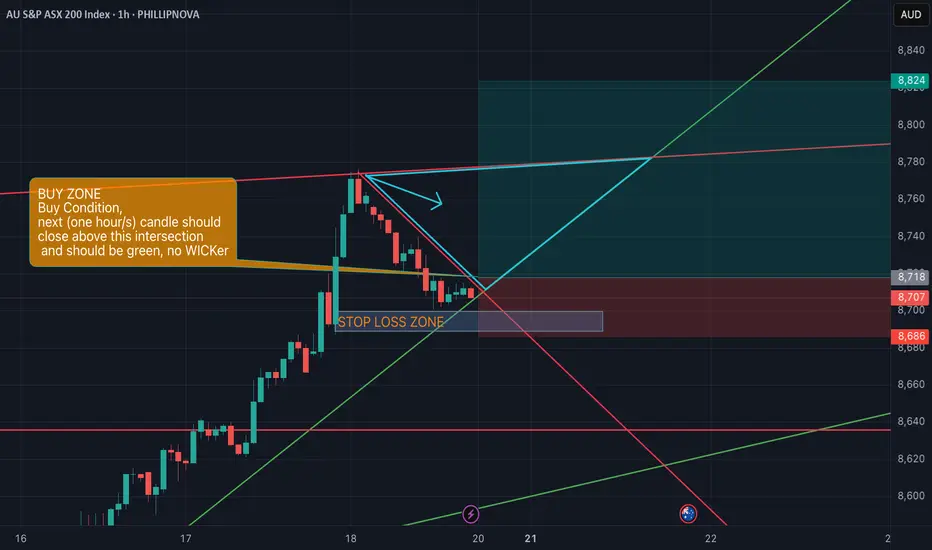
AUS200 Breakout or Fakeout? I Say Breakout – Here's Why🔍 Technical Overview:
After monitoring the recent movement in AUS200, I believe we are in the early phase of a bullish breakout continuation rather than a fakeout.
Uptrend Structure: Price has been consistently respecting higher lows and trending above the green trendline.
Break of Descending Resistance: The downtrend line has now been pierced with momentum candles — a bullish sign.
Buy Condition Set:
Next 1-hour/s candle should close above the intersection (highlighted zone).
Candle should be green, and preferably no wick on the top (indicating strength).
Volume analysis to be considered on confirmation.
✅ Trade Plan:
Buy Zone marked.
Stop Loss Zone clearly defined – I plan to exit the trade if price closes back below the shaded red/gray zone.
Upside Potential: Initial target around 8,820–8,840, with extension toward 8,900+ if momentum sustains.
Risk/Reward ratio looks favorable based on current structure.
📰 Fundamentals:
I have not yet identified any bearish macro or news catalyst that contradicts the current technical picture. If you know of any relevant developments (e.g., RBA policy, earnings, CPI releases), feel free to comment.
🔄 Validation Request:
Would love the community’s take:
Do you see this as a valid breakout?
Any hidden divergence or bearish signals I might have missed?
Let me know if you're tracking the same structure or see something different.
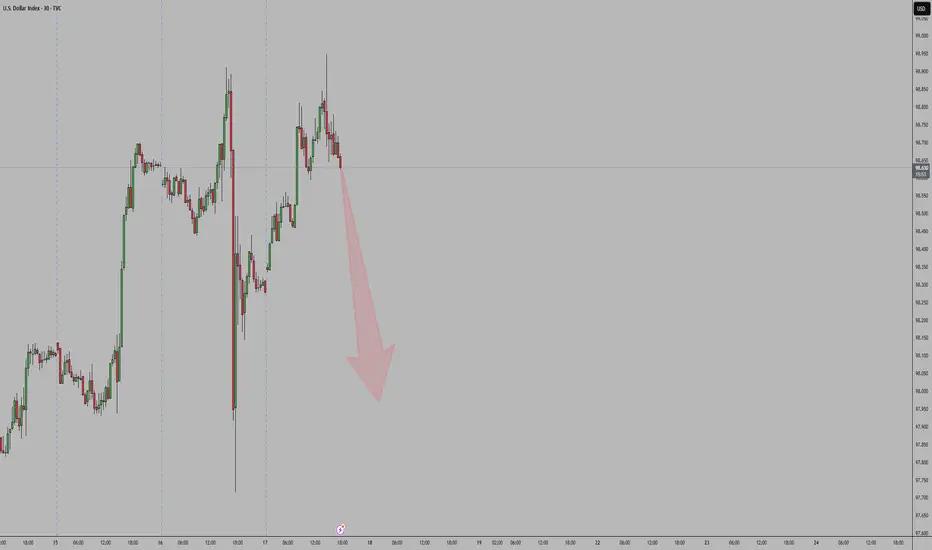
DXYShort-Term Bearish DXY – Key Reasons
1. Rate Cut Expectations
Markets are pricing in at least one Fed rate cut in Q3 2025 due to slowing inflation and weaker consumer data.
Lower interest rates reduce demand for the dollar, pushing DXY lower.
NASDAQ Short OpportunityPrice formed a distribution schematic 1 and currently forming the LPSY at OTE Level

nifty 50 on strong momentumgood momentum seen over nifty , also on good support minor bounce can convert in to a good reversal which can lead it to supply zone or above.
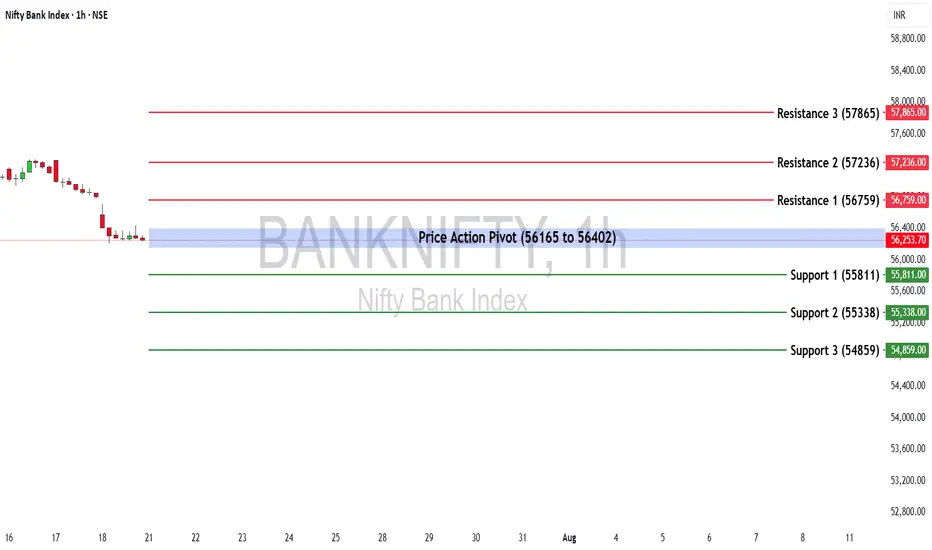
Bank Nifty Weekly Insights: Key Levels & TrendsBank Nifty ended the week at 56,283.00, registering a marginal decline of -0.83%.
🔹 Key Levels for the Upcoming Week
📌 Price Action Pivot Zone:
The critical zone to monitor for potential trend reversals or continuation lies between 56,165 and 56,402.
🔻 Support Levels:
Support 1 (S1): 55,811
Support 2 (S2): 55,338
Support 3 (S3): 54,859
🔺 Resistance Levels:
Resistance 1 (R1): 56,759
Resistance 2 (R2): 57,236
Resistance 3 (R3): 57,865
📈 Market Outlook
✅ Bullish Scenario:
If Bank Nifty sustains above the pivot zone (56,402), it may trigger renewed buying interest, potentially pushing the index toward R1 (56,759) and higher levels like R2 (57,236) and R3 (57,865).
❌ Bearish Scenario:
A breakdown below the lower end of the pivot zone at 56,165 may attract selling pressure, dragging the index towards S1 (55,811) and possibly lower levels like S2 (55,338) and S3 (54,859).
Disclaimer: lnkd.in
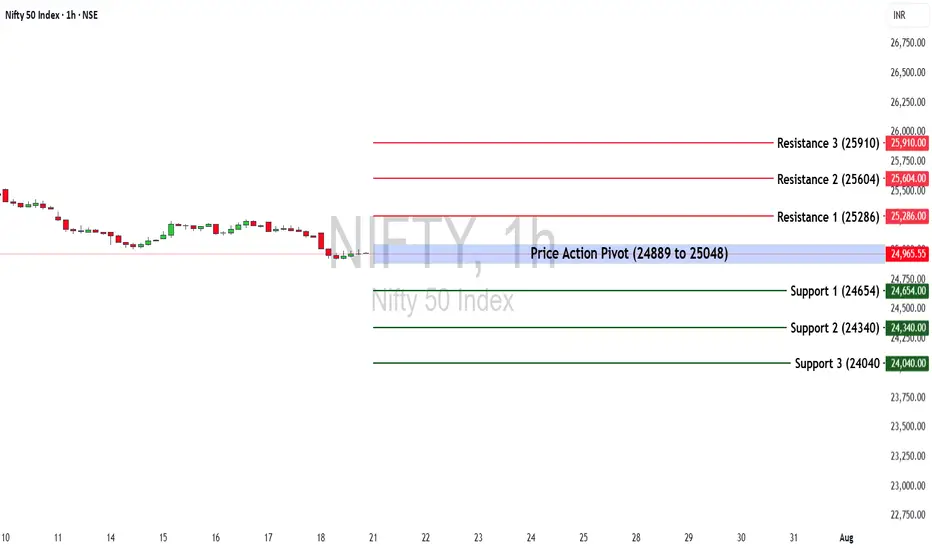
Nifty 50 at a Turning Point? Key Levels & Market Outlook AheadThe Nifty 50 ended the week at 25,149.85, posting a loss of -1.22%.
🔹 Key Levels for the Upcoming Week
📌 Price Action Pivot Zone:
24,889 to 25,048 – This is a crucial range to monitor for potential trend reversals or continuation. A breakout or breakdown from this zone can set the tone for the week.
🔻 Support Levels:
S1: 24,654
S2: 24,340
S3: 24,040
🔺 Resistance Levels:
R1: 25,286
R2: 25,604
R3: 25,910
📈 Market Outlook
✅ Bullish Scenario:
A sustained move above 25,048 (top of the pivot zone) may invite buying interest. If momentum continues, the index could test R1 (25,286) and possibly extend towards R2 (25,604) and R3 (25,910).
❌ Bearish Scenario:
Failure to hold the pivot zone and a breakdown below 24,889 could trigger further downside. The index may slide towards S1 (24,654) and deeper supports at S2 (24,340) and S3 (24,040).
Disclaimer: lnkd.in
Nifty Closes Below 25,000 — What Lies Ahead?The Indian market's recent uptrend appears to be losing momentum, as the benchmark Nifty index extended its decline for the third consecutive week, ending just below the important 25,000 mark.
This pullback has been largely driven by weakness in the Financial and IT sectors, with major players like NSE:TCS , NSE:HCLTECH , and NSE:AXISBANK posting disappointing earnings.
From a technical perspective, the index is now approaching a key support zone near 24,900. A decisive break below this level could open the door for a further slide towards 24,500.
Open Interest (OI) data reinforces this view, with the 25,000–24,900 zone seeing the highest put writing, marking it as an immediate support area. On the upside, strong call writing at 25,100 and 25,200 on Friday suggests these levels will act as immediate resistance.
Given the current structure, the outlook for the coming week remains neutral to bearish.
Traders are advised to stay cautious, manage risk effectively, and keep a close watch on these crucial levels.

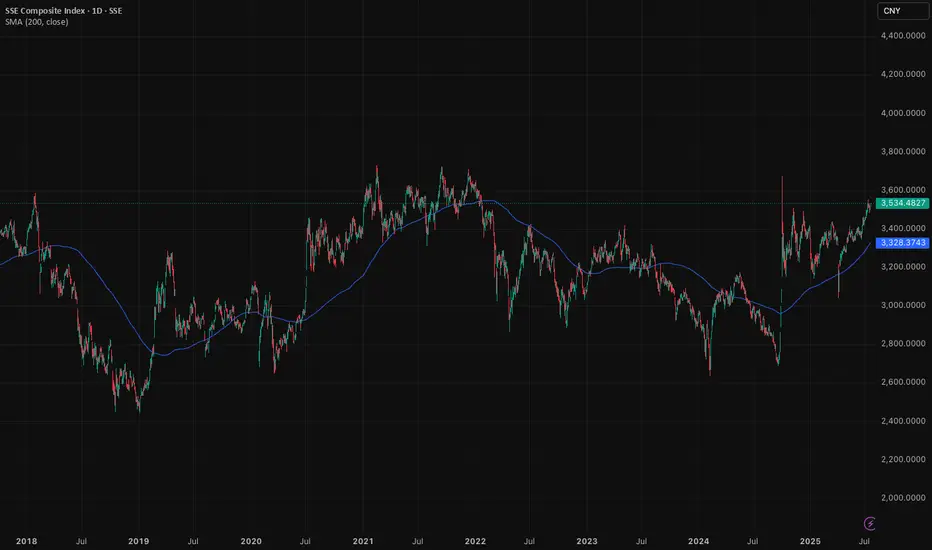
Shanghai Composite: Double bottom signals potential upsideChinese stocks are not for the faint-hearted. It's a market with a lot of volatility, swings, and roundabouts. Despite this, we've been keeping a close eye on the Shanghai Composite Index over the past few weeks and like the pattern we are seeing emerge.
As of the time of writing, the Shanghai Composite Index trades in the 3,500 range. A clear double bottom emerged in September and January last year, as indicated in the chart. We think this is a bullish pattern. When markets test the lows twice and rebound, conviction grows. The worst, it seems, is maybe behind us.
New trades should take important note and understand that Shanghai-listed stocks differ greatly from the H-shares trading in Hong Kong. The Shanghai Composite primarily includes A-shares, domestic Chinese companies driven by local sentiment and liquidity. H-shares, though still Chinese firms, list offshore in Hong Kong and often reflect global investor attitudes rather than local momentum.
Understanding your instrument is crucial. While Shanghai A-shares capture China's domestic economic pulse, H-shares in Hong Kong frequently mirror global risk appetite and geopolitical narratives. Our bullish case lies specifically with the Shanghai market. It is a bet on China's internal economic recovery, supportive policy measures, and improving investor sentiment.
China’s economic stabilisation is underway. Stimulus measures from Beijing are gaining traction. Property market stabilisation efforts (which are medium term in nature) and easing monetary policy signal confidence. Domestic investors, increasingly optimistic, are positioned to drive a sustained rally.
The Shanghai Composite Index could see upside towards the 4,000 and then 4,500-level in the coming years, if the rally continues. Our conviction rests on improving domestic fundamentals, policy tailwinds, and powerful market sentiment unique to mainland China's equity landscape.
Caution is important, given the volatility nature of the index.
The forecasts provided herein are intended for informational purposes only and should not be construed as guarantees of future performance. This is an example only to enhance a consumer's understanding of the strategy being described above and is not to be taken as Blueberry Markets providing personal advice.
nifty support levelSupport is the level at which demand is strong enough to stop the index from falling any further
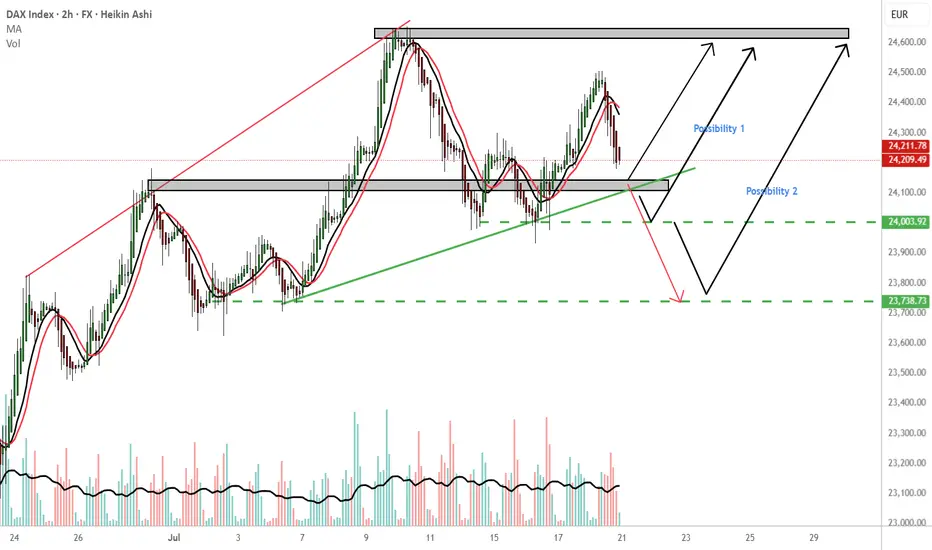
GER 30 endless possibilitiesMy most immediate outcome is reversal 24,140 price area. TP:24,600
Possibility 1: If Ger 30 holds the 24,000 price area i would consider a buy to 24,600.
Possibility 2: If Ger30 holds the 23,730 price area that would be another possibility for a buy. TP 24,600.
WCS: Worst case scenario, continuation downwards from the 24140 PL. Consider the red arrow. The 24,140 is a important price area please wait for confirmation
Please follow your trading plan.
THOUGHTS????
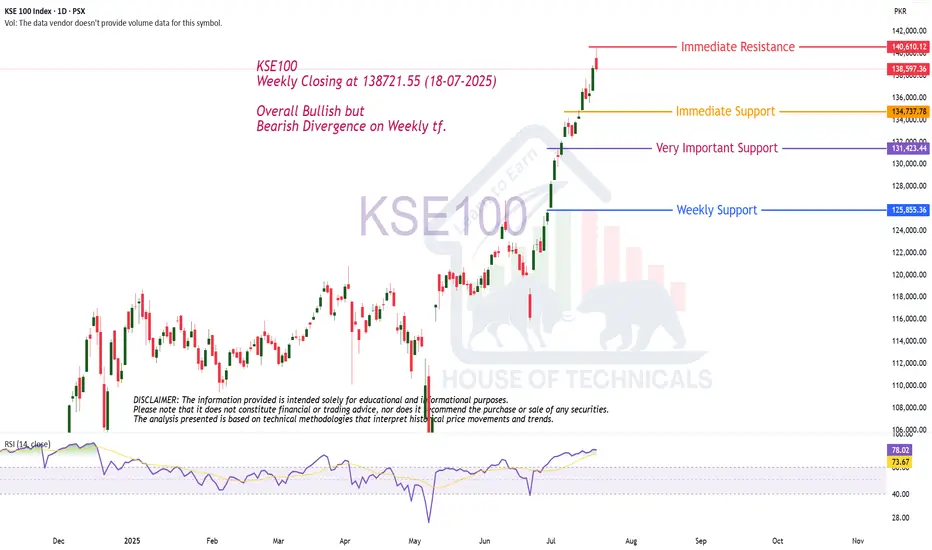
Bullish but Weekly Bearish Divergence ...KSE100
Weekly Closing at 138721.55 (18-07-2025)
Overall Bullish but
Bearish Divergence on Weekly tf.
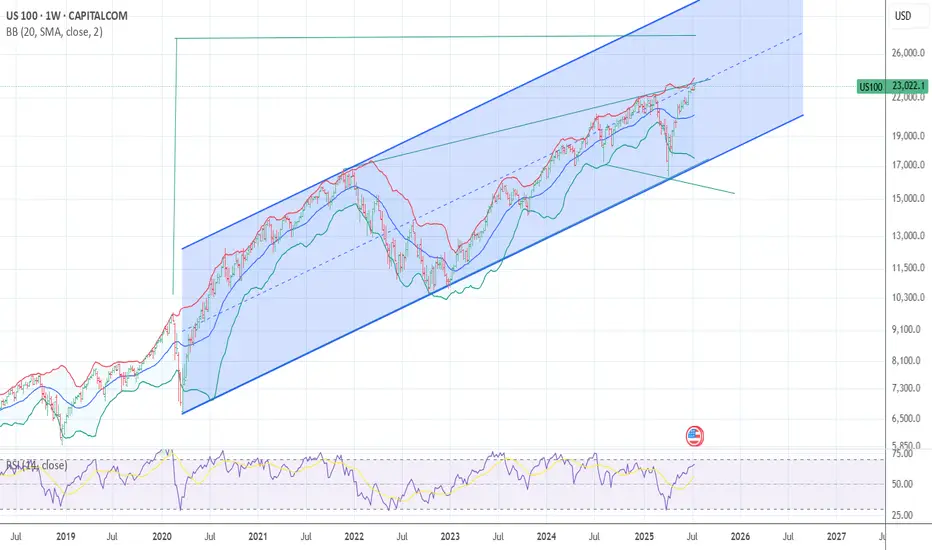
Dow Jones -> A breakout rally of +40%!🐂Dow Jones ( TVC:DJI ) will create new highs:
🔎Analysis summary:
Since the April lows, the Dow Jones already rallied about +25%. This was simply the expected rejection away from a strong confluence of support. Now, the Dow Jones is sitting at the previous all time highs and about to break out, leading to a massive rally.
📝Levels to watch:
$45.000, $60.000
🙏🏻#LONGTERMVISION
Philip - Swing Trader

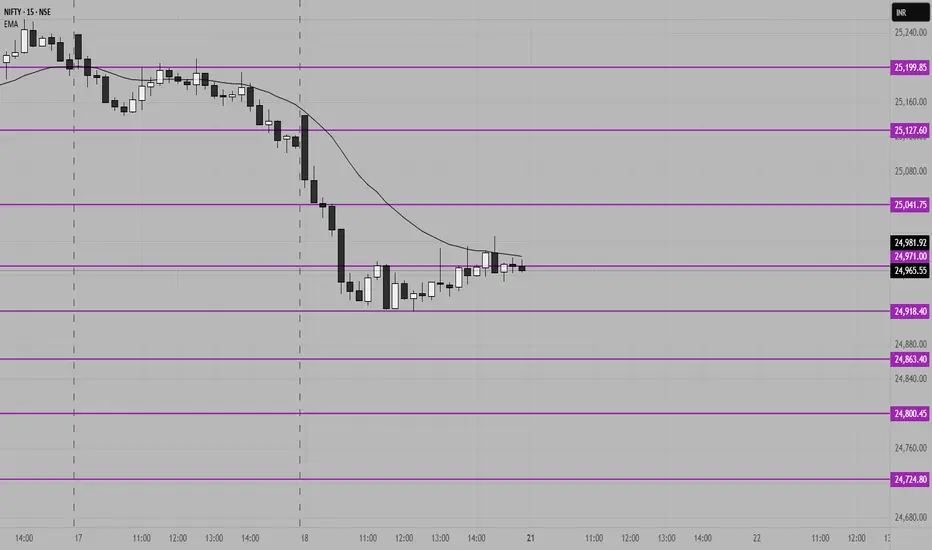
Nifty key Support and resistance levels for 21st July 2025NIFTY Key Support & Resistance for July 21st
Chart Overview:
NIFTY might consolidate after a sharp fall, currently trading around the 24,918–24,965 zone on the 15-minute chart. The price is hovering below the EMA, indicating weak momentum and hesitation in recovery.
Key Levels:
Major Resistance:
25,200 – Strong resistance zone; multiple rejections expected if tested. Watch for possible reversals or fake breakouts near this level.
Other Resistances:
* 25,127
* 25,041
Immediate Supports:
* 24,918
* 24,863
* 24,724
Outlook for July 21st:
* Failure to sustain above 24,970 could invite fresh selling toward 24,724.
* Range-bound action likely between 25,041 and 24,863 unless a strong breakout occurs.
---
Risk off The cycle low is due 10/10 -20th The Bullish wave count is that we are ending wave 1 of 5 in super cycle blowoff wave 2 would drop in a ABC decline and drop back to .382 alt 50% of the whole rally from 4835 low . This is the bull wave count ! The bearish wave count is that we are ending the final 5th wave up from 2020 low march 23th see my work calling for a panic into 3/18/3/20 2020 the low was 3/23 20 into perfect math at 2191 as was the call for 3510 to 3490 low and the 4835 low all are in near perfect math . My worry for this oct 10 to the 20th Is I see a 1987 like decline taking out the 4835 in a wave E CRASH . Under all three counts I moved to a 110 % short. best of trades WAVETIMER
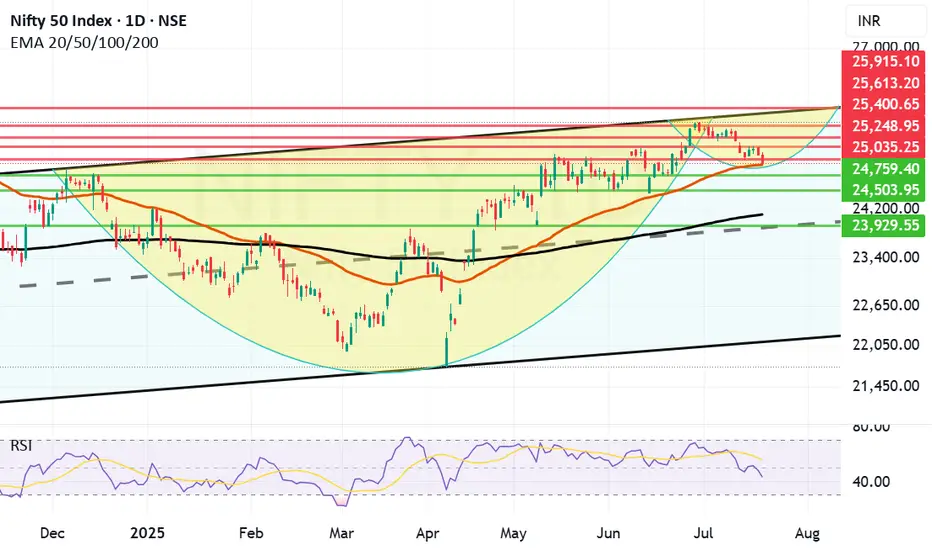
Can Reliance and Banks turn Nifty around? do or die Monday. Nifty as of now has taken support at Mother line in daily chart. As expected in my Yesterday's message. So Hopefully if Big Banks Results are in line tomorrow we might see Nifty going upwards from Monday.
Mota Bhai just announced the results. EBITDA is slightly less than expected but Net Profit and Revenue is much better than Market expectation. In my view market should react positively to this result.
Supports For Nifty remain at 24932 (Mother line), 24759, 24503. As indicated earlier if we get a closing below 24503 we may see a Fall towards 24106 or 23929 (In unlikely circumstances).
Nifty Resistances remain at: 25035, 25248, 25400 and 25613 (Channel top Resistance).
Results for tomorrow
HDFC BANK
ICICIBANK
AUSMALL BANK
RBL BANK
UNION BANK
YES BANK
CENTR BANK
PUNJA BANK
CENTR BANK
So it seems like a Do or Die Monday on cards. Shadow of the candle looks neutral as of now.
Disclaimer: The above information is provided for educational purpose, analysis and paper trading only. Please don't treat this as a buy or sell recommendation for the stock or index. The Techno-Funda analysis is based on data that is more than 3 months old. Supports and Resistances are determined by historic past peaks and Valley in the chart. Many other indicators and patterns like EMA, RSI, MACD, Volumes, Fibonacci, parallel channel etc. use historic data which is 3 months or older cyclical points. There is no guarantee they will work in future as markets are highly volatile and swings in prices are also due to macro and micro factors based on actions taken by the company as well as region and global events. Equity investment is subject to risks. I or my clients or family members might have positions in the stocks that we mention in our educational posts. We will not be responsible for any Profit or loss that may occur due to any financial decision taken based on any data provided in this message. Do consult your investment advisor before taking any financial decisions. Stop losses should be an important part of any investment in equity.
DXY BEARISH PROBABILITYThe DXY has shown a strong bearish probability after attaining the weekly premium as guided by the ICT model and BTMM.I suppose the move will be sustained as indicated else we stop at the determined level
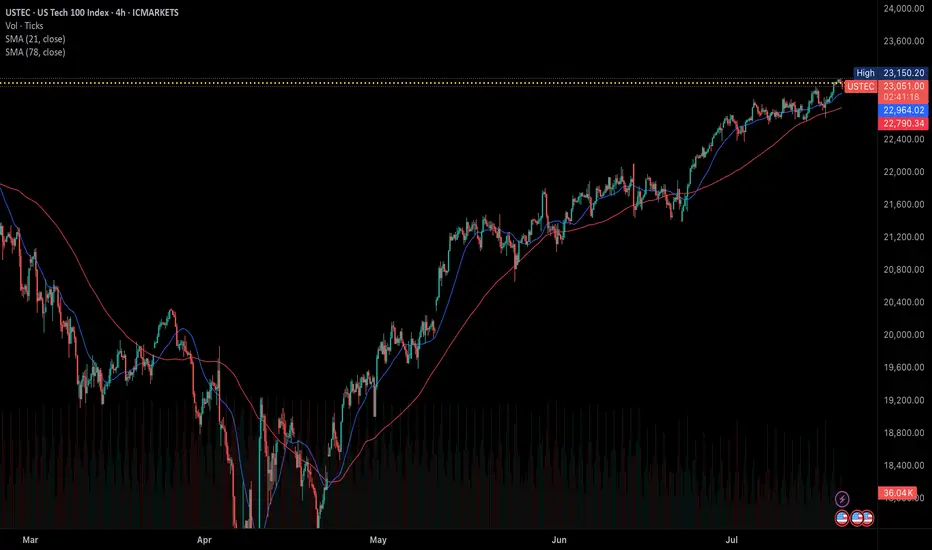
US consumer sentiment improved in Jun could boost US indices The US July Michigan Consumer Sentiment Index increased to 61.8 from 60.7, while the 12-month inflation expectation decreased to 3.6% from 4% in the previous month. This suggests an easing of inflation concerns and improved consumption optimism.
This data, coupled with recent stronger Retail Sales figures, continues to support expectations for robust US economic growth amidst trade tariff uncertainties. Inflation is anticipated to have a limited short-term impact. Concurrently, the approval for AMD and Nvidia (NVDA) to export AI chips to China further bolsters the US tech sector.
The USTEC is currently in an upward trend, having reached a new high before a slight retreat. It is trading above both the EMA21 and EMA78, indicating higher highs and higher lows, suggesting the rally could persist.
Should the USTEC continue its surge, the index may test the resistance level at 23,200. Conversely, a failure to maintain above the trendline could trigger a decline towards the next support at 22,600.
By Van Ha Trinh - Financial Market Strategist from Exness
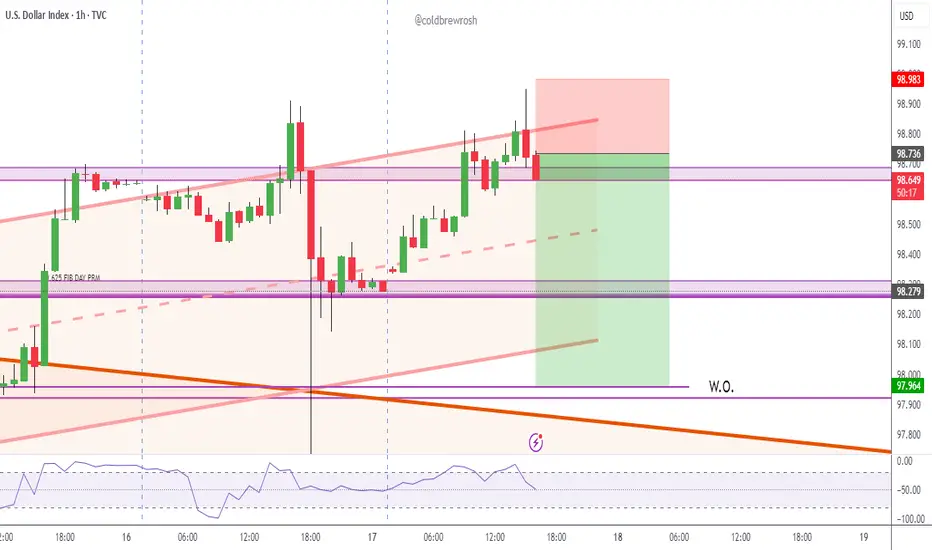
DXY LONG SETUP | Skyrocketinggggg
This is a bullish setup on the U.S. Dollar Index (DXY), taken from the 1H timeframe using Smart Money Concepts.
Price retraced into a clearly defined 1H demand zone where it also tapped a trendline support, creating a strong confluence +an LQC. The zone had internal liquidity swept and price mitigated a bullish order block, indicating potential institutional re-accumulation.
Entry was taken after bullish confirmation within the zone (engulfing candle), aligned with my SMC strategy which targets liquidity grabs and mitigation zones.
🔹 Entry: 98.06
🔹 SL: 97.83 (below the zone and structure)
🔹 TP: 99.11 (previous H1 high & clean supply zone)
🔹 RR: Approx. 4.5R
🔍 Technical Confluences:
Demand zone + OB mitigation + LQC
Trendline reaction (support respected)
Liquidity sweep + BOS (Break of Structure)
Clean imbalance above = fuel for price
Bullish engulfing as confirmation
📰 Fundamental Bias:
Today’s U.S. Jobless Claims came in better than expected, signaling labor market strength. Additionally, Retail Sales data was positive, reinforcing USD strength. These support a hawkish Fed narrative, aligning with our bullish technical setup.
Bias remains bullish unless price closes below 97.83 (invalidation level).

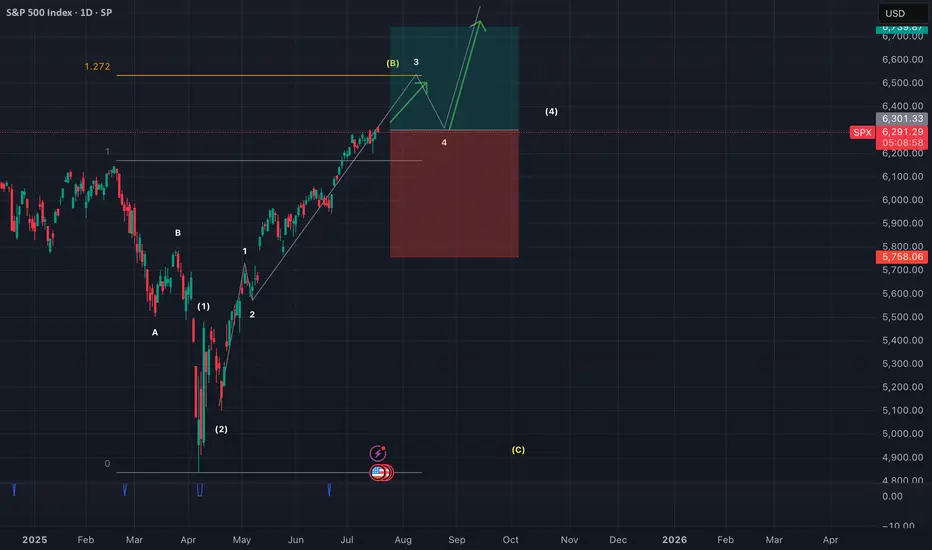
SPX500 in bullish impulseSPX500 currently at 3rd wave of wave (3) (both 2.618% extended). Expecting a retrace at 6517 region for wave 4.
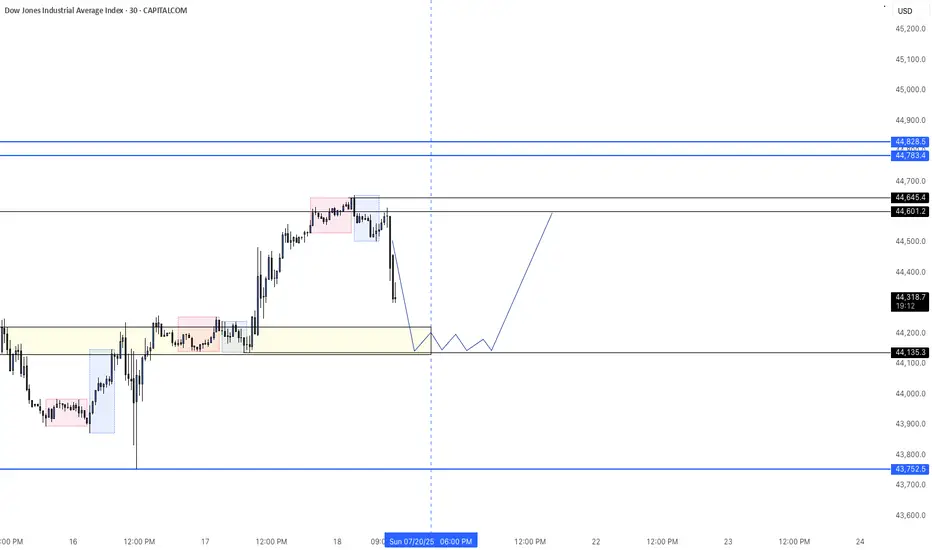
US30 - LONGBearish Friday after price hit a key level high. Price will continue to the downside the remainder of today. Expecting a jump back to today's highs come Monday morning.
China50 Target Locked | Long Setup via Thief Strategy🏴☠️ CHINA50 Market Robbery Blueprint 🔥 | Thief Trading Style (Swing/Day Plan)
🌍 Hey Money Makers, Chart Hackers, and Global Robbers! 💰🤑💸
Welcome to the new Heist Plan by your favorite thief in the game — this time targeting the CHINA50 Index CFD like a smooth criminal on the charts. 🎯📊
This is not your average technical analysis — it's a strategic robbery based on Thief Trading Style™, blending deep technical + fundamental analysis, market psychology, and raw trader instincts.
💼 THE SETUP — PREPARE FOR THE ROBBERY 🎯
We're looking at a bullish operation, setting up to break into the high-value vaults near a high-risk, high-reward resistance zone — beware, it's a high-voltage trap area where pro sellers and bearish robbers set their ambush. ⚡🔌
This plan includes a layered DCA-style entry, aiming for max profit with controlled risk. Chart alarms on, mindset ready. 🧠📈🔔
🟢 ENTRY: "The Robbery Begins"
📍 Zone-1 Buy: Near 0.63700 after MA pullback
📍 Zone-2 Buy: Near 0.62800 deeper pullback
🛠️ Entry Style: Limit Orders + DCA Layering
🎯 Wait for MA crossover confirmations and price reaction zones — don’t chase, trap the market.
🔻 STOP LOSS: "Plan the Escape Route"
⛔ SL for Pullback-1: 13540 (4H swing low)
⛔ SL for Pullback-2: 13350
📌 SL placement depends on your position sizing & risk management. Control the loss; live to rob another day. 🎭💼
🎯 TARGET ZONE: “Cash Out Point”
💸 First TP: 14100
🏁 Let the profit ride if momentum allows. Use a trailing SL once it moves in your favor to lock in gains.
👀 Scalpers Note:
Only play the long side. If your capital is heavy, take early moves. If you’re light, swing it with the gang. Stay on the bullish train and avoid shorting traps. Use tight trailing SL.
🔎 THE STORY BEHIND THE HEIST – WHY BULLISH?
CHINA50 shows bullish momentum driven by:
💹 Technical bounce off major support
🌏 Macroeconomic & geopolitical sentiment
📰 Volume + sentiment shift (risk-on)
📈 Cross-market index confirmation
🧠 Smart traders are preparing, not reacting. Stay ahead of the herd.
👉 For deeper insight, refer to:
✅ Macro Reports
✅ COT Data
✅ Intermarket Correlations
✅ CHINA-specific index outlooks
⚠️ RISK WARNING – TRADING EVENTS & VOLATILITY
🗓️ News releases can flip sentiment fast — we advise:
❌ Avoid new positions during high-impact events
🔁 Use trailing SLs to protect profit
🔔 Always manage position sizing and alerts wisely
❤️ SUPPORT THE CREW | BOOST THE PLAN
Love this analysis? Smash that Boost Button to power the team.
Join the Thief Squad and trade like legends — Steal Smart, Trade Sharp. 💥💪💰
Every day in the market is a new heist opportunity — if you have a plan. Stay tuned for more wild robbery blueprints.
📌 This is not financial advice. Trade at your own risk. Adjust based on your personal strategy and capital. Market conditions evolve fast — stay updated, stay alert.
