Market indices

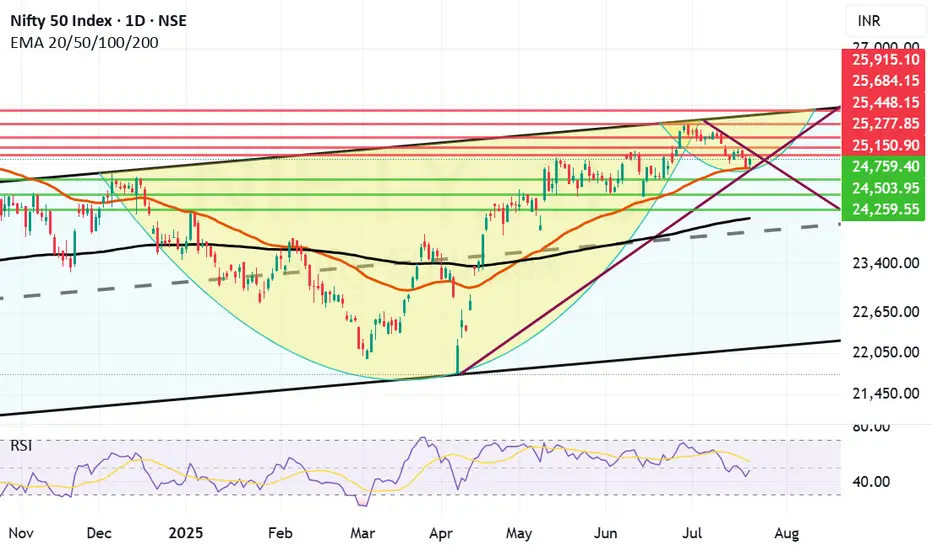
Nifty has taken support at Mother line as expected.Despite poor showing by Reliance post result and TCS continuing to fall Nifty staged a remarkable comeback on the back of Pvt Sector banking which did well. Bank Nifty came back strongly posting 1.19% gains today which enabled Nifty to rise 122 points or 0.49%. Capital Goods, Finance and Metals indices also gained more than 1% each.
Resistances for Nifty now remain at: 25150, 25277 (Trend line resistance), 25448, 25684 and finally channel top resistance at 25915.
Supports for Nifty remain at: 24938 (Mother Line Support of Daily Chart), 24759, 24503, 24259 and finally 24116 (Father Line support of Daily chart).
Shadow of the candle right now is neutral to positive and RSI is 47.63 with median RSI resistance at 54.09.
Disclaimer: The above information is provided for educational purpose, analysis and paper trading only. Please don't treat this as a buy or sell recommendation for the stock or index. The Techno-Funda analysis is based on data that is more than 3 months old. Supports and Resistances are determined by historic past peaks and Valley in the chart. Many other indicators and patterns like EMA, RSI, MACD, Volumes, Fibonacci, parallel channel etc. use historic data which is 3 months or older cyclical points. There is no guarantee they will work in future as markets are highly volatile and swings in prices are also due to macro and micro factors based on actions taken by the company as well as region and global events. Equity investment is subject to risks. I or my clients or family members might have positions in the stocks that we mention in our educational posts. We will not be responsible for any Profit or loss that may occur due to any financial decision taken based on any data provided in this message. Do consult your investment advisor before taking any financial decisions. Stop losses should be an important part of any investment in equity.
NAS100 | FLUSHPOINTNas1oo is pulling back into HTF keyzones, down below looking to catch sellers to the upside so trade is a bit riskier but we are looking for upside moves overally

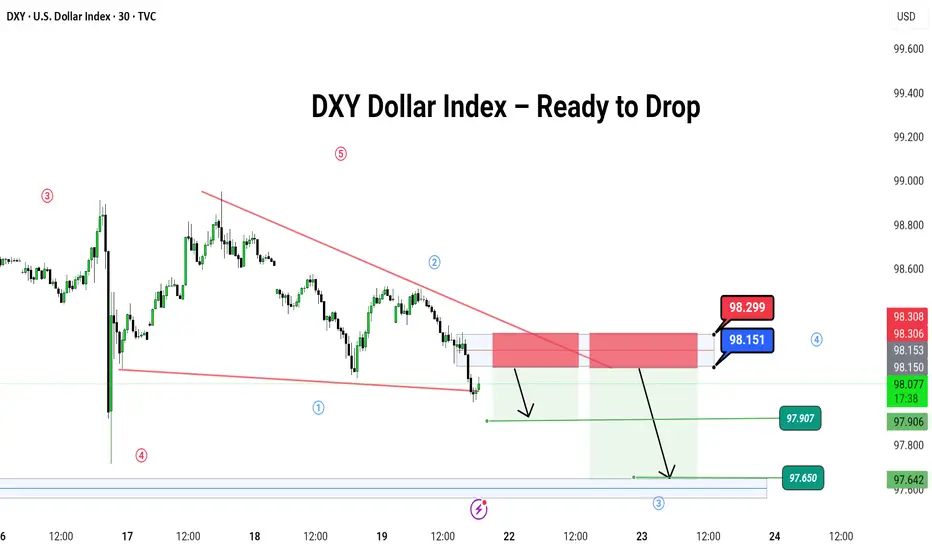
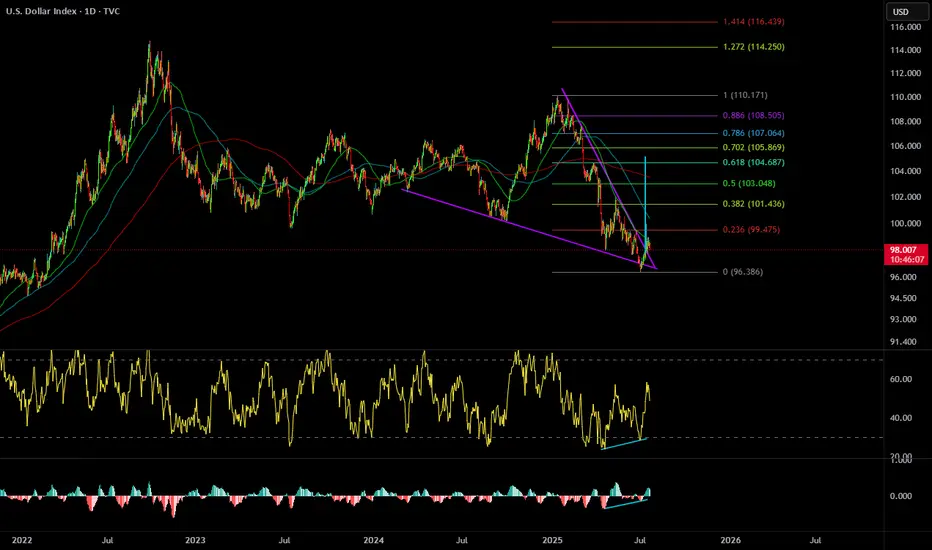
DXY Dollar Index – Ready to Drop
🌪️ DXY Dollar Index – Ready to Drop Like a Hot Potato? 💸
Hey traders! 🎯
The DXY (U.S. Dollar Index) is dancing inside a falling wedge 🔻, and it just hit the top of the party zone (red box 🎁).
📍 We're watching for a bounce up to this red zone near 98.151–98.299, then expecting a big slide down like a rollercoaster 🎢 toward:
🎯 Target 1: 97.907
🎯 Target 2: 97.650
🛑 Stop if it jumps over: 98.299
🌀 Pattern: Ending Diagonal / Wave 5 Setup
🧠 Logic: Smart money might be setting up the final wave before a major fall. Let it pop, then drop!
💡 It’s like the last spark before the fireworks go out 🎆
---
#DXY #USDIndex #ForexTrading #Wave5 #PriceAction #ChartPattern #SimpleTrading #DollarDrop
---
Let me know if you have ant suggestion ,
DXYThe current COT data shows a bullish bias for the U.S. Dollar, with institutional traders positioning net long. Although DXY is moving sideways, this positioning suggests a likely continuation of USD strength. If price breaks above key resistance levels, it would confirm the bullish sentiment reflected in the COT report.

US500 Swing short tradeUS500 index is on the verge of major drop. I expect the price to sink in the coming weeks, that's why this will be a swing trade. I expect to reach my main target of $6000 around mid/end of August, with a second short entry once we will start to drop and retrace till my key level.

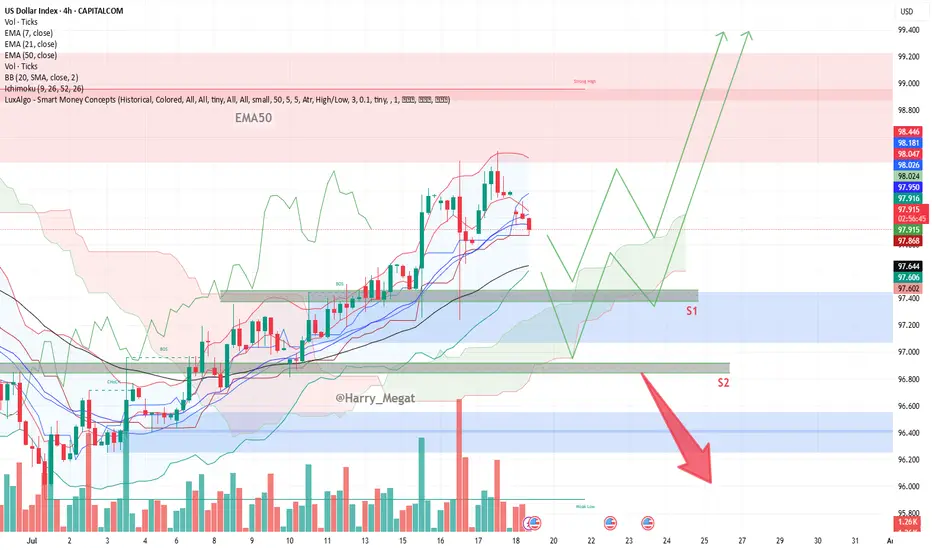
DXY Chart Outlook: Trend, Support, and Price Objectives**DXY Chart Outlook: Trend, Support, and Price Objectives (Reworded Analysis)**
**Trend Overview**
* The DXY chart reflects a **clear upward trajectory**, characterized by a sequence of **ascending highs and higher lows** — a classic sign of bullish momentum.
* Currently, the price is **retracing toward the 50-day EMA**, which appears to be holding as **dynamic support**.
* Two important **horizontal support zones** are marked:
* **Support 1 (S1):** \~97.400 (aligned with EMA-50)
* **Support 2 (S2):** \~96.800 (a deeper correction level)
**Projected Price Zones**
* **Near-Term Objective:** **98.800 to 99.000**
* A rebound from the EMA or S1 could send price higher toward this zone, continuing the current bullish structure.
* **Mid-Term Target:** **99.200 to 99.400**
* If the price successfully clears the 99.000 resistance, further bullish continuation could aim for this intermediate target range.
* **Extended Target:** **100.000+**
* A sustained breakout beyond 99.400 could open the path toward **psychological resistance at 100.000**, possibly higher on strong momentum.
**Support Zones to Watch**
* **S1 (97.400):** This level coincides with the 50-day EMA and represents a **first line of defense**.
* **S2 (96.800):** Should the price fall below S1, this secondary level could provide **stronger support** and potential bounce opportunity.
**Risk Management**
* Consider placing a **protective stop** just below S2 — around **96.500** — to safeguard against a potential trend reversal or deeper correction.
**Summary**
* The DXY remains **technically bullish**, with potential upside targets at **98.800**, **99.400**, and eventually **100.000+**.
* Traders can monitor **S1 and S2** for potential entries or trend confirmation.
* A **breakdown below 96.500** would invalidate the bullish setup and warrant caution.
The Nasdaq Composite Is at a Record. What Does Its Chart Say?The Nasdaq Composite NASDAQ:IXIC has set multiple new all-time highs in recent weeks, but what does its chart say might happen next?
Let's check it out, starting with the IXIC's year-to-date chart as of Thursday afternoon:
Readers will note that the Nasdaq Composite bottomed out on April 7, shortly after President Donald Trump's "Liberation Day" tariff announcement.
However, the index, which consists of more than 2,500 companies listed on the Nasdaq Stock Market, has pretty much been in rally mode ever since. Can that continue?
Well, the chart above shows what's known as an "inverted head-and-shoulders" pattern of bullish reversal, marked with purple curving lines.
This pattern's "neckline" (denoted by the dotted purple line above) illustrates a pivot at just about 18,029 vs. the record 20,895.66 that the Nasdaq Composite closed at on Friday.
Readers will see that this neckline acted sort of like a springboard when it was triggered back on May 12.
The Nasdaq Comp also took back its 21-day Exponential Moving Average (or "EMA, marked with a green line) in late-ish April, then its 50-day Simple Moving Average (or "SMA," marked with a blue line) on April 30. This presumably forced portfolio managers to increase their long-side exposure.
Next, the Nasdaq Comp retook the even-more-important 200-day SMA (the red line above) during the index's May 12 breakout.
Readers will also see that the index benefited algorithmically in late June what's called a "golden cross." That occurs when a stock's 50-day SMA crosses above its rising 200-day SMA.
Meanwhile, a Raff Regression model (shaded in orange and tan at the chart's right) shows that Nasdaq Composite has stayed with the uptrend in place since its April bottom. And as an old Wall Street saying goes: "The trend is your friend."
Net result: Here we are in mid-to-late July and the index is still trading at or near all-time record highs.
Will it be smooth sailing from here?
Well, there's a lot to consider before saying that. First, second-quarter earnings season has just started, and how it plays out could heavily impact the Nasdaq Composite.
Second, the war of wills between Trump and Federal Reserve Chairman Jerome Powell seems to be a growing issue. And while tariffs have yet to noticeably slow down corporate margins, impact inflation or damage labor markets, there's no way to know if we're out of the woods there.
Meanwhile, the Nasdaq Composite is also facing some less-rosy technical indicators.
For example, the index's Relative Strength Index (the gray line at the chart's top) is now in technically overbought territory. That doesn't necessarily mean the index will sell off from here, but it does mean that investors should be more alert to that possibility.
Also note that the Nasdaq Composite's Moving Average Convergence Divergence indicator (or "MACD," marked with blue bars and gold and black lines at the chart's bottom) is flashing some mixed signals.
The histogram of the 9-day EMA (the blue bars) is running below the zero-bound, which is typically a short-term bearish sign.
That said, the 12-day EMA (the black line) and 26-day EMA (the gold line) are both running well above zero, which is technically positive.
However, while the two lines have been running together for about six weeks now, should the 26-day line cross above the 12-day one, that would historically represent another bearish signal for the Nasdaq Composite.
Add it all up and the Nasdaq Comp's technical picture looks bullish in historical terms.
The above chart appears to signal not long-term weakness, but potential opportunities in both the short- and medium-term future.
That's probably going to remain true until it isn't, right?
(Moomoo Technologies Inc. Markets Commentator Stephen “Sarge” Guilfoyle had no position in Nasdaq Composite-related ETFs or mutual funds at the time of writing this column.)
This article discusses technical analysis, other approaches, including fundamental analysis, may offer very different views. The examples provided are for illustrative purposes only and are not intended to be reflective of the results you can expect to achieve. Specific security charts used are for illustrative purposes only and are not a recommendation, offer to sell, or a solicitation of an offer to buy any security. Past investment performance does not indicate or guarantee future success. Returns will vary, and all investments carry risks, including loss of principal. This content is also not a research report and is not intended to serve as the basis for any investment decision. The information contained in this article does not purport to be a complete description of the securities, markets, or developments referred to in this material. Moomoo and its affiliates make no representation or warranty as to the article's adequacy, completeness, accuracy or timeliness for any particular purpose of the above content. Furthermore, there is no guarantee that any statements, estimates, price targets, opinions or forecasts provided herein will prove to be correct.
Moomoo is a financial information and trading app offered by Moomoo Technologies Inc. In the U.S., investment products and services on Moomoo are offered by Moomoo Financial Inc., Member FINRA/SIPC.
TradingView is an independent third party not affiliated with Moomoo Financial Inc., Moomoo Technologies Inc., or its affiliates. Moomoo Financial Inc. and its affiliates do not endorse, represent or warrant the completeness and accuracy of the data and information available on the TradingView platform and are not responsible for any services provided by the third-party platform.

LAST WEEK TO GET BIDSSo as earnings push higher, it is expected that indices will try to push as there are no major news events however as this overbought Sp500 is due for correction if it taps the 6330 threshold to get to 6400.

Correction As long as the indicator does not stabilize above the green resistance area, there is a possibility of a trend change and the start of a downtrend.

Dollar $DXY Bullish WedgePretty clean falling wedge with divergence. Aligns with a pullback to come on BTC and Stocks.
A move back to 104 area would do some damage to risk on assets.
Follow for updates.
Possibility of uptrend It is expected that the triangle pattern will form according to the specified direction and then we will see the start of the upward trend. If the index breaks through the support area and consolidates, the continuation of the downward trend is likely.

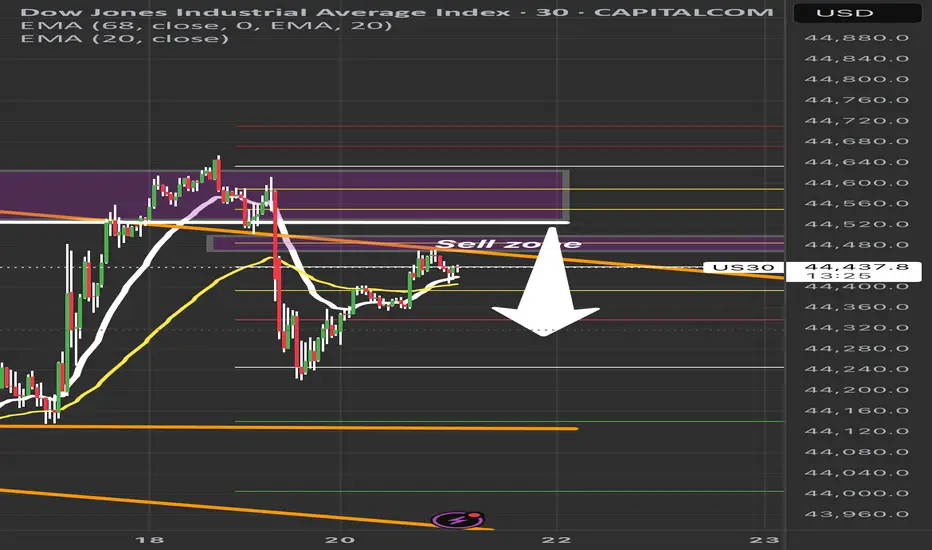
US30 Sell Setup – Watching Key Retracement ZonePrice is pulling back into a key sell zone (44,480–44,550) after a strong bearish move.
✅ Confluences:
• Previous liquidity zone
• 50–61.8% Fib retracement
• EMA rejection overhead
Plan: Waiting for bearish confirmation before short entry.
🎯 Targets:
TP1: 44,300
TP2: 44,150
TP3: 44,000
❌ Invalidation: Break above 44,600.
Patience = Precision. No confirmation, no trade.
#US30 #DowJones #TradingSetup #SmartMoneyConcepts #PriceAction #LiquidityZones #ForexTrading #DayTrading #IndicesTrading #SupplyAndDemand #TechnicalAnalysis #Fibonacci #MarketStructure #ScalpSetup #SwingTrade #RiskManagement #TradingEducation
Short NAS100Elite Discretionary Analysis
Executed trade on 30m
Price is rejecting the previous liquidity pool zone.
Targeting New York Low and CIC LP.
Go Long – Bullish Targets for Next Week- Current Price: $23065.47
- Key Insights: NASDAQ has exhibited resilience despite recent sentiment shifts,
showing signs of potential upside driven by a solid rebound in major tech
stocks. With earnings season approaching, improved performance in underlying
components reinforces long-term confidence in the index.
- Price Targets:
- T1: $23427.43
- T2: $23696.12
- S1: $22834.82
- S2: $22604.17
- Recent Performance: Over the past week, NASDAQ has consolidated near its
current levels, with intraday volatility driven by sector rotations and
macro concerns. While sentiment has weakened, the index remains supported by
key levels near the $23,000 mark.
- Expert Analysis: Analysts express optimism around key components such as
Apple, Microsoft, and Nvidia, which have recently seen improved outlooks.
Broader tech sector strength may drive NASDAQ higher. Caution is advised
given geopolitical uncertainties but upside opportunities dominate momentum.
- Sentiment Analysis:
- Current sentiment: 0
- Last week: 62.5
- Change: -62.5
- Total mentions: 386
- News Impact: Positive developments in semiconductor growth forecasts and
easing fears over rate hikes have supported bullish sentiment. However, last
week’s lower-than-expected inflation data and Federal Reserve signals for
"higher rates for longer" dampened sentiment overall.
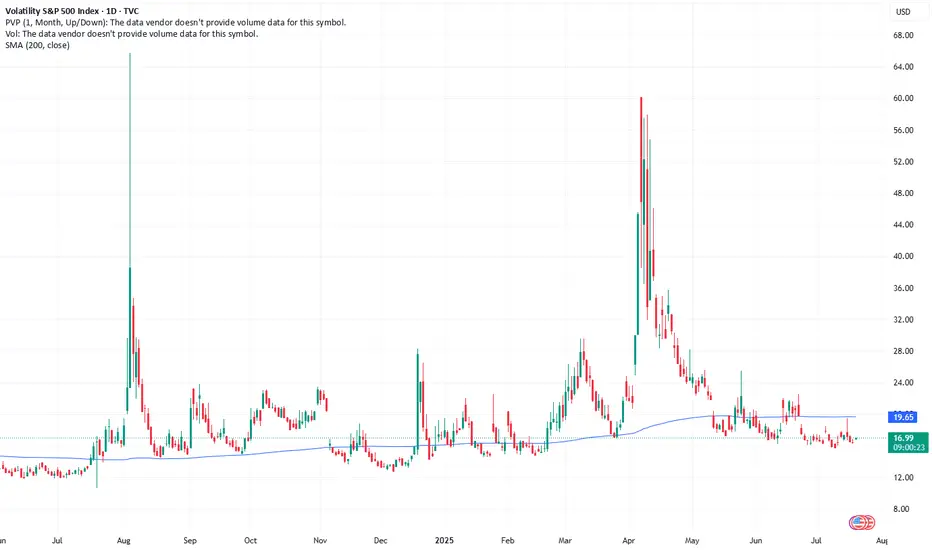
Go Long on VIX: Predictions for Increased VolatilityCurrent Price: $16.41
Direction: LONG
Targets:
- T1 = $17.50
- T2 = $18.25
Stop Levels:
- S1 = $15.90
- S2 = $15.65
**Wisdom of Professional Traders:**
This analysis synthesizes insights from thousands of professional traders and market experts, leveraging collective intelligence to identify high-probability trade setups. The wisdom of crowds principle suggests that aggregated market perspectives from experienced professionals often outperform individual forecasts, reducing cognitive biases and highlighting consensus opportunities in VIX.
**Key Insights:**
The VIX, commonly referred to as the "Fear Index," is currently hovering at historically low levels of 16.41, well below the psychologically significant threshold of 20. This indicates a relatively calm equity market, but traders know all too well that complacency often precedes sharp volatility spikes. Key breakout levels range between 18 and 19, with the potential to test mid-20 range if significant macroeconomic or geopolitical events materialize. Traders are advised to consider hedging strategies while monitoring these thresholds closely.
The current low-volatility environment reflects broad market optimism, but it also suggests the possibility of a quick reversal. Historically, prolonged periods of suppressed VIX readings can lead to sharper corrections when fear abruptly rises. For this reason, traders should stay vigilant, particularly with major economic events on the horizon.
**Recent Performance:**
Over the past few weeks, the VIX has steadily declined, breaking below 17 and reaching the current zone of 16.41. This downward momentum aligns with bullish equity markets, where major indices like the S&P 500 continue to hover near all-time highs. This subdued state demonstrates investor confidence but warns of potential complacency risks.
**Expert Analysis:**
Market analysts emphasize the importance of the 18-19 zone, which serves as a critical resistance range. A sustained breakout above these levels could lead to a move into the 20-25 range, driven by renewed market uncertainty. Technically, the VIX remains oversold, implying the probability of an upward momentum shift soon. Experts point to factors such as Federal Reserve policy statements, inflation data, and geopolitical surprises as potential catalysts. Overall, professional sentiment skews towards a medium-term bullish stance on VIX.
**News Impact:**
Recent market headlines indicate hedging activities through August and September VIX futures, preparing for a potential volatility spike tied to macroeconomic concerns or policy announcements. Additionally, the simultaneous drop in the MOVE index—a measure of bond market volatility—further signals market complacency, raising questions about whether markets are adequately pricing in risks. These factors, combined with historically low VIX levels, suggest that a volatility breakout is on the table in the coming weeks.
**Trading Recommendation:**
With the VIX at suppressed levels, traders have an opportunity to position themselves for a potential upside. Going long on VIX with an initial target of $17.50 and a secondary target of $18.25 provides a favorable risk-to-reward setup. Stop-losses at $15.90 and $15.65 help manage downside risks effectively. This strategy aligns with historical patterns where low VIX levels are followed by periods of heightened volatility, especially during critical market junctures.
Litty Like US30!!I'm purely going off the Week chart. 4hr MSS+ 4hr BPR gives me reasons to buy price. I'm targeting the Equal Highs on the Weekly chart.

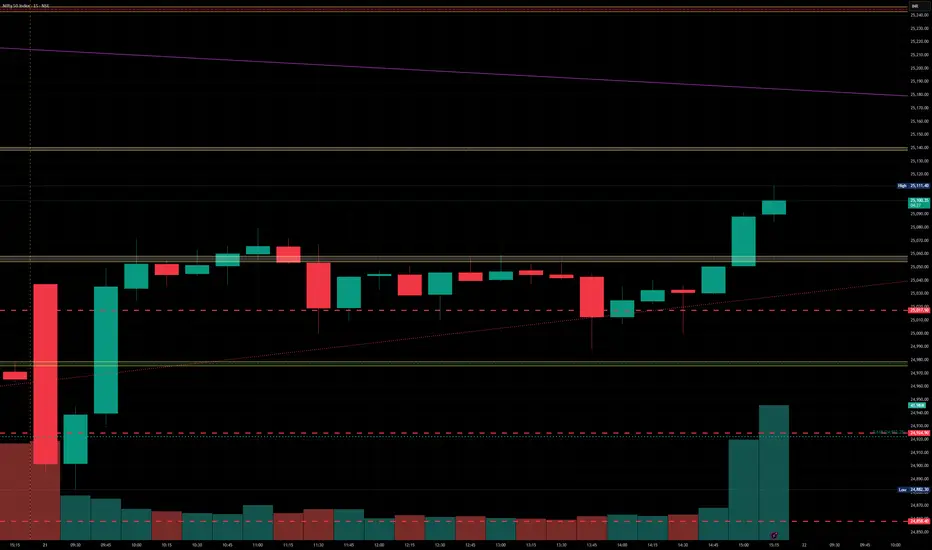
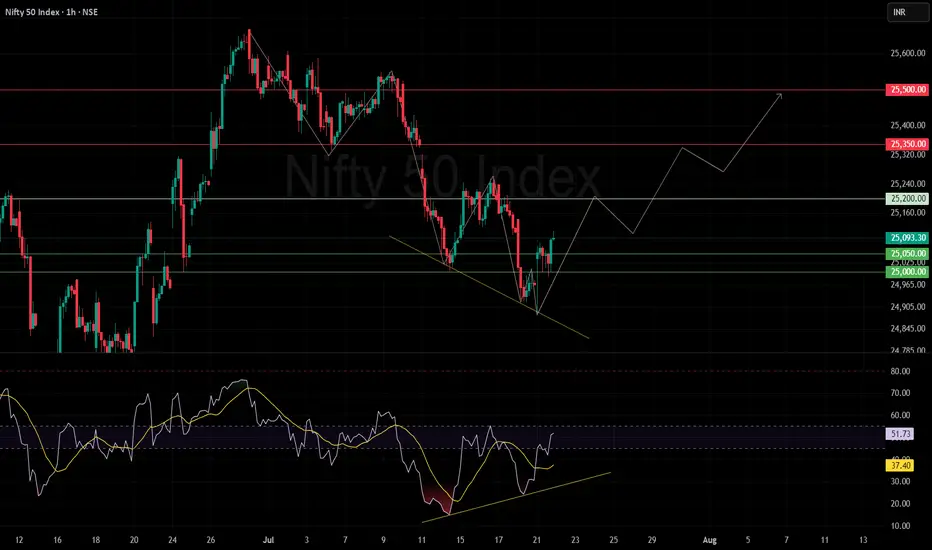
Nifty bounced with a liquidity grab.Market Action Overview
Breakdown Below 25,000: The Nifty 50 index recently dipped below the psychologically significant level of 25,000, a move that likely triggered stop-loss orders and drew out short-sellers.
Liquidity Grab: This action can be interpreted as a classic "liquidity grab," where the market briefly breaks a key support, absorbs sell-side liquidity, and shakes out weak hands before reversing direction.
Quick Rebound: Following the breakdown, the index swiftly reclaimed the 25,000 mark, signaling a strong buy-side response and potential exhaustion of selling pressure.
Recent Trend: The index recently rebounded from a downward phase, forming a lower low before bouncing from a support zone.
Support Levels: Key supports are visible at 25,000 and 25,050.
Resistance Levels: Notable overhead resistances are at 25,200, 25,350, and 25,500.
Potential Path & Projections
The indicated projection outlines a potential upward journey:
A base formation near current levels.
Possible upward move toward 25,200.
If sustained, a further rally toward the resistance levels of 25,350 and then 25,500.
The chart suggests a zig-zag correction/consolidation before each resistance break, implying healthy pullbacks amid the upward path.
Trendlines & Patterns
Falling Wedge Breakout: The downtrend appears to be capped by a descending trendline which has just been breached to the upside—a potentially bullish signal.
Short-Term Recovery: An optimistic bias is presented by the "inverted V" or "W-shaped" price action, hinting at accumulating strength.
RSI Pattern: The RSI is climbing from its recent lows and maintains an upward trendline also showing positive divergence with price, supporting a bullish outlook.
Momentum: If the RSI sustains above 50, momentum could stay positive; a move above 60 might trigger increased buying.
Key Takeaways
Short-Term Bias: Bullish, given breakout patterns and the upward RSI momentum.
Critical Levels to Watch:
Support: 25,000
Resistance: 25,200, 25,350, 25,500
Confirmation Needed: Watch for price acceptance above 25,200 for further bullish momentum. Failure to hold above 25,000 may invalidate the positive setup.
Conclusion
Indicators point to a potential short-term recovery for the Nifty 50, provided support holds and RSI maintains or extends its upward trajectory. Resistance breakouts above 25,200 could open the door to higher targets, but as always, traders should monitor for reversals near mapped resistance zones.
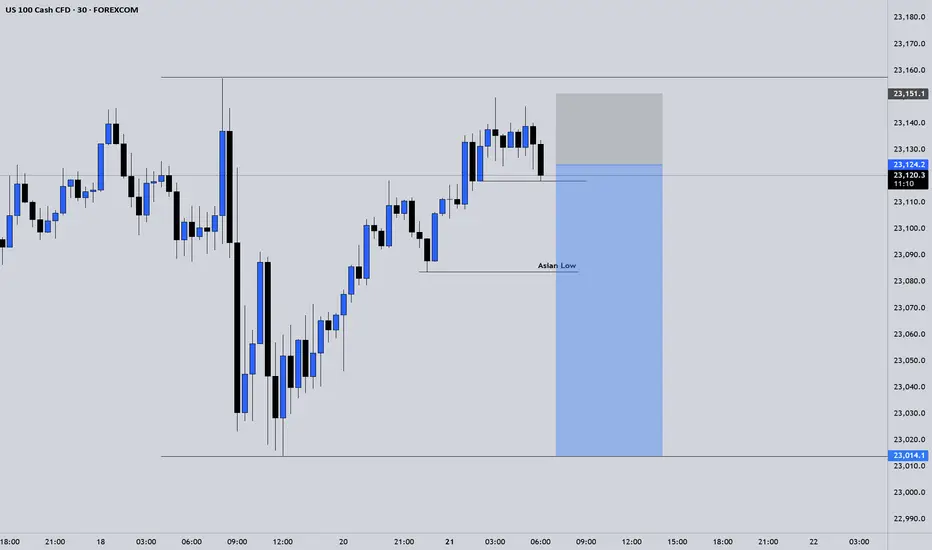
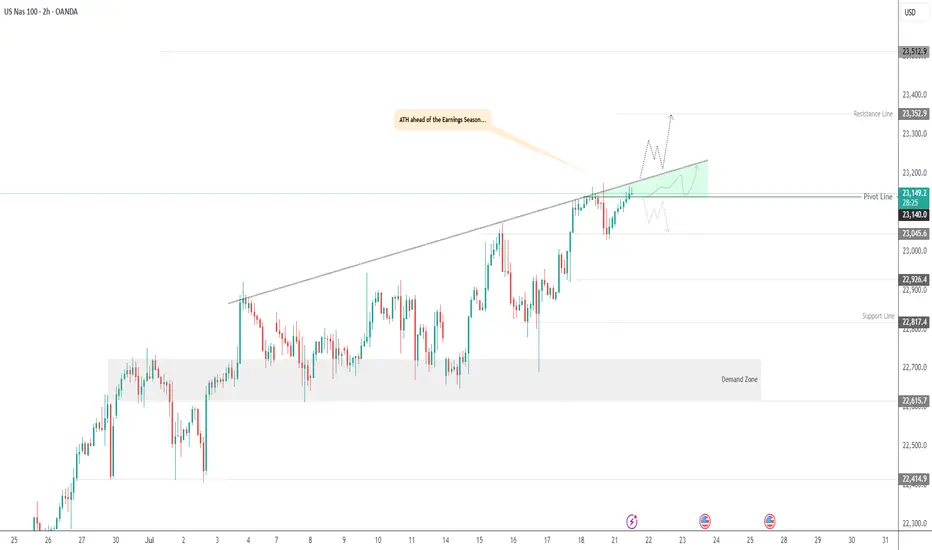
USNAS100 | Bullish Setup Ahead of Tech Earnings & Trade RiskUSNAS100 | Bullish Setup Ahead of Tech Earnings & Trade Risk
U.S. equity markets are entering a pivotal week with big-tech earnings and renewed focus on Trump’s proposed trade tariffs. Both the S&P 500 and Nasdaq are hovering near record highs, but new catalysts are required for continuation.
Technical Outlook:
The price has stabilized above 23140, breaking the pivot and confirming bullish momentum. As long as the price holds above this level, the trend remains bullish, especially if it breaks the green triangle resistance structure.
A sustained move above 23140 opens the path toward 23250 and 23350, with further extension possible to 23510.
However, a 4H close below 23140 may activate a bearish correction toward 23045, and possibly deeper toward 22920 and 22820.
Resistance Levels: 23250 · 23350 · 23510
Support Levels: 23045 · 22920 · 22820
Bias: Bullish above 23140
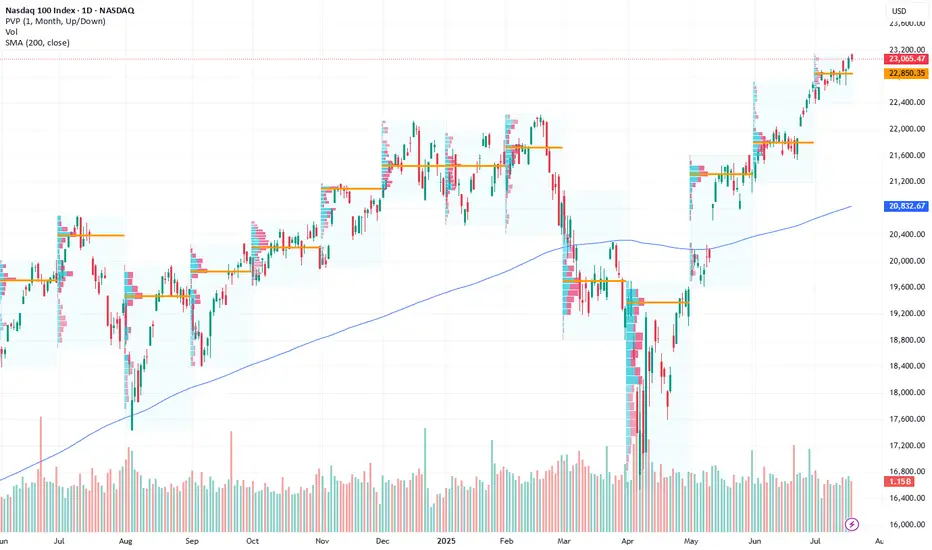
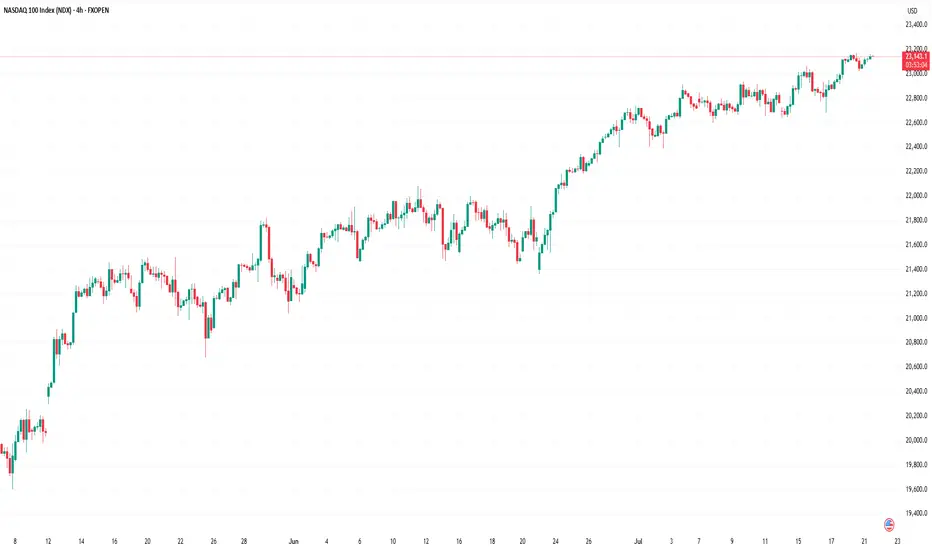
Nasdaq 100: Market Optimism Builds Ahead of Big Tech EarningsNasdaq 100: Market Optimism Builds Ahead of Big Tech Earnings
The earnings season is gaining momentum. This week, major technology companies such as Alphabet (GOOGL) and Tesla (TSLA) are scheduled to release their quarterly results.
Given that 85% of the 53 S&P 500 companies that have already reported have exceeded analysts’ expectations, it is reasonable to assume that market participants are also anticipating strong results from the big tech names. The Nasdaq 100 index (US Tech 100 mini on FXOpen) set an all-time high last week — a level that may be surpassed (potentially more than once) before the end of August.
Technical Analysis of the Nasdaq 100 Chart
Price movements have formed an upward channel (marked in blue), with the following dynamics observed:
→ The bearish signals we highlighted on 7 July did not result in any significant correction. This may be interpreted as a sign of a strong market, as bearish momentum failed to materialise despite favourable technical conditions.
→ Buyers have shown initiative by gaining control at higher price levels (as indicated by the arrows): the resistance at 22,900 has been invalidated, while the 23,050 level has flipped to become support.
→ A long lower shadow near the bottom boundary of the channel (circled on the chart) underscores aggressive buying activity.
Should the earnings and forward guidance from major tech firms also come in strong, this could further reinforce the sustainable bullish trend in the US equity market.
This article represents the opinion of the Companies operating under the FXOpen brand only. It is not to be construed as an offer, solicitation, or recommendation with respect to products and services provided by the Companies operating under the FXOpen brand, nor is it to be considered financial advice.
Dow Jones is Nearing an Important Support!!Hey Traders, in today's trading session we are monitoring US30 for a buying opportunity around 43,950 zone, Dow Jones is trading in an uptrend and currently is in a correction phase in which it is approaching the trend at 43,950 support and resistance area.
Trade safe, Joe.

BankNifty levels - Jul 22, 2025Utilizing the support and resistance levels of BankNifty, along with the 5-minute timeframe candlesticks and VWAP, can enhance the precision of trade entries and exits on or near these levels. It is crucial to recognize that these levels are not static, and they undergo alterations as market dynamics evolve.
The dashed lines on the chart indicate the reaction levels, serving as additional points of significance. Furthermore, take note of the response at the levels of the High, Low, and Close values from the day prior.
We trust that this information proves valuable to you.
* If you found the idea appealing, kindly tap the Boost icon located below the chart. We encourage you to share your thoughts and comments regarding it.
Wishing you successful trading endeavors!

Nifty levels - Jul 22, 2025Nifty support and resistance levels are valuable tools for making informed trading decisions, specifically when combined with the analysis of 5-minute timeframe candlesticks and VWAP. By closely monitoring these levels and observing the price movements within this timeframe, traders can enhance the accuracy of their entry and exit points. It is important to bear in mind that support and resistance levels are not fixed, and they can change over time as market conditions evolve.
The dashed lines on the chart indicate the reaction levels, serving as additional points of significance to consider. Furthermore, take note of the response at the levels of the High, Low, and Close values from the day prior.
We hope you find this information beneficial in your trading endeavors.
* If you found the idea appealing, kindly tap the Boost icon located below the chart. We encourage you to share your thoughts and comments regarding it.
Wishing you success in your trading activities!