#Nifty - Pivot Point: 25031.63Date: 18-07-2025
#Nifty Current Price: 25025
Pivot Point: 25031.63 Support: 24794.06 Resistance: 25270.32
#NiftyUpside Targets:
Target 1: 25376.92
Target 2: 25483.53
Target 3: 25652.99
Target 4: 25822.45
#NiftyDownside Targets:
Target 1: 24686.89
Target 2: 24579.73
Target 3: 24410.26
Target 4: 24240.80
#TradingView #Stocks #Equities #StockMarket #Investing #Trading #Nifty
#TechnicalAnalysis #StockCharts #Finance
Market indices

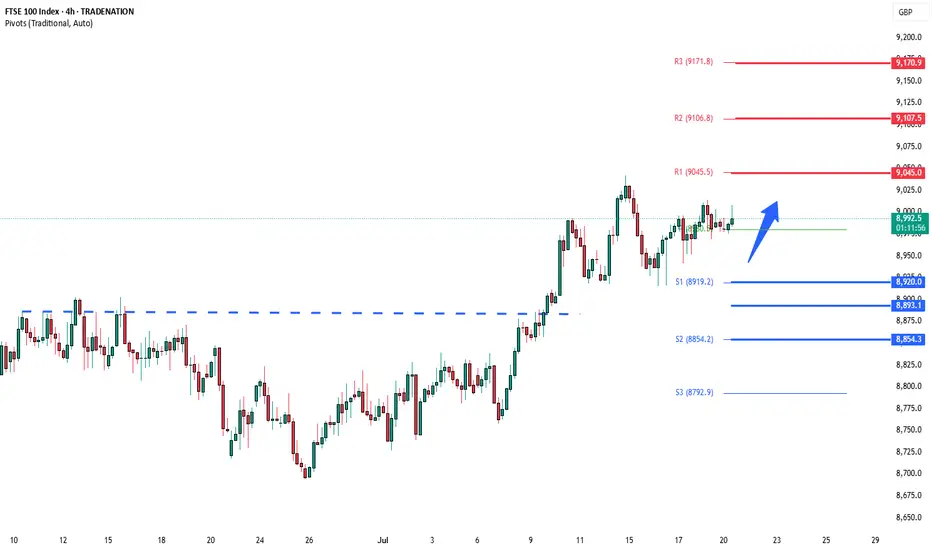
FTSE bullish consolidation resistance at 9045The FTSE remains in a bullish trend, with recent price action showing signs of a corrective pullback within the broader uptrend.
Support Zone: 8020 – a key level from previous consolidation. Price is currently testing or approaching this level.
A bullish rebound from 8920 would confirm ongoing upside momentum, with potential targets at:
9045 – initial resistance
9107 – psychological and structural level
9170 – extended resistance on the longer-term chart
Bearish Scenario:
A confirmed break and daily close below 8920 would weaken the bullish outlook and suggest deeper downside risk toward:
8893 – minor support
8854 – stronger support and potential demand zone
Outlook:
Bullish bias remains intact while the FTSE holds above 8920. A sustained break below this level could shift momentum to the downside in the short term.
This communication is for informational purposes only and should not be viewed as any form of recommendation as to a particular course of action or as investment advice. It is not intended as an offer or solicitation for the purchase or sale of any financial instrument or as an official confirmation of any transaction. Opinions, estimates and assumptions expressed herein are made as of the date of this communication and are subject to change without notice. This communication has been prepared based upon information, including market prices, data and other information, believed to be reliable; however, Trade Nation does not warrant its completeness or accuracy. All market prices and market data contained in or attached to this communication are indicative and subject to change without notice.
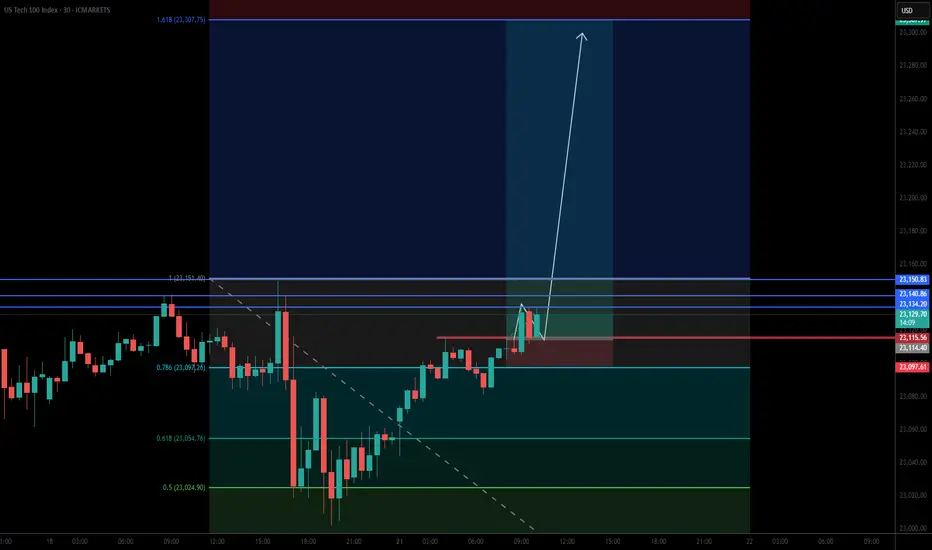
NASDAQ INDEX (US100): Bullish Continuation Confirmed
NASDAQ Index broke and closed above a resistance of a horizontal
parallel channel on a daily.
It confirms a bullish trend continuation and a highly probable growth
to the next strong resistance.
Goal - 23300
❤️Please, support my work with like, thank you!❤️

SPX: Banks beat, stocks peakThe US equity markets remained relatively resilient this week, despite ongoing concerns about trade policy developments. After last week’s slight retreat from its all-time high, the S&P 500 resumed its upward momentum early in the week, continuing to hover near record levels. The index reached a new highest level of 6,315 on Friday before pulling back slightly, closing the week at 6.296.
Bank earrings were in focus of investors during the previous week. Overall, Q2 reports from major U.S. banks showed resilience — better-than-expected earnings, strong interest income, and robust capital actions. So far, the finance sector has seen Q2 earnings rise around 13% y/y and 3,4% revenue growth. In addition, a stress test posted by Fed underpin confidence as all major banks, including JPMorgan and Citi showing resilience also under potential stress conditions. However, both bankers and investors held a cautious tone on macro/public policy risk.
Investors' confidence was additionally boosted by better than expected US macro data posted during the previous week. The inflation rate in June was 0,3% for the month and 2,7% on a yearly basis. At the same time, retail sales beat market expectations with an increase of 0,6% in June. As per analysts reports, currently 27 stocks included in the S&P 500 are trading at the all time highest levels. The ADM company, which is well known for producing Coca Cola, had a drop in the value of shares of 2% after the US President requested from the company to use real cane sugar in their popular drink.
From July 23st a composition of companies included in the S&P 500 index will be changed. A crypto company Block will be included, while the company Hess will be excluded from the index. Shares of the Blok surged by 10% on Friday, after the release of the news.

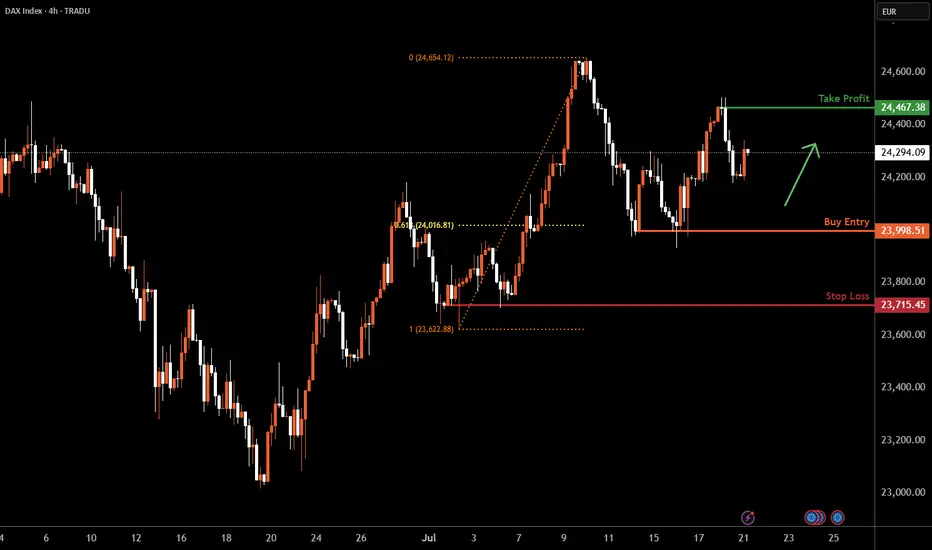
DAX H4 | Multi-swing-low support at 61.8% Fibonacci retracementThe DAX (GER30) is falling towards a multi-swing-low support and could potentially bounce off this level to climb higher.
Buy entry is at 23,998.51 which is a multi-swing-low support that aligns with the 61.8% Fibonacci retracement.
Stop loss is at 23,715.45 which is a swing-low support.
Take profit is at 24,467.38 which is a swing-high resistance.
High Risk Investment Warning
Trading Forex/CFDs on margin carries a high level of risk and may not be suitable for all investors. Leverage can work against you.
Stratos Markets Limited (tradu.com ):
CFDs are complex instruments and come with a high risk of losing money rapidly due to leverage. 66% of retail investor accounts lose money when trading CFDs with this provider. You should consider whether you understand how CFDs work and whether you can afford to take the high risk of losing your money.
Stratos Europe Ltd (tradu.com ):
CFDs are complex instruments and come with a high risk of losing money rapidly due to leverage. 66% of retail investor accounts lose money when trading CFDs with this provider. You should consider whether you understand how CFDs work and whether you can afford to take the high risk of losing your money.
Stratos Global LLC (tradu.com ):
Losses can exceed deposits.
Please be advised that the information presented on TradingView is provided to Tradu (‘Company’, ‘we’) by a third-party provider (‘TFA Global Pte Ltd’). Please be reminded that you are solely responsible for the trading decisions on your account. There is a very high degree of risk involved in trading. Any information and/or content is intended entirely for research, educational and informational purposes only and does not constitute investment or consultation advice or investment strategy. The information is not tailored to the investment needs of any specific person and therefore does not involve a consideration of any of the investment objectives, financial situation or needs of any viewer that may receive it. Kindly also note that past performance is not a reliable indicator of future results. Actual results may differ materially from those anticipated in forward-looking or past performance statements. We assume no liability as to the accuracy or completeness of any of the information and/or content provided herein and the Company cannot be held responsible for any omission, mistake nor for any loss or damage including without limitation to any loss of profit which may arise from reliance on any information supplied by TFA Global Pte Ltd.
The speaker(s) is neither an employee, agent nor representative of Tradu and is therefore acting independently. The opinions given are their own, constitute general market commentary, and do not constitute the opinion or advice of Tradu or any form of personal or investment advice. Tradu neither endorses nor guarantees offerings of third-party speakers, nor is Tradu responsible for the content, veracity or opinions of third-party speakers, presenters or participants.
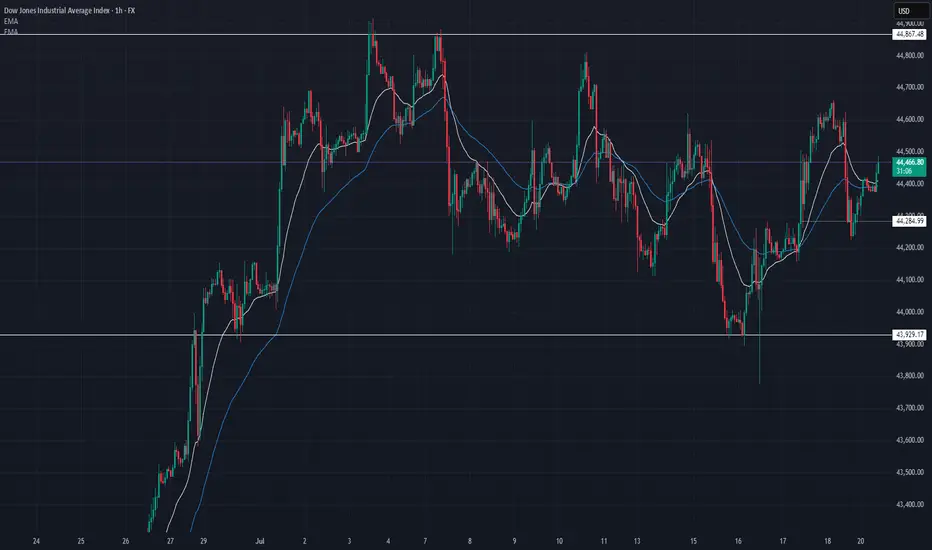
US30 Update – 07/21/2025📍 US30 Update – 07/21/2025
Sideways chop continues on US30 🌀
We’re still range-bound between 44,285 and 44,867, with price currently hovering mid-range around 44,470. Structure remains indecisive — buyers tried to push higher but got faded near the 44,600 level again.
EMA structure is flat on the 1H — confirmation that we’re consolidating.
📊 Market Structure:
🔄 Consolidation Zone: 44,285 → 44,867
📉 Failed to hold above 44,600
📈 Bulls defending 44,285 zone (demand still active)
📊 1H EMAs flat — neutral/slightly bullish
🔑 Key Levels:
🔼 Resistance: 44,600 → 44,867
🔽 Support: 44,285 → 43,929
🧠 Market Bias:
Neutral short term ⚖️
➡️ Clear breakout above 44,867 = trend continuation
⬇️ Breakdown below 44,285 = bearish structure confirmed
💡 Trade Scenarios:
📈 Range Buy (Support Play):
Entry: 44,300–44,285
TP1: 44,500
TP2: 44,700
SL: Below 44,200
📉 Range Sell (Resistance Fade):
Entry: 44,600–44,650
TP1: 44,400
TP2: 44,300
SL: Above 44,700
⚔️ Breakout Setup:
Long above 44,870 (confirmation)
Short below 44,280 with volume
📵 No trade in the middle of the range unless scalp — wait for edges to act.
A very ambitious LONG I have entered LONG on nas100 once it retested the break of the double top.
No BS, just a simple trade... no spider webs on the screen, no crazy, imaginary strategy..
Long Position on Dow Jones Industrial Average
Initiating a long position at 44,456, supported by robust economic data and stronger-than-expected corporate earnings. These indicators point to continued resilience in the U.S. economy, potentially allowing the Federal Reserve to consider rate cuts sooner than previously anticipated — a positive catalyst for equities.
📌 Entry: 44,456
🛑 Stop Loss: 44,207
🎯 Take Profit: 44,900
Monitoring price action closely as market sentiment continues to shift in response to macroeconomic developments.

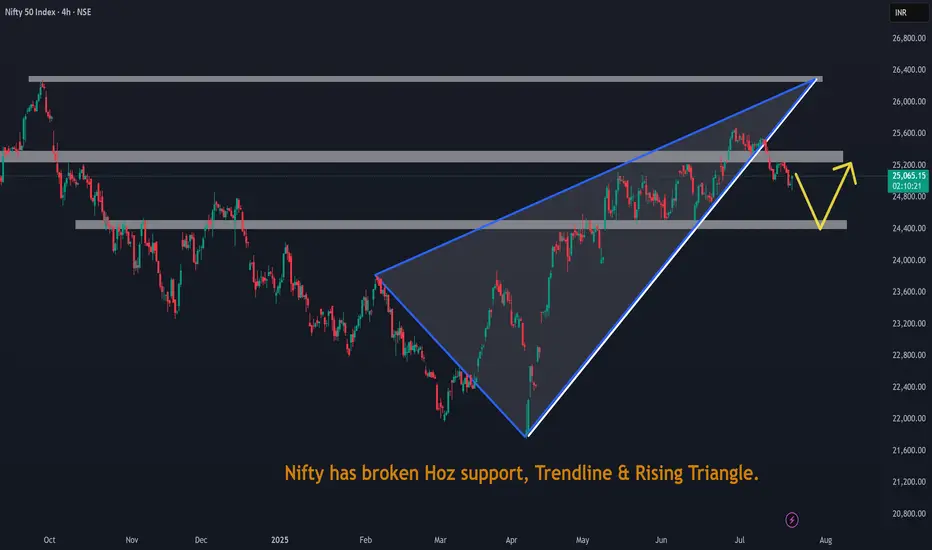
Nifty has broken Hoz support, Trendline & Rising Triangle.Nifty has broken Hoz support, Trendline & Rising Triangle.
Upward momentum of Nasdaq is weakeningUpward momentum of Nasdaq is weakening. Waiting for negative global cues to nreal trendline

Bullish momentum to extend?DAX40 (DE40) is falling towards the pivot which has been identified as a pullback support and could bounce to the pullback resistance.
Pivot: 23,059.10
1st Support: 22,177.80
1st Resistance: 24,630.42
Risk Warning:
Trading Forex and CFDs carries a high level of risk to your capital and you should only trade with money you can afford to lose. Trading Forex and CFDs may not be suitable for all investors, so please ensure that you fully understand the risks involved and seek independent advice if necessary.
Disclaimer:
The above opinions given constitute general market commentary, and do not constitute the opinion or advice of IC Markets or any form of personal or investment advice.
Any opinions, news, research, analyses, prices, other information, or links to third-party sites contained on this website are provided on an "as-is" basis, are intended only to be informative, is not an advice nor a recommendation, nor research, or a record of our trading prices, or an offer of, or solicitation for a transaction in any financial instrument and thus should not be treated as such. The information provided does not involve any specific investment objectives, financial situation and needs of any specific person who may receive it. Please be aware, that past performance is not a reliable indicator of future performance and/or results. Past Performance or Forward-looking scenarios based upon the reasonable beliefs of the third-party provider are not a guarantee of future performance. Actual results may differ materially from those anticipated in forward-looking or past performance statements. IC Markets makes no representation or warranty and assumes no liability as to the accuracy or completeness of the information provided, nor any loss arising from any investment based on a recommendation, forecast or any information supplied by any third-party.

Bearish drop off 50% Fibonacci resistance?The US Dollar Index (DXY) is rising towards the pivot which acts as a pullback resistance and could drop to the 1st support.
Pivot: 99..15
1st Support: 96.54
1st Resistance: 100.57
Risk Warning:
Trading Forex and CFDs carries a high level of risk to your capital and you should only trade with money you can afford to lose. Trading Forex and CFDs may not be suitable for all investors, so please ensure that you fully understand the risks involved and seek independent advice if necessary.
Disclaimer:
The above opinions given constitute general market commentary, and do not constitute the opinion or advice of IC Markets or any form of personal or investment advice.
Any opinions, news, research, analyses, prices, other information, or links to third-party sites contained on this website are provided on an "as-is" basis, are intended only to be informative, is not an advice nor a recommendation, nor research, or a record of our trading prices, or an offer of, or solicitation for a transaction in any financial instrument and thus should not be treated as such. The information provided does not involve any specific investment objectives, financial situation and needs of any specific person who may receive it. Please be aware, that past performance is not a reliable indicator of future performance and/or results. Past Performance or Forward-looking scenarios based upon the reasonable beliefs of the third-party provider are not a guarantee of future performance. Actual results may differ materially from those anticipated in forward-looking or past performance statements. IC Markets makes no representation or warranty and assumes no liability as to the accuracy or completeness of the information provided, nor any loss arising from any investment based on a recommendation, forecast or any information supplied by any third-party.

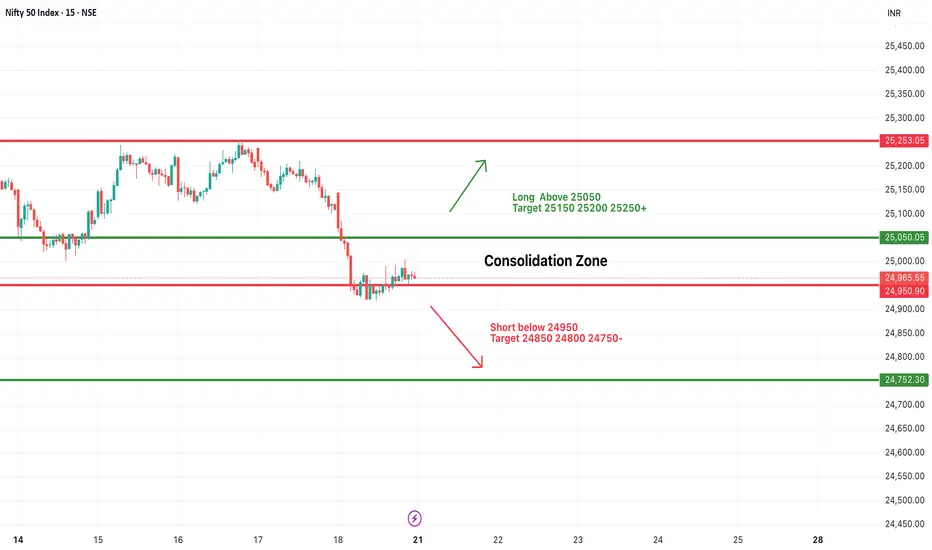
#NIFTY Intraday Support and Resistance Levels - 21/07/2025Nifty is likely to start the day with a flat opening, as current price action is indicating a consolidation phase near the lower range. The zone between 24,950–25,050 is acting as a key area of indecision, where prices are stuck in a tight range, showing a lack of clear momentum. This consolidation could lead to a breakout or breakdown depending on how the index reacts at key levels.
If Nifty sustains above 25,050, it may trigger a short-term upward move, breaking the consolidation phase. In such a scenario, an upside rally towards 25,150, 25,200, and 25,250+ levels can be expected, making it a favorable long setup for intraday traders.
On the contrary, if the index slips below 24,950, the selling pressure may increase, and downside momentum can accelerate. A breakdown here could pull the index towards support levels of 24,850, 24,800, and even 24,750-, which would confirm bearish strength.
Traders are advised to avoid aggressive positions within the consolidation zone and wait for a breakout or breakdown for directional trades. Quick entries with partial profit booking at every level and strict stop-losses are recommended to manage risk efficiently in today’s range-bound environment.
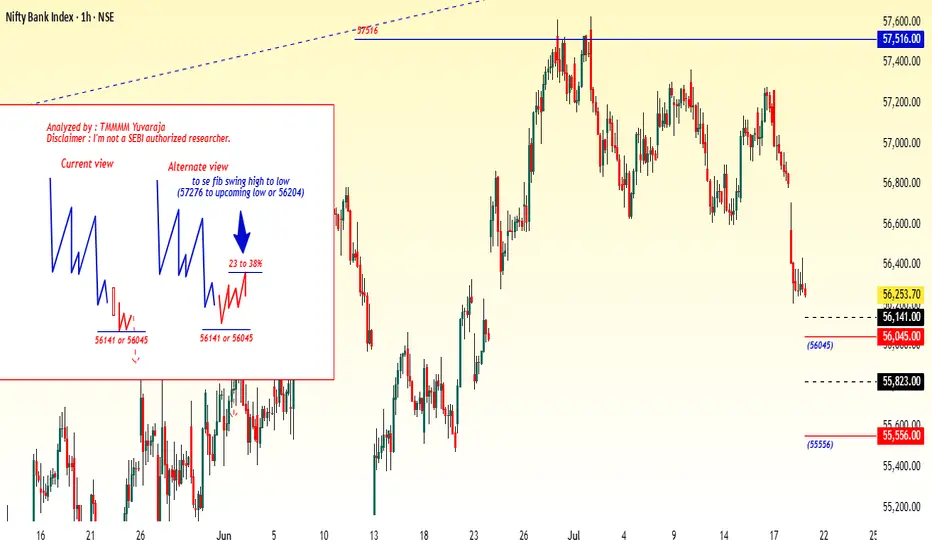
#Banknifty directions and levels for July 21st:What can we expect today?
In the previous session, both Nifty and Bank Nifty fell sharply. Structurally, the trend remains negative.
However, due to major firms' results, we might see some volatility in the first half, possibly leading to initial speculation.
That said, as per the structure my expectation is a continuation of the correction that's my current view
The alternate view is If the market takes an initial pullback, we could see a 23–38% retracement in the minor swing. Even in this scenario, the bias remains bearish unless the 38% Fibonacci level is broken.
A break above 38% could extend the pullback toward the 50–78% levels.
#Nifty directions and levels for July 21st:Good morning, friends! 🌞
Here are the market directions and levels for July 21st:
The global market shows no major changes and continues to maintain a moderately bearish sentiment.
Meanwhile, the local market is exhibiting a bearish tone. Today, Gift Nifty indicates a neutral to slightly gap-down start,
around 30 points negative.
What can we expect today?
In the previous session, both Nifty and Bank Nifty fell sharply. Structurally, the trend remains negative.
However, due to major firms' results, we might see some volatility in the first half, possibly leading to initial speculation.
That said, as per the structure my expectation is a continuation of the correction that's my current view
The alternate view is If the market takes an initial pullback, we could see a 23–38% retracement in the minor swing. Even in this scenario, the bias remains bearish unless the 38% Fibonacci level is broken.
A break above 38% could extend the pullback toward the 50–78% levels.

[INTRADAY] #BANKNIFTY PE & CE Levels(21/07/2025)Bank Nifty is expected to open with a gap-up, indicating early bullish sentiment. However, price action near the 56,450–56,500 zone will be crucial in deciding the day’s direction. If Bank Nifty manages to sustain above the 56,650 level after opening, it may invite fresh momentum on the upside. A move above this zone can be seen as a strength confirmation, potentially pushing the index toward targets of 56,750, 56,850, and even 56,950+ levels.
On the other hand, if the index faces resistance and shows rejection from the 56,450–56,400 supply zone, weakness can creep in. This could trigger a corrective move toward the lower levels of 56,250, 56,150, and 56,050-, making it a favorable short trade setup for the day if confirmed by price action.
Additionally, a breakdown below the 55,950 support level can lead to strong bearish pressure. If this level is breached and sustained, the index may fall sharply toward the support zones of 55,750, 55,650, and 55,550-, indicating bearish continuation.

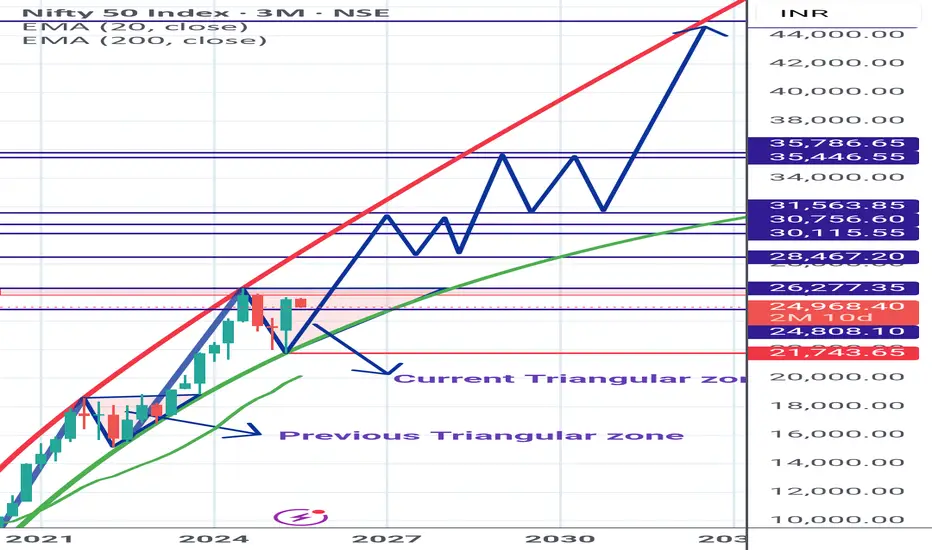
Nifty Spot Longterm View *Nifty Spot* Chart for members Reference.
Currently trading in Parabolic trend and inside Triangular zone.
On closing above the triangular zone, big rally to Begin.
Shared *My Study* based on chart pattern.
Kindly do your analysis from your side too.
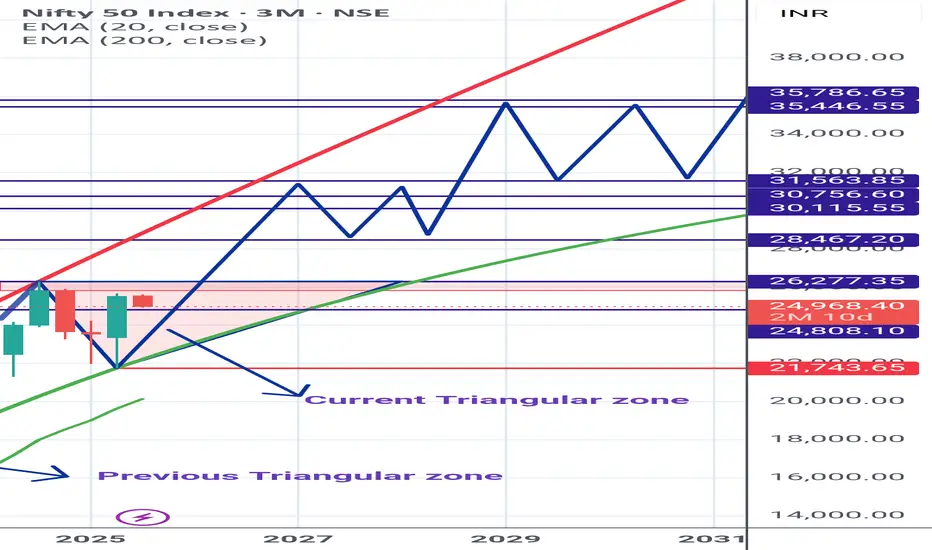
Nifty Spot Longterm View*Nifty Spot* Chart for members Reference.
Currently trading in Parabolic trend and inside Triangular zone.
Shared *My Study* based on chart pattern.
Kindly do your analysis from your side too.
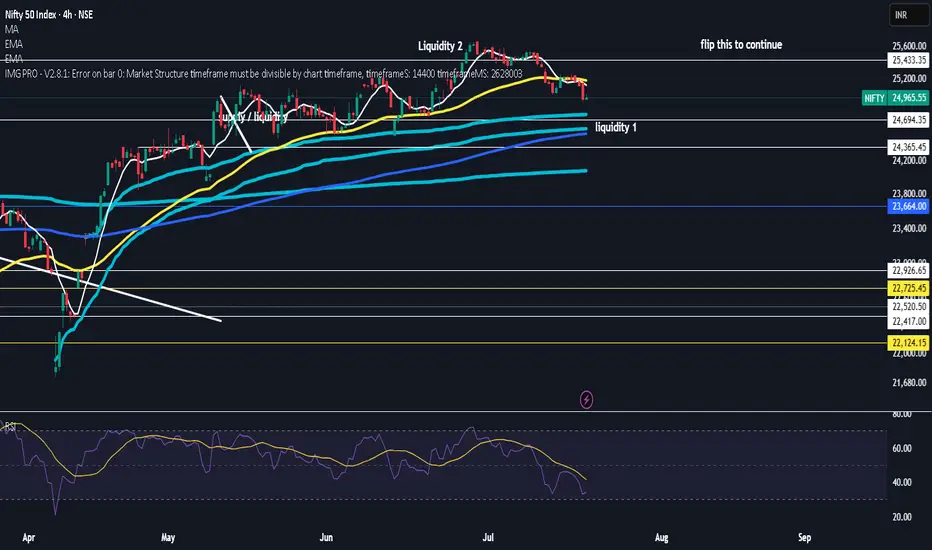
$nifty50took first liquidity and deviated back
now we take liquidty under vwap or not but good spot to reverse here
ATH incoming
rsi looks nice and reset
wont be suprized if we range here for a bit before blasting through
Australia 200: Pullback Presents Second Chance for LongsThe Australia 200 contract continues to trade above former horizontal resistance at 8627, with Monday’s pullback offering an improved entry level for longs looking to buy the breakout.
Bullish positions could be established ahead of 8627, with a stop beneath for protection. The session high of 8727 looms as an initial test for longs, with a push above that level opening the door for further upside.
While some like to use extension targets, the preference would be to wait for a clear topping pattern before exiting the trade. Others may prefer to adopt a target based on the desired risk–reward of the trade.
Bullish price momentum is showing signs of picking up again, favouring a similar bias. Iron ore futures are also flying in Asia, likely assisting gains across the underlying materials sector.
Good luck!
DS

US stocks hold near record highs on strong 2Q earnings
Despite elevated valuation pressures, US equities remain near all-time highs. While tariff concerns persist, resilient US economic data continues to support the market's upward momentum.
United Airlines reported a 1.7% YoY increase in 2Q revenue, citing easing geopolitical and macroeconomic uncertainties and a double-digit rebound in corporate demand. Meanwhile, earnings and share performance among mega-cap stocks have also been strong.
Netflix (NFLX) beat market expectations with 2Q revenue of $11.08 billion and EPS of $7.19. At the same time, Nvidia (NVDA) reached a fresh all-time high on renewed optimism over a potential resumption of exports to China.
After testing the support at 6285, US500 rebounded and approached its previous high again. The index holds above EMA21, suggesting the continuation of bullish momentum. If US500 remains above both EMA21 and the support at 6285, the index could breach the 6320 high. Conversely, if the US500 breaks below the support at 6285, the index could retreat further toward 6200.

CALL THE MARKETS - XAUUSD ANALYSISWE HAVE
ona
kyle
Hasan
Ashlee
Mav
We are looking for the new red candle to drop down to 23100 area. from the 23100 to see continuation or a reversal towards ATH for a rejection to continue down to our lower Blue square area.
obviously we will wait for more news but thats what we are looking a for now.

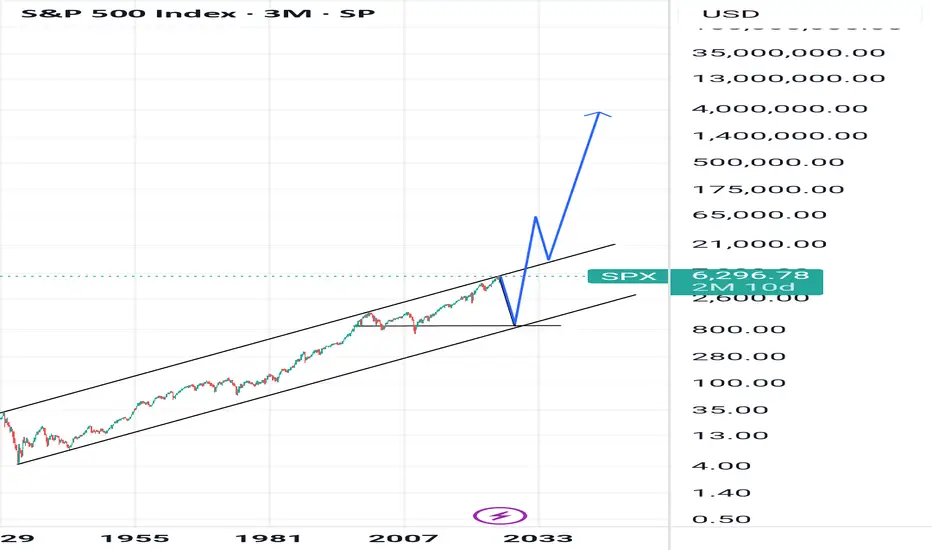
Things are about to get wild. Just for fun... Hey, it can happen... right? 🤔😉
85% drop then.. hyper inflation.