Let’s talk about technical analysis & stops.Technical analysis is not your decision-making process — it’s a tool to help you structure better trading decisions by studying past price movements to anticipate likely future moves.
👉 Every time you look at a chart, you should decide:
✅ Do I want to trade at all?
✅ What’s my entry?
✅ Where’s my stop (when does my thesis fail)?
✅ What’s my target (where will I take profits)?
________________________________________
🛑 Where to put your stop?
Take the S&P 500 daily chart. It’s been trending up strongly. Many traders use an exponential moving average (EMA) as a dynamic stop.
But:
• A 9 EMA often stops you out too early on strong trends.
• Adjusting to a 15 or 16 EMA could keep you in the trade longer, letting your winners run.
In tools like TradingView, you can visually adjust the EMA and see in real time how it would have kept you in or taken you out.
________________________________________
💡 Key takeaway:
When price closes below your EMA stop — that’s your signal to exit and lock in profits.
Use TA to structure your trades, not just spot pretty patterns.
________________________________________
💬 What’s your favourite method for setting stops?
Disclaimer:
The information posted on Trading View is for informative purposes and is not intended to constitute advice in any form, including but not limited to investment, accounting, tax, legal or regulatory advice. The information therefore has no regard to the specific investment objectives, financial situation or particular needs of any specific recipient. Opinions expressed are our current opinions as of the date appearing on Trading View only. All illustrations, forecasts or hypothetical data are for illustrative purposes only. The Society of Technical Analysts Ltd does not make representation that the information provided is appropriate for use in all jurisdictions or by all Investors or other potential Investors. Parties are therefore responsible for compliance with applicable local laws and regulations. The Society of Technical Analysts will not be held liable for any loss or damage resulting directly or indirectly from the use of any information on this site.
Market indices

SPX: highly optimisticThe US market celebrated on Friday the US Independence Day, after highly optimistic last two weeks. Almost every day, the S&P 500 was reaching new all time highest levels, finishing Thursday trading session at 6.279. At this moment this is officially treated as a new ATH for the index. The optimism was supported by better than expected US jobs data posted during the previous week. The NFP added 147K new jobs in June, which beated market expectations. The strong US payrolls reinforced market confidence despite concerns over trade tariffs. With inflation remaining sticky and solid jobs growth, markets have increased expectations of the Fed's rate cut in September. Currently, there is relatively low odds that the next rate cut might occur at the Julys FOMC meeting.
Tech companies were again those who led the index to the upside. The leader was for one more time Nvidia, with a weekly surge of 9,7%. AMZN was traded higher by 6,3%, MSFT by 3,9%. TSLA was struggling a bit, ending the week 0,33% higher from the week before.
Weekly news regarding trade tariffs include a US-Vietnam trade deal of 20% tariffs on imports from Vietnam. At the same time, the US exports to Vietnam will be tariffs-free. However, markets are still concerned regarding the final resolution of imposed 90-days delay of implemented tariffs for almost 180 countries around the world, a period which expires in July. On the other hand, Trump's tax mega bill was passed by the US Senate on Tuesday, and is currently awaiting final approval from the House. There were many discussions during the previous period that this tax mega bill might further increase US debt levels, which will be negatively reflected in the economy.


US30 Will Move Higher! Buy!
Take a look at our analysis for US30.
Time Frame: 1h
Current Trend: Bullish
Sentiment: Oversold (based on 7-period RSI)
Forecast: Bullish
The market is testing a major horizontal structure 44,556.0.
Taking into consideration the structure & trend analysis, I believe that the market will reach 44,867.4 level soon.
P.S
Please, note that an oversold/overbought condition can last for a long time, and therefore being oversold/overbought doesn't mean a price rally will come soon, or at all.
Disclosure: I am part of Trade Nation's Influencer program and receive a monthly fee for using their TradingView charts in my analysis.
Like and subscribe and comment my ideas if you enjoy them!

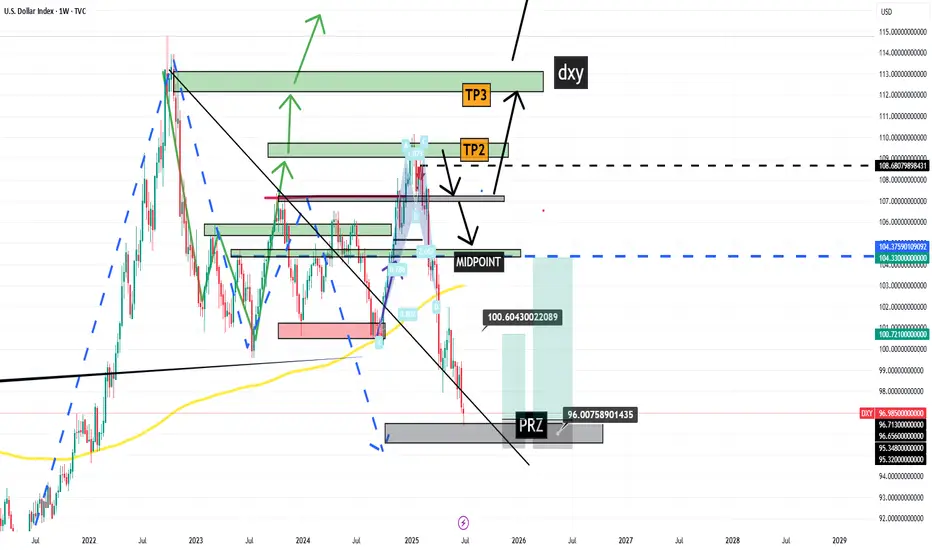
DXY Potential Bullish Reversal – Target 99.456 DXY Potential Bullish Reversal – Target 99.456 🎯
Technical Analysis Overview:
🔹 Trend Structure:
The chart illustrates a recent downtrend, which has been broken as price moved above the descending trendline, signaling a potential trend reversal.
🔹 Pattern Insight:
A bullish harmonic pattern is visible (possibly a bullish Bat or Gartley), with the price reacting from the PRZ (Potential Reversal Zone), aligning with key support near 96.500. The market has respected this zone multiple times, evident from the orange highlighted circles showing price rejections.
🔹 Support & Resistance:
Support Zone: ~96.500
Breakout Zone: ~96.985 (current consolidation near this resistance)
Target Zone: Marked at 99.456, which aligns with previous structure and fib projection.
🔹 Market Sentiment:
Price is consolidating after breaking the downtrend, forming a bullish rectangle (accumulation). The green arrows indicate bullish intent from buyers defending support levels.
🔹 Price Action Signal:
Formation of higher lows.
Break of structure and close above previous highs.
Possible breakout pending above consolidation box.
📊 Conclusion:
DXY shows bullish potential as it builds a base around strong support. A confirmed breakout above the rectangle could fuel a rally toward 99.456. Keep an eye on volume and confirmation candles for entry. ✅

BULLISH ON DXYSince I'm bearish on bonds, I am bullish on the DXY.
I would like to see that 4-hour order block hold and DXY attack the buy-side.
However, I’m open to the idea that we could take out the sell-side liquidity first, then move to the buy-side.
Looking at EUR/USD, we do have equal highs, so perhaps EUR/USD takes out the buy-side liquidity before heading lower.

DJIDou John's in a bit to a new one in a while but it is still in bed now but it is not going in to it I can but it's a new day in a while so it will work but it's still available I will work with a new day USA and then we will go with
July 7 - 1th: Sell The RIPs, Buy The DIPs! (PART 1)This is Part 1 of the FOREX futures outlook for the week of July 7 - 11th.
In this video, we will analyze the following FX markets:
USD Index, EUR, GBP, AUD, NZD, & CAD.
Last Friday was a bank holiday, so the price action is discounted. This Monday has no red folders on the calendar, so the environment is set for a day of misdirection. Be careful to take only trades that confirm your directional bias!
USD is still weak, and analyst have determined the FED will put off cutting rates until September. Tariffs wars may start up again July 9th. And Trumps Bill can add 3+ trillion to the debt.
None of this supports the USD!
Look to buy the dips xxx USD, and look to sell the rips vs USD xxx.
Enjoy!
May profits be upon you.
Leave any questions or comments in the comment section.
I appreciate any feedback from my viewers!
Like and/or subscribe if you want more accurate analysis.
Thank you so much!
Disclaimer:
I do not provide personal investment advice and I am not a qualified licensed investment advisor.
All information found here, including any ideas, opinions, views, predictions, forecasts, commentaries, suggestions, expressed or implied herein, are for informational, entertainment or educational purposes only and should not be construed as personal investment advice. While the information provided is believed to be accurate, it may include errors or inaccuracies.
I will not and cannot be held liable for any actions you take as a result of anything you read here.
Conduct your own due diligence, or consult a licensed financial advisor or broker before making any and all investment decisions. Any investments, trades, speculations, or decisions made on the basis of any information found on this channel, expressed or implied herein, are committed at your own risk, financial or otherwise.

EGX100 Equal Weight – Is a Strong Rebound Coming?On the weekly timeframe, the EGX100 Equal Weight Index is showing a technically significant structure:
🔹 Touched the midline of the Fibonacci channel for the 9th time, after a confirmed breakout — this midline has acted as a dynamic support zone over time.
🔹 Also testing an ascending trendline for the 3rd time, adding strength to the current support confluence.
📌 A strong weekly close above both the channel midline and the trendline could be the trigger for a powerful rebound, God willing.
This zone might represent a critical inflection point — keep an eye on how price action unfolds in the coming weeks.


#Dollar / #Bitcoin correlation I've previously described the correlation, and it's clear to everyone: a weaker DXY is positive for BTC.
📝Recently, the dollar has grown significantly and seems close to a local maximum (the chart is inverted). This demonstrates the strength of Bitcoin, as it was able to rise even against a strengthening dollar.
💡Imagine its movement when the new administration plans to lower the dollar price like they did last time. I think we will see a similar scenario as in 2017, when the dollar, from a local maximum, begins to provide a tailwind to the movement of assets that trade against it.

NI225: Strong Growth Ahead! Long!
My dear friends,
Today we will analyse NI225 together☺️
The in-trend continuation seems likely as the current long-term trend appears to be strong, and price is holding above a key level of 39,810.33 So a bullish continuation seems plausible, targeting the next high. We should enter on confirmation, and place a stop-loss beyond the recent swing level.
❤️Sending you lots of Love and Hugs❤️

DXY (Dollar Index) longs to shortsThe dollar has been bearish for several weeks, but we’re now starting to see signs of a potential retracement due to price being in oversold territory. Last week, DXY reacted from a key weekly demand level, suggesting that we could see some short-term bullish movement before any continuation to the downside.
I’ll be watching closely for price to either push higher into liquidity or retrace slightly deeper into more discounted demand zones for a cleaner long setup. This would also align with my short setups across other major pairs, making DXY strength a key narrative this week.
Confluences for DXY Longs:
DXY has been bearish for an extended period — now showing signs of accumulation on higher timeframes
Price may retrace upwards to collect liquidity before continuing its macro downtrend
Recently reacted from a major weekly demand zone
Imbalances and liquidity above, including Asia highs, remain untapped
P.S. If price fails to react from any of my current POIs, I’ll patiently wait for new zones to develop and adjust accordingly — always staying aligned with what price tells us.
Let’s stay sharp and crush the week ahead!

NAS100 CAUTION - Realistic Perspective!!Dear Friends in Trading,
How I see it,
This rising channel represents severe overbought greed territory.
A very big correction might be around the corner or in the near future.
Daily and Weekly RSI Divergence could be forced to re-balance at any time.
Keynote:
This is not a contradiction of my previous NASDAQ post.
Short-Term strong bullish price action can still prevail.
But please keep this big picture in mind from here on end.
Feel free to ask questions if anything is unclear.
I sincerely hope my point of view offers a valued insight.
Thank you for taking the time to study my analysis.

DOW Jones go upCMCMARKETS:US30
Reaching the price level of 45,082.74 is inevitable. From the current closing price, there is a high probability of continuation toward the ATH.
However, the price levels 44,440 and 44,344.95 are also acceptable zones from which the move toward 45,082.74 may begin.
At the start of the upcoming week, as soon as the market opens, we are likely to move toward the ATH from one of these three levels.

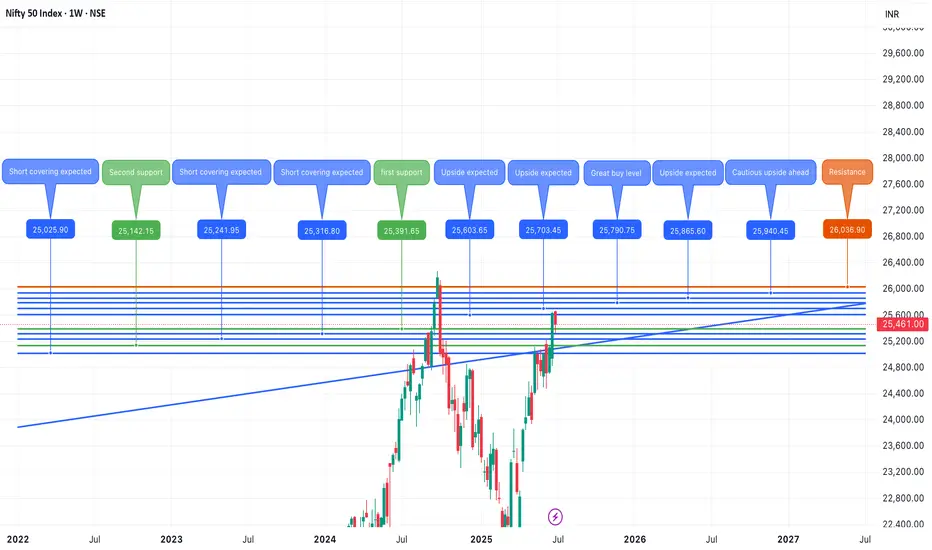
Nifty July 2nd Week AnalysisNifty is looking positive for the upcoming week , and we can expect levels upto 26000 on nifty in the upcoming week . Imp range to watch for upside is 25650-750 .Until then call writers can hamper intraday upside moves. Bulls need to remain cautious of sell on rise until nifty crosses and sustains above 25650-700 range. On the downside imp support zone are 25300-150.
Nifty IT AND RELIANCE WILL BE KEY HIGHLIGHT FOR THE UPSIDE OF NIFTY THIS WEEK.
ALL LEVELS ARE MARKED IN THE CHART POSTED
$NSE:NIFTY is Going to Burst Up Side ! SkyRocketing TIme is NearNSE:NIFTY is Going to Burst Up Side ! SkyRocketing TIme is Near
NIFTY 50 BULLISH REVIEW (My View) 💥
📈 Current Bias: BULLISH
✅ Nifty 50 showing strong resilience above key support levels.
✅ The index is holding well above recent consolidation zones and looks ready for further upside.
✅ Momentum indicators (like RSI) are staying in positive territory, showing sustained strength.
✅ Higher highs & higher lows structure intact on daily chart — bulls in control!
🔑 Key Levels:
👉 Immediate support: 23,333 - (watch for buying interest here)
👉 Resistance ahead: 23,850 - 23,900 (break above = fresh rally potential)
🌟 What I’m Watching:
🚀 Breakout above 23,900 could open doors towards 24,200+ levels in the coming sessions.
🚀 Strong sector participation from banks, IT, and autos — a broad-based rally is a positive sign.
🚀 Keep an eye on global cues + FII activity — may add fuel to the trend.
NSE:NIFTY is Going to Burst Up Side ! SkyRocketing TIme is Near

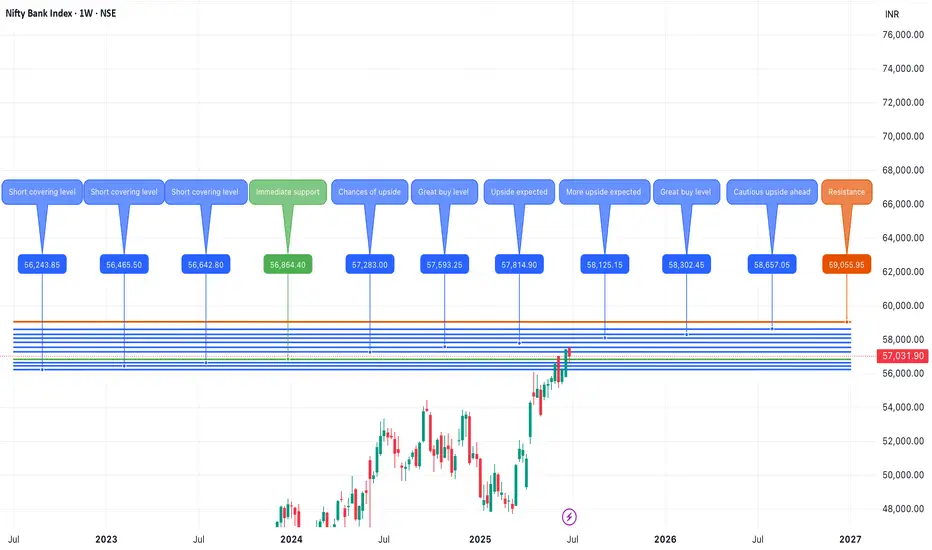
Banknifty July 2nd Week AnalysisBanknifty is looking neutral for the upcoming week , not looking very action-packed week for Banknifty and it can remain subdued with positive bias. While on the upside, if Banknifty crosses and sustains above 57600, then it can form new all-time highs upto 59000 levels . And on the downside, if Banknifty breaches 56800, then we can expect a small retracement upto 56500-200.
ALL LEVELS ARE MARKED IN THE CHART POSTED.
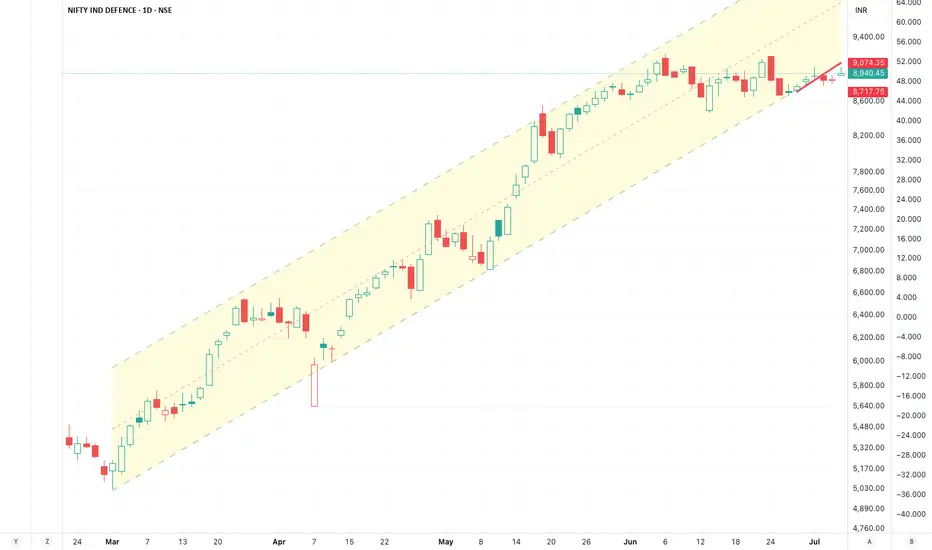
Defence Index Nifty3 months 50%
Technically Facing a resistance.
Sikka, Data , Taneja ate up 70%+
Idea / Techra / Apollo/ astra / Nibe / High /Rossel / more than 50%
Caution warranted.
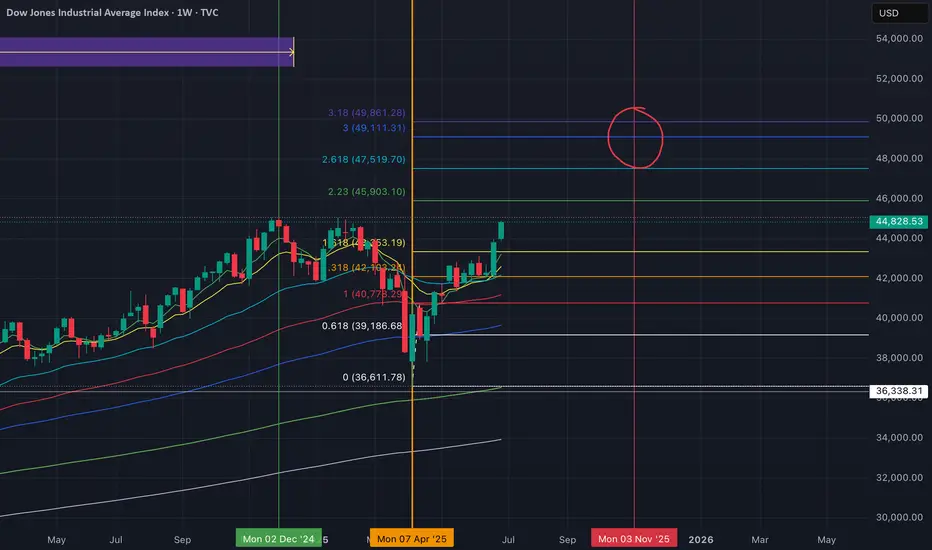
Dow Could Be Gearing Up for a Run Toward 50,000We’ve seen it before—and we might be seeing it again . The Dow Jones is showing a familiar pattern, and here’s what’s happening:
The index has been repeatedly hitting the 1.618 Fibonacci extension from previous ranges.
Right now, we’re approaching the 100% extension between the last swing high (~45,000) and swing low (~36,600).
If the Dow breaks above that previous high at 45,000, there's a good chance we’ll see the pattern repeat—with 50,000 as the next target.
It’s all about that breakout confirmation. Until then, we watch and wait.
This market has a memory—let’s see if it chooses to repeat it again.

DXY Is Bearish - But A Retest is Highly ProbableThere is no denying that the overall trend is still bearish. However, price is currently respecting an H4 demand zone - which might continue to apply pressure to the upside for a minor correction.
Of course, if this correction does not happen and the H4 demand zone breaks, then we continue to ride the trend to the downside and all the way to the next weekly TF demand zone.
#TheTrendIsYourFriend

Relation between DXY BTC TOTAL#📄 Analysis of three price charts and comparison between dates and movement
◀️ So far, the anticipated rise in alternative currencies has not occurred, and the rise that has happened is considered small and weak since the bottom of 2022
📄 In the first price chart, we see the movement of the US Dollar Index (DXY)
🔽 Each time the index breaks below the 100.00 level, it has a path to test 90.00, and this path has been achieved twice before during the periods of 2017 - 2018 and 2020 - 2021, with each time lasting approximately 320 days
◀️ At the moment we are in, there has been a break below the 100.00 level in DXY, and we are currently on day 84 of this break
⭕️ In the first break between 2017 - 2018, Bitcoin moved up by 2128%, and alternative currencies moved up by 3030%
⭕️ In the second break between 2020 - 2021, Bitcoin moved up by 608%, and alternative currencies moved up by 1668%
⭕️ In the current third break, which is still in its early stages, Bitcoin has moved up by 48%, and alternative currencies have moved up by 23%
⌛️ This period may extend into the first quarter of 2026, and it is essential to monitor developments closely with daily and weekly follow-ups
