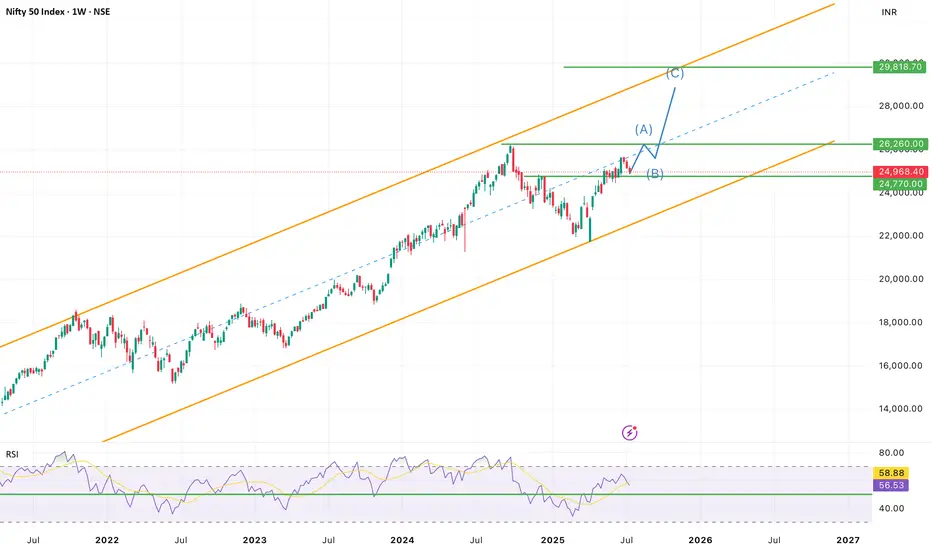
NIFTY50.....Where are the targets?Hello Traders,
The NFTY50 failed to make new high's, but has achieved my long-term target @25577 points.
It also broke below the trend-line, connecting the high's of 25116 to 25222. This is a bearish sign!
I have labelled the chart as a w-x-y pattern, that could also morph into an a-b-c!
But what to expect for the coming sessions?
Chart analysis.
The weakness at chart is not done to my view!
In normal, a corrective move, here a possible wave ((iv)), pink, will return to a wave 4 of lower degree. So we should expect a target range at or around the 24000 points! If so to come, this would be potentially buy_area! A break to the upside is not in (my) the cards. Too much overlapping waves, buy and immediately sell-orders..... This is not how an impulse look like!
Of course; a wave iv correction can morph into a w-x-y pattern. And if so, the price would extend to an 2.618 Fibo after it was complete!
Again. The correction look like not complete, and it will be interesting how markets will answer on Monday.
So, that's it for today!
Have a great weekend.....
Ruebennnase
Please ask or comment as appropriate.
Trade on this analysis at your own risk.
Market indices

More upside for SPX500USDHi traders,
Last week SPX500USD made a small correction down (grey wave 4) and after it swept the dotted trendline it went up again. This could be the next impulse wave 5 (grey).
If this is true, then next week we could see more upside for this pair.
Let's see what the market does and react.
Trade idea: Wait for a small pullback and a change in orderflow to bullish on a lower timeframe to trade longs.
If you want to learn more about trading FVG's & liquidity sweeps with Wave analysis, then please make sure to follow me.
This shared post is only my point of view on what could be the next move in this pair based on my technical analysis.
Don't be emotional, just trade your plan!
Eduwave

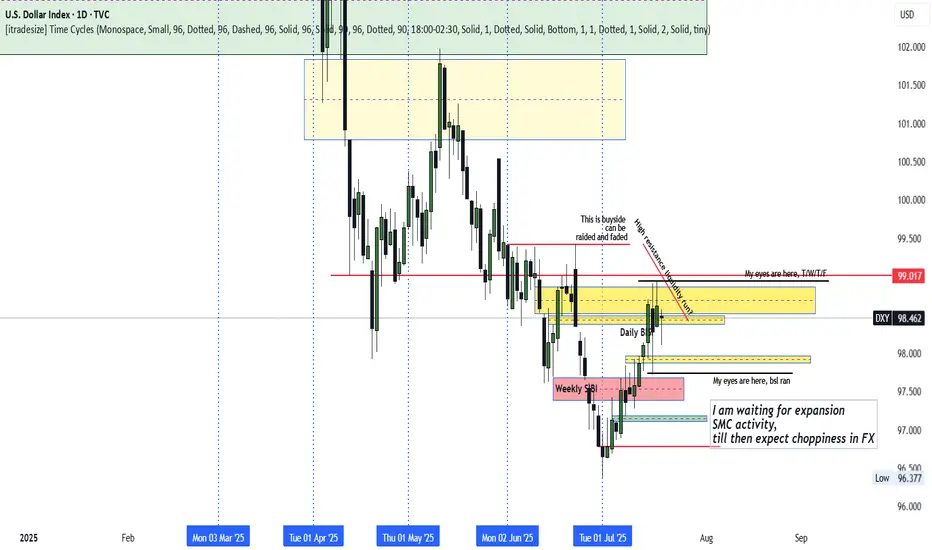
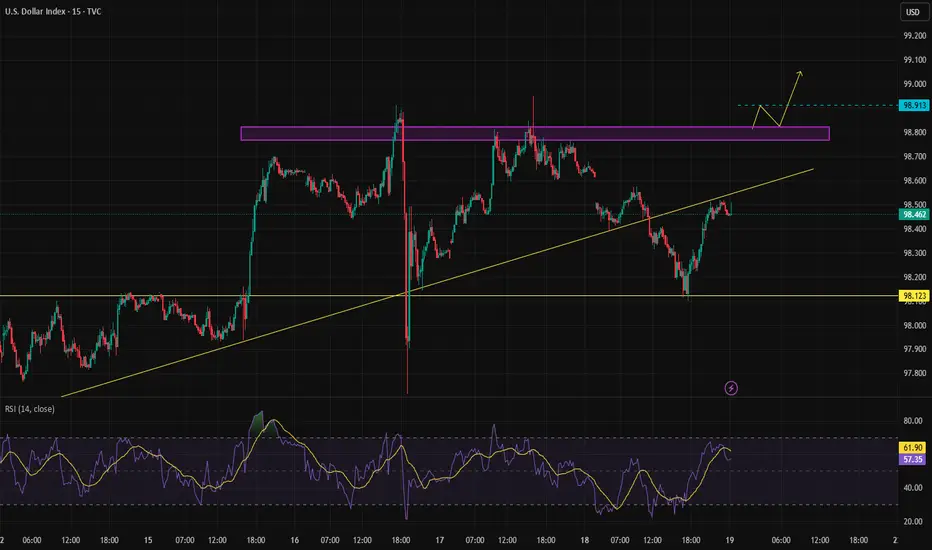
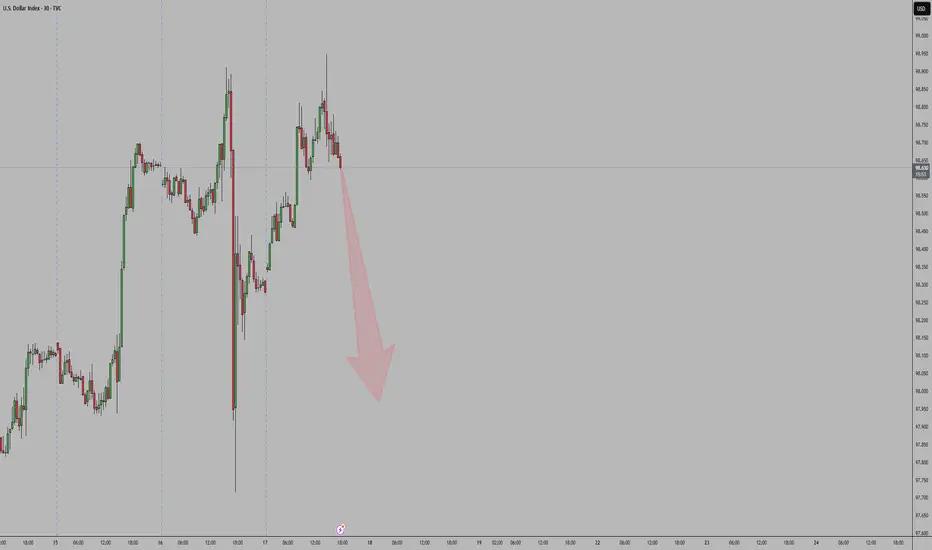
DXY Indecisive
DXY remains locked in its previous week's range, especially locked in Wednesday's range.
The Thursday rally above Wednesday's high appears to be a fake breakout aimed at trapping traders long.
With stops seemingly below Wednesday (Previous Week Low), how we trade past the previous week high or/and low should inform the unfolding direction.
With a run to the previous week's low and high possible, caution is recommended. Await expansion avoid the surge of new's release in the coming week and the choppiness that could unfold.
DXYDXY refers to the U.S dollar index ,an index that measures the value of united state dollar relative to a basket of six major foreign currencies ,it was originally developed by FED'S
THE SIX MEJOR CURRENCIES ARE ;
.euro,japaneses yen, pounds sterling, Canadian dollar, Swedish krona,swiss franc.
the index is used by investors ,traders and economist to gauge the overall strength of the U.S dollar in a global currency markets. Its rise and fall will influence trade ,investment and monetary policy decision in fx window.
on 4hr we are rejected and i will watch market open and close on Monday for trade directional bias for the following pairs (AUDUSD,USDCAD,USDZAR,GBPUSD,EURUSD,USDJPY,XAUUSD XAGUSD,XCUUSD,BITCOIN )
NOTE;TRADING IS 100% PROBABILITY,RISK MANAGEMENT IS KEY AND GET ACCOUNTABLITY PARTENER WHO WILL BE CHECKING YOUR WORK..
#DXY #DOLLAR

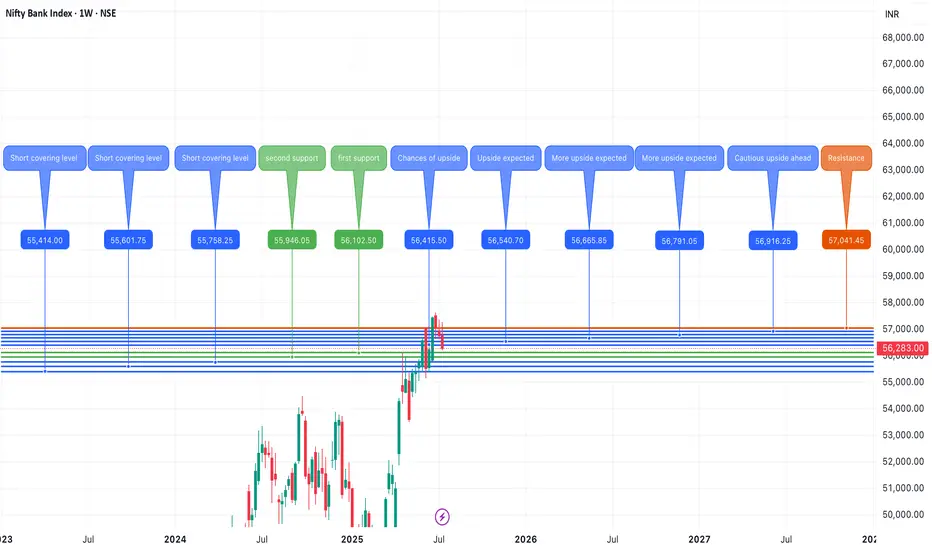
Banknifty July 3rd Week AnalysisBanknifty is looking uncertain but we can expect short covering in later half of th week if it retraces upto 55400-600 , Imp support levels on downside are placed between 55900-56100 and below that we can expect levels upto 55700-400.On the upside imp level to watch 56550 and if banknifty crosses and sustains above 56550 then we can expect further upside upto 56900-57100.
ALL LEVELS ARE MARKED IN THE CHART POSTED.
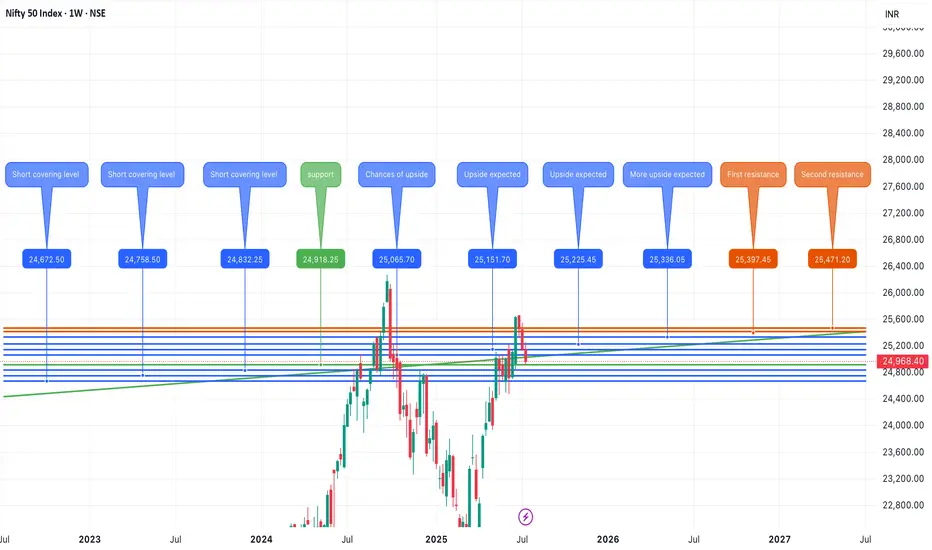
Nifty July 4th Week Analysis Nifty trend is looking unclear and closing is certainly not in favor of bulls, downside would be open upto 24700 if nifty breaches important support of 24900-830. To resume its upside momentum nifty must cross and sustain above 25150-200.
All levels are marked in the chart posted.
DXY area to watch.Approaching the extreme of the recent bearish leg. If it holds, then expect most major pairs (EURUSD, GBPUSD etc) to continue their upside momentum. If it fails, then we can expect to see further downside moves on the majors.
As per my strategy. That extreme POI swept a previous high, created the BOS, and sits beautifully on the 71% retracement level. The majority of my confluences are ticked, just missing that clear 'Imbalance'. So now we wait, and monitor the reaction on the 4H. If we see a nice clean liquidity sweep, BOS + Imbalance then I'm in for sells.
Let me know your thoughts, anything can happen!

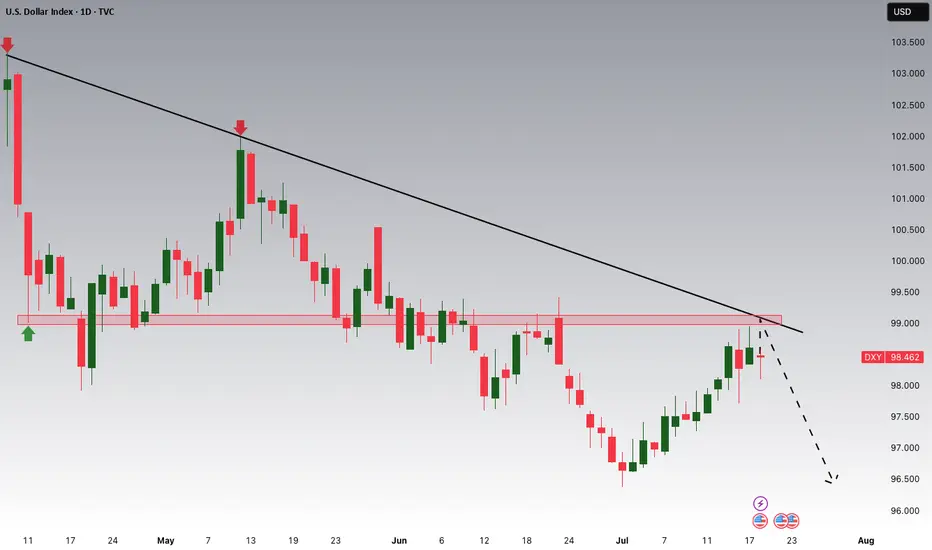
DXY Potential DownsidesHey Traders, in the coming week we are monitoring DXY for a selling opportunity around 99.000 zone, DXY is trading in a downtrend and currently is in a correction phase in which it is approaching the trend at 99.000 support and resistance area.
Trade safe, Joe.
DXY – Short-Term OutlookThis week, we’ll be analyzing several currency pairs that are showing promising trading setups.
Unlike previous weeks, we plan to focus on lower timeframes and shorter market cycles to take advantage of more agile trading opportunities.
If the price manages to give us a clear confirmation within the marked zone, we can start considering a potential shift to a bullish trend on DXY.
This would set the stage for preparing long positions, as market structure would likely begin aligning in favor of the bulls.
Until that confirmation arrives, we stay cautious and wait for price action to validate the move.
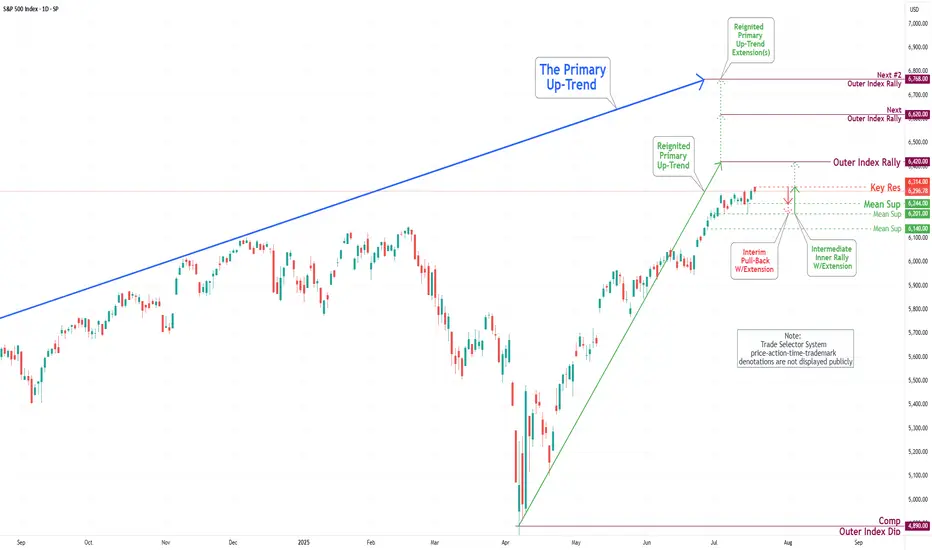
S&P 500 Daily Chart Analysis For Week of July 18, 2025Technical Analysis and Outlook:
During the current trading week, the S&P 500 Index has demonstrated a predominantly upward trajectory. It has successfully retested the Mean Support level at 6200 and established a new Key Resistance level at 6314. Currently, the index displays a bullish sentiment, with the objective for the Outer Index Rally set at 6420.
Nevertheless, it is essential to recognize that the current price action may result in a decline, potentially leading to a retest of the Mean Support at 6244 and extending to the Mean Support at 6201. Following this potential downward movement, it is anticipated that the index will resume its upward trend, driving the price action towards the Key Resistance level at 6314 and ultimately achieving the Outer Index Rally target of 6420.
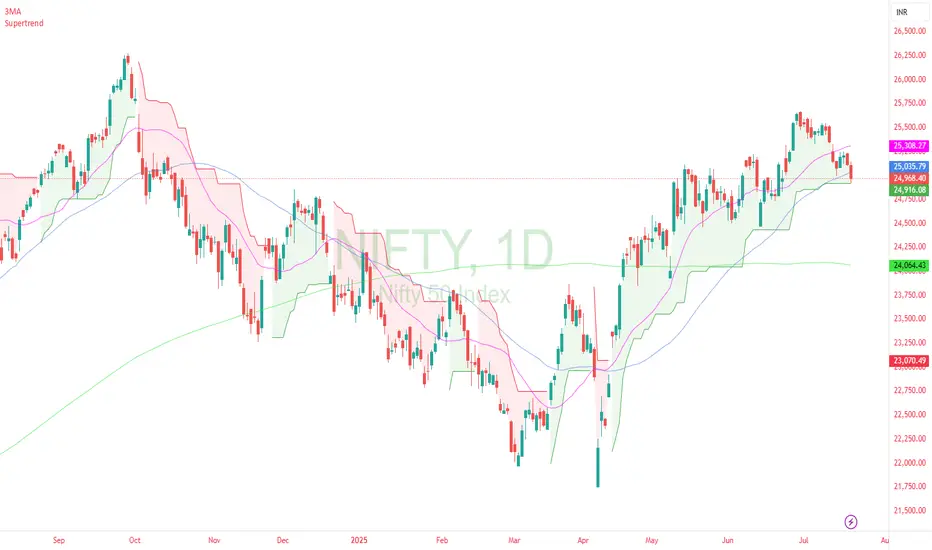
nifty dailyThis is great chart . Price is at Supertrend support on daily chart. Lowest risk in going long. Best technical chart in while .
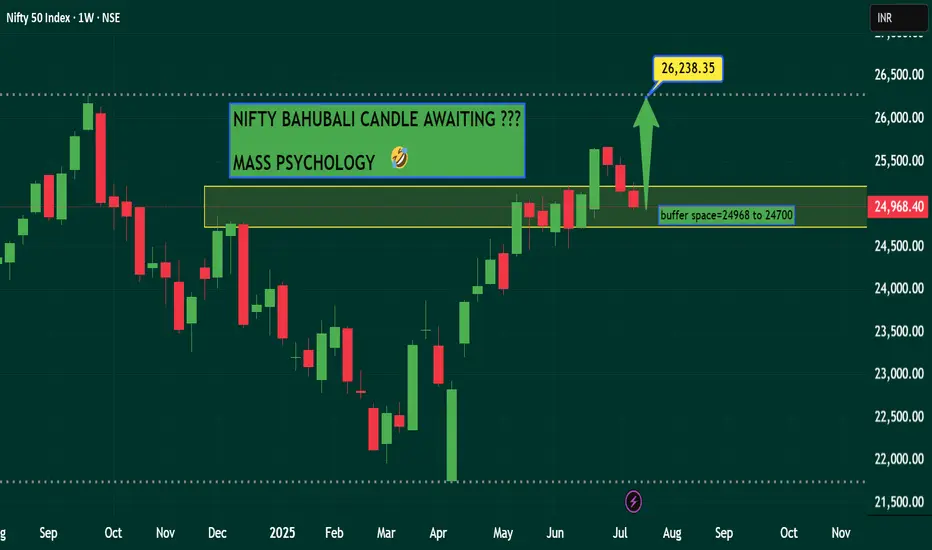
NIFTY - NEW HIGH SOON...NSE:NIFTY Weekly chart showing negative closing from last three weeks, but undertone of the market showing something big to come on price. Rsi giving positive divergence on intraday timeframes.
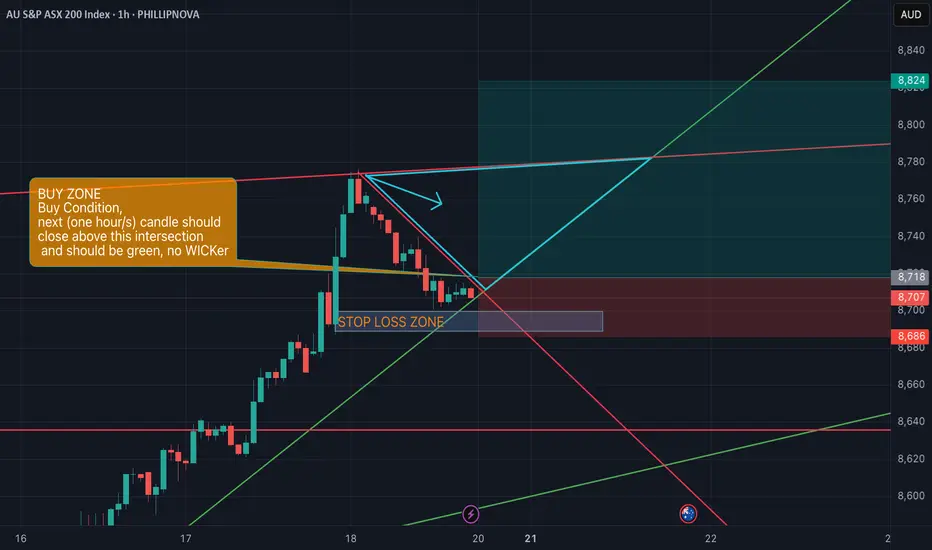
AUS200 Breakout or Fakeout? I Say Breakout – Here's Why🔍 Technical Overview:
After monitoring the recent movement in AUS200, I believe we are in the early phase of a bullish breakout continuation rather than a fakeout.
Uptrend Structure: Price has been consistently respecting higher lows and trending above the green trendline.
Break of Descending Resistance: The downtrend line has now been pierced with momentum candles — a bullish sign.
Buy Condition Set:
Next 1-hour/s candle should close above the intersection (highlighted zone).
Candle should be green, and preferably no wick on the top (indicating strength).
Volume analysis to be considered on confirmation.
✅ Trade Plan:
Buy Zone marked.
Stop Loss Zone clearly defined – I plan to exit the trade if price closes back below the shaded red/gray zone.
Upside Potential: Initial target around 8,820–8,840, with extension toward 8,900+ if momentum sustains.
Risk/Reward ratio looks favorable based on current structure.
📰 Fundamentals:
I have not yet identified any bearish macro or news catalyst that contradicts the current technical picture. If you know of any relevant developments (e.g., RBA policy, earnings, CPI releases), feel free to comment.
🔄 Validation Request:
Would love the community’s take:
Do you see this as a valid breakout?
Any hidden divergence or bearish signals I might have missed?
Let me know if you're tracking the same structure or see something different.
DXYShort-Term Bearish DXY – Key Reasons
1. Rate Cut Expectations
Markets are pricing in at least one Fed rate cut in Q3 2025 due to slowing inflation and weaker consumer data.
Lower interest rates reduce demand for the dollar, pushing DXY lower.
NASDAQ Short OpportunityPrice formed a distribution schematic 1 and currently forming the LPSY at OTE Level

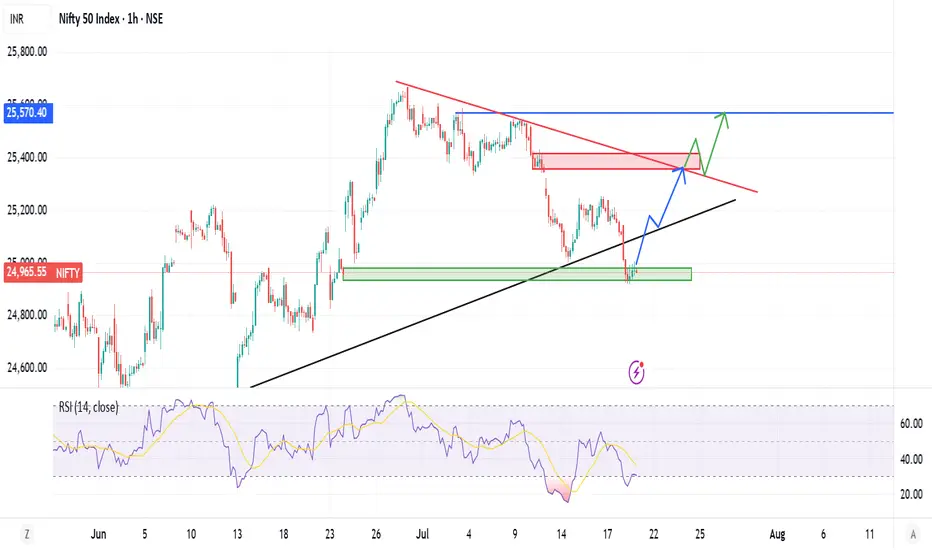
nifty 50 on strong momentumgood momentum seen over nifty , also on good support minor bounce can convert in to a good reversal which can lead it to supply zone or above.
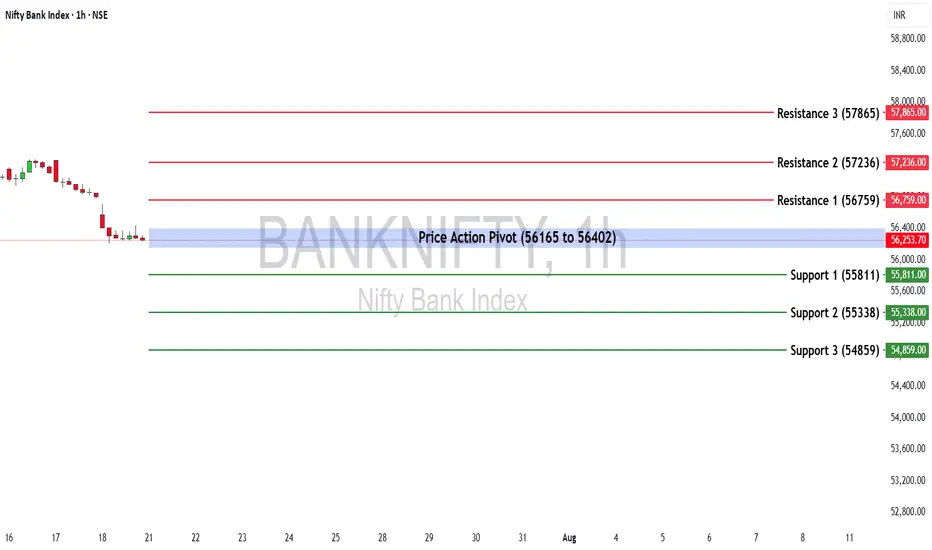
Bank Nifty Weekly Insights: Key Levels & TrendsBank Nifty ended the week at 56,283.00, registering a marginal decline of -0.83%.
🔹 Key Levels for the Upcoming Week
📌 Price Action Pivot Zone:
The critical zone to monitor for potential trend reversals or continuation lies between 56,165 and 56,402.
🔻 Support Levels:
Support 1 (S1): 55,811
Support 2 (S2): 55,338
Support 3 (S3): 54,859
🔺 Resistance Levels:
Resistance 1 (R1): 56,759
Resistance 2 (R2): 57,236
Resistance 3 (R3): 57,865
📈 Market Outlook
✅ Bullish Scenario:
If Bank Nifty sustains above the pivot zone (56,402), it may trigger renewed buying interest, potentially pushing the index toward R1 (56,759) and higher levels like R2 (57,236) and R3 (57,865).
❌ Bearish Scenario:
A breakdown below the lower end of the pivot zone at 56,165 may attract selling pressure, dragging the index towards S1 (55,811) and possibly lower levels like S2 (55,338) and S3 (54,859).
Disclaimer: lnkd.in
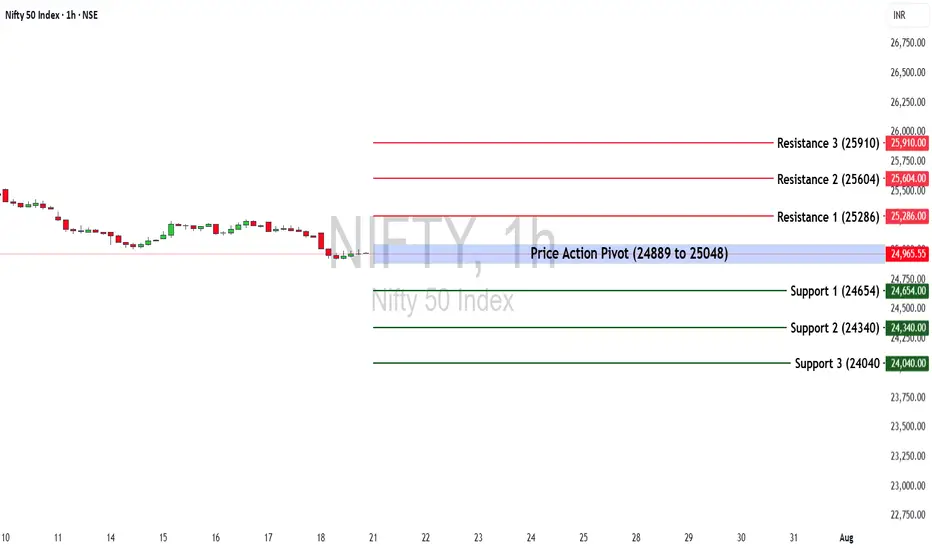
Nifty 50 at a Turning Point? Key Levels & Market Outlook AheadThe Nifty 50 ended the week at 25,149.85, posting a loss of -1.22%.
🔹 Key Levels for the Upcoming Week
📌 Price Action Pivot Zone:
24,889 to 25,048 – This is a crucial range to monitor for potential trend reversals or continuation. A breakout or breakdown from this zone can set the tone for the week.
🔻 Support Levels:
S1: 24,654
S2: 24,340
S3: 24,040
🔺 Resistance Levels:
R1: 25,286
R2: 25,604
R3: 25,910
📈 Market Outlook
✅ Bullish Scenario:
A sustained move above 25,048 (top of the pivot zone) may invite buying interest. If momentum continues, the index could test R1 (25,286) and possibly extend towards R2 (25,604) and R3 (25,910).
❌ Bearish Scenario:
Failure to hold the pivot zone and a breakdown below 24,889 could trigger further downside. The index may slide towards S1 (24,654) and deeper supports at S2 (24,340) and S3 (24,040).
Disclaimer: lnkd.in
Nifty Closes Below 25,000 — What Lies Ahead?The Indian market's recent uptrend appears to be losing momentum, as the benchmark Nifty index extended its decline for the third consecutive week, ending just below the important 25,000 mark.
This pullback has been largely driven by weakness in the Financial and IT sectors, with major players like NSE:TCS , NSE:HCLTECH , and NSE:AXISBANK posting disappointing earnings.
From a technical perspective, the index is now approaching a key support zone near 24,900. A decisive break below this level could open the door for a further slide towards 24,500.
Open Interest (OI) data reinforces this view, with the 25,000–24,900 zone seeing the highest put writing, marking it as an immediate support area. On the upside, strong call writing at 25,100 and 25,200 on Friday suggests these levels will act as immediate resistance.
Given the current structure, the outlook for the coming week remains neutral to bearish.
Traders are advised to stay cautious, manage risk effectively, and keep a close watch on these crucial levels.

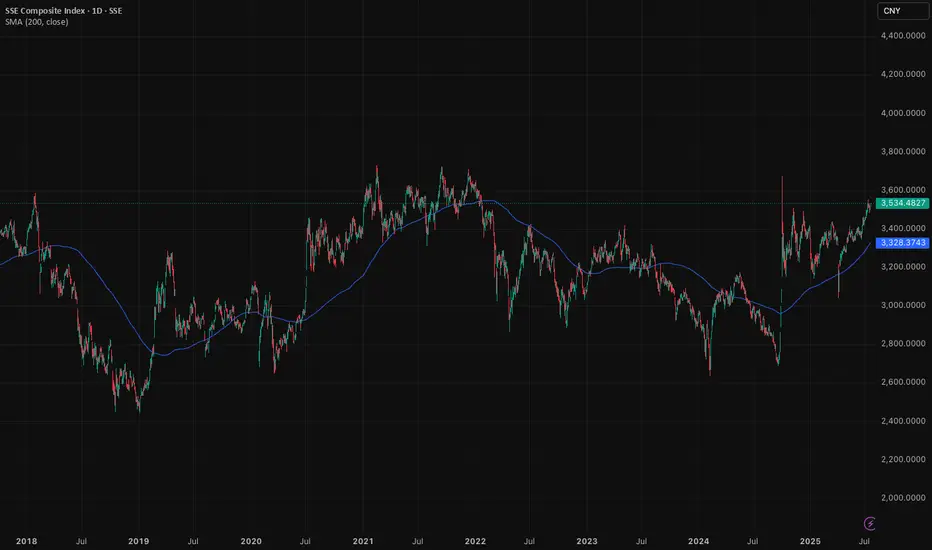
Shanghai Composite: Double bottom signals potential upsideChinese stocks are not for the faint-hearted. It's a market with a lot of volatility, swings, and roundabouts. Despite this, we've been keeping a close eye on the Shanghai Composite Index over the past few weeks and like the pattern we are seeing emerge.
As of the time of writing, the Shanghai Composite Index trades in the 3,500 range. A clear double bottom emerged in September and January last year, as indicated in the chart. We think this is a bullish pattern. When markets test the lows twice and rebound, conviction grows. The worst, it seems, is maybe behind us.
New trades should take important note and understand that Shanghai-listed stocks differ greatly from the H-shares trading in Hong Kong. The Shanghai Composite primarily includes A-shares, domestic Chinese companies driven by local sentiment and liquidity. H-shares, though still Chinese firms, list offshore in Hong Kong and often reflect global investor attitudes rather than local momentum.
Understanding your instrument is crucial. While Shanghai A-shares capture China's domestic economic pulse, H-shares in Hong Kong frequently mirror global risk appetite and geopolitical narratives. Our bullish case lies specifically with the Shanghai market. It is a bet on China's internal economic recovery, supportive policy measures, and improving investor sentiment.
China’s economic stabilisation is underway. Stimulus measures from Beijing are gaining traction. Property market stabilisation efforts (which are medium term in nature) and easing monetary policy signal confidence. Domestic investors, increasingly optimistic, are positioned to drive a sustained rally.
The Shanghai Composite Index could see upside towards the 4,000 and then 4,500-level in the coming years, if the rally continues. Our conviction rests on improving domestic fundamentals, policy tailwinds, and powerful market sentiment unique to mainland China's equity landscape.
Caution is important, given the volatility nature of the index.
The forecasts provided herein are intended for informational purposes only and should not be construed as guarantees of future performance. This is an example only to enhance a consumer's understanding of the strategy being described above and is not to be taken as Blueberry Markets providing personal advice.
nifty support levelSupport is the level at which demand is strong enough to stop the index from falling any further
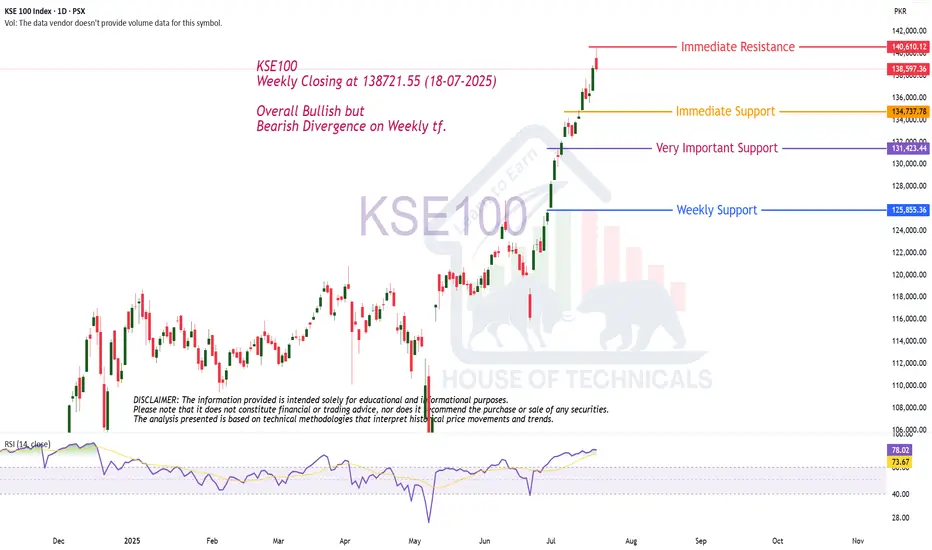
Bullish but Weekly Bearish Divergence ...KSE100
Weekly Closing at 138721.55 (18-07-2025)
Overall Bullish but
Bearish Divergence on Weekly tf.
Dow Jones -> A breakout rally of +40%!🐂Dow Jones ( TVC:DJI ) will create new highs:
🔎Analysis summary:
Since the April lows, the Dow Jones already rallied about +25%. This was simply the expected rejection away from a strong confluence of support. Now, the Dow Jones is sitting at the previous all time highs and about to break out, leading to a massive rally.
📝Levels to watch:
$45.000, $60.000
🙏🏻#LONGTERMVISION
Philip - Swing Trader
