FTSE100 sedeways consolidation supported at 8920The FTSE100 pair price action sentiment appears Bullish, supported by the current rising trend. The recent intraday price action appears to be a sideways consolidation breakout.
The key trading level is at 8920 level, the previous consolidation price range. A corrective pullback from the current levels and a bullish bounce back from the 8920 level could target the upside resistance at 9040 followed by the 9090 and 9130 levels over the longer timeframe.
Alternatively, a confirmed loss of the 8920 support and a daily close below that level would negate the bullish outlook, opening the way for a further retracement and a retest of 8880 support level, followed by 8840 levels.
This communication is for informational purposes only and should not be viewed as any form of recommendation as to a particular course of action or as investment advice. It is not intended as an offer or solicitation for the purchase or sale of any financial instrument or as an official confirmation of any transaction. Opinions, estimates and assumptions expressed herein are made as of the date of this communication and are subject to change without notice. This communication has been prepared based upon information, including market prices, data and other information, believed to be reliable; however, Trade Nation does not warrant its completeness or accuracy. All market prices and market data contained in or attached to this communication are indicative and subject to change without notice.
Market indices

SellRejection Level
Daily Volume
Market Structure Shift
London Session
Trend Line Break
Untapped Order Point
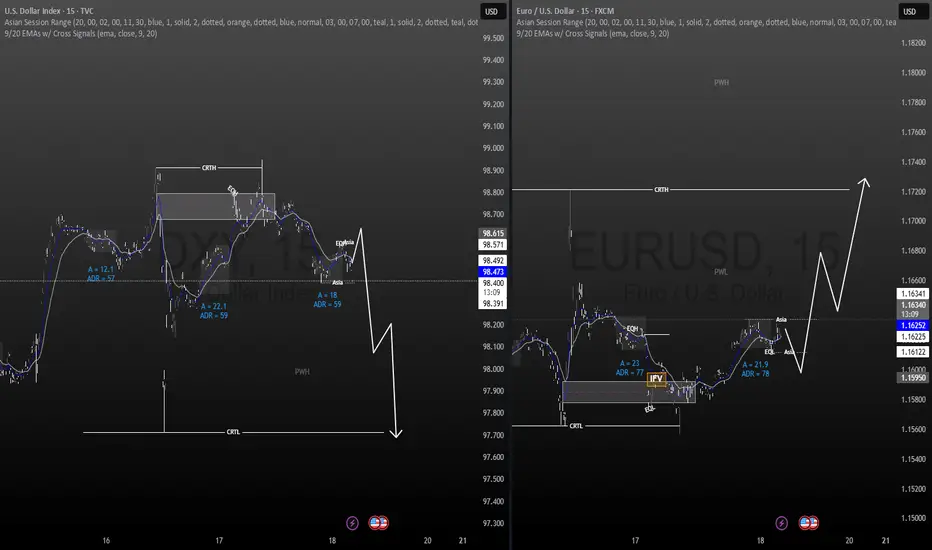
Dollar Index Macro analysisCurrently the Fed's Dollar is kept at 5.50% which is higher than any other currency except for the Kiwi , As we all know interest have high impact on currency prices. We are currently in a consolidation market profile. Therefore my interest is where the next expansion will be at, Clearly defined on my analysis it should be on the upside.

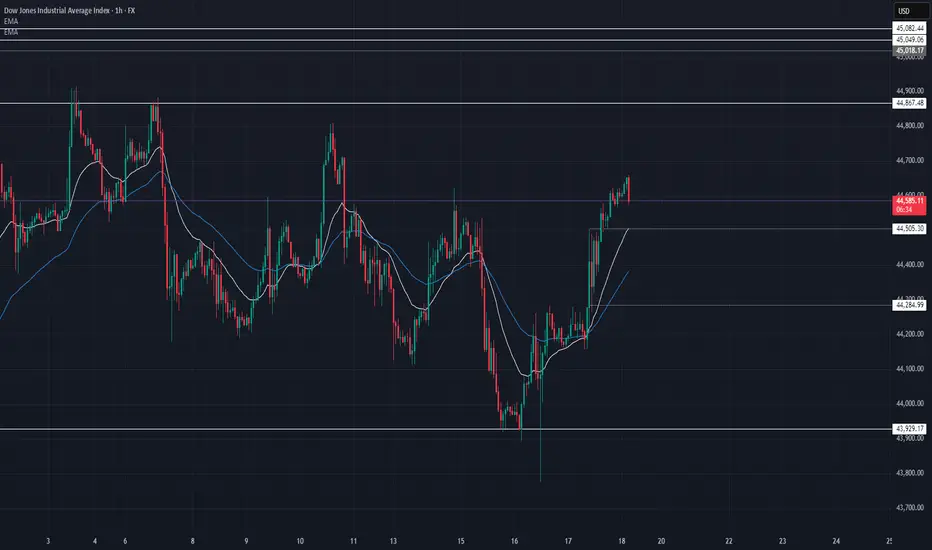
US30 Update – 07/18/2025📍 US30 Update – 07/18/2025
Massive recovery off 43,929 👀
US30 has broken above the 44,500 resistance and is holding strong around 44,590. The EMAs are now sloping bullish on the 1H — this is the first solid bullish structure since the early July top.
If buyers hold above 44,500, we could see a run to retest 44,867, the local high.
📊 Market Structure:
🔄 Bear trend possibly shifting → early signs of reversal
📈 Higher lows forming — EMAs crossed bullish
🔼 Break of 44,505 confirmed strength
🧭 Eyes now on 44,700–44,867 zone
🔑 Key Levels:
🔼 Resistance: 44,700 → 44,867
🔽 Support: 44,505 → 44,285 → 43,929
🧠 Market Bias:
Short-term bullish — but buyers must defend 44,500.
A drop below 44,285 would invalidate this move.
💡 Trade Ideas:
🔼 Long Setup – Continuation:
Entry: Pullback to 44,505–44,530
TP1: 44,700
TP2: 44,850
SL: Below 44,450
🔻 Short Setup – Fade Rejection:
Entry: Rejection at 44,700–44,850
TP1: 44,500
TP2: 44,300
SL: Above 44,900
⚠️ Patience — wait for clean retests or candle rejections at key levels. No need to force entries.
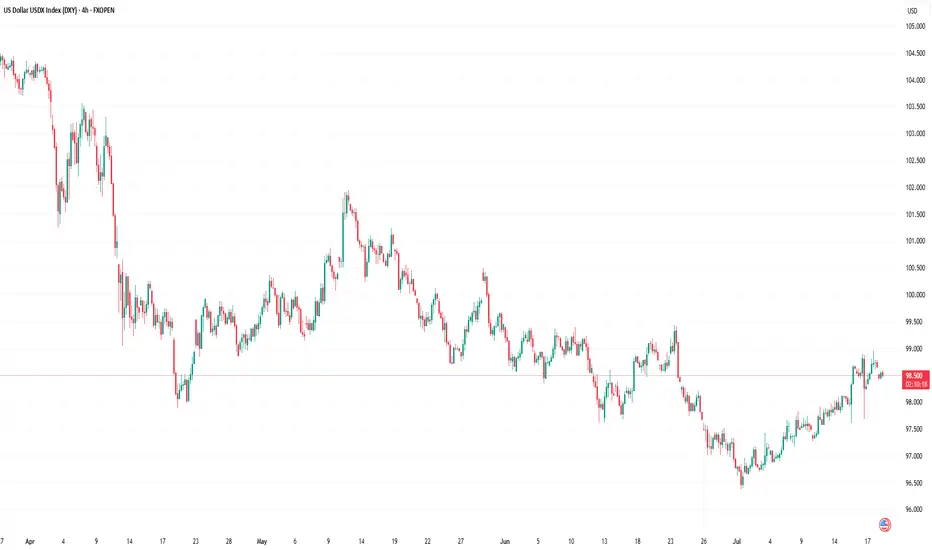
US Dollar Index (DXY) Chart AnalysisUS Dollar Index (DXY) Chart Analysis
The addition of the US Dollar Index (DXY) to FXOpen’s suite of instruments offers traders potential opportunities. This financial instrument:
→ serves as a measure of the overall strength of the US dollar;
→ is not tied to a single currency pair but reflects the value of the USD against a basket of six major global currencies, including the EUR, JPY, and GBP;
→ allows traders to capitalise on price fluctuations in the currency market;
→ is used in more advanced strategies for hedging risks in portfolios sensitive to sharp movements in the US dollar.
In today’s environment of heightened volatility, this instrument becomes particularly valuable. The active stance of US President Donald Trump — through the implementation of trade tariffs, sanctions, and unpredictable geopolitical rhetoric — gives traders even more reason to closely monitor the DXY chart.
Technical Analysis of the DXY Chart
Moving averages show that the US Dollar Index displayed a predominantly bearish trend during the first half of 2025.
However, the picture shifted in July: the index began rising steadily (already up approximately +1.9% since the beginning of the month), highlighted by the blue ascending trend channel.
This suggests that the DXY may have found support following a prolonged decline, and a shift in market sentiment could be underway: after a bearish phase, a period of consolidation may follow. If this scenario plays out, we could see DXY oscillating between the 97.65 and 99.30 levels – both of which show signs of acting as support and resistance (as indicated by the arrows).
This article represents the opinion of the Companies operating under the FXOpen brand only. It is not to be construed as an offer, solicitation, or recommendation with respect to products and services provided by the Companies operating under the FXOpen brand, nor is it to be considered financial advice.
KSE100 & KSE30 side by side on Weekly TFKSE100 & KSE30 side by side on the Weekly TF and would suggest to observe RSI readings. It is the same chart BUT shared on the weekly TF
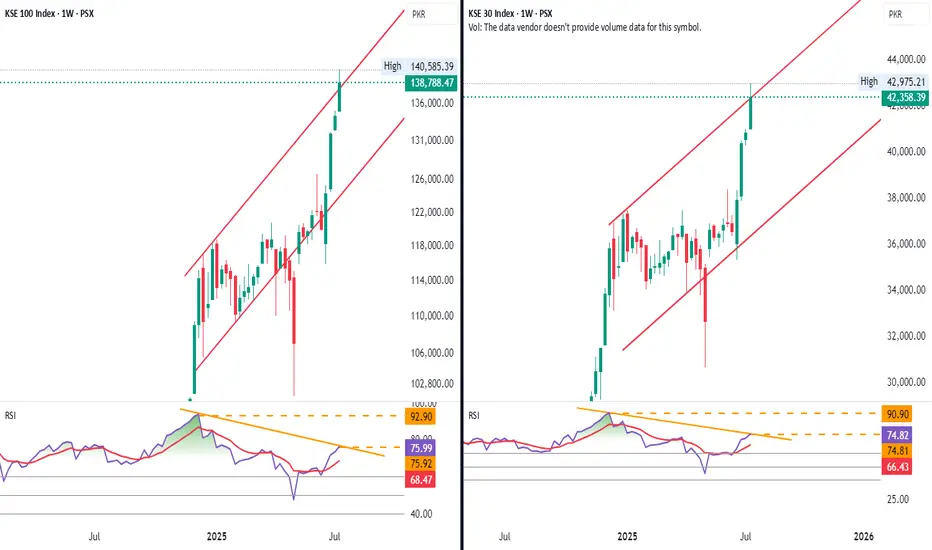
KSE100 & KSE30 on the Daily TFAt the Top of the Ascending Channel on the DTF. Would suggest to be a little cautious.

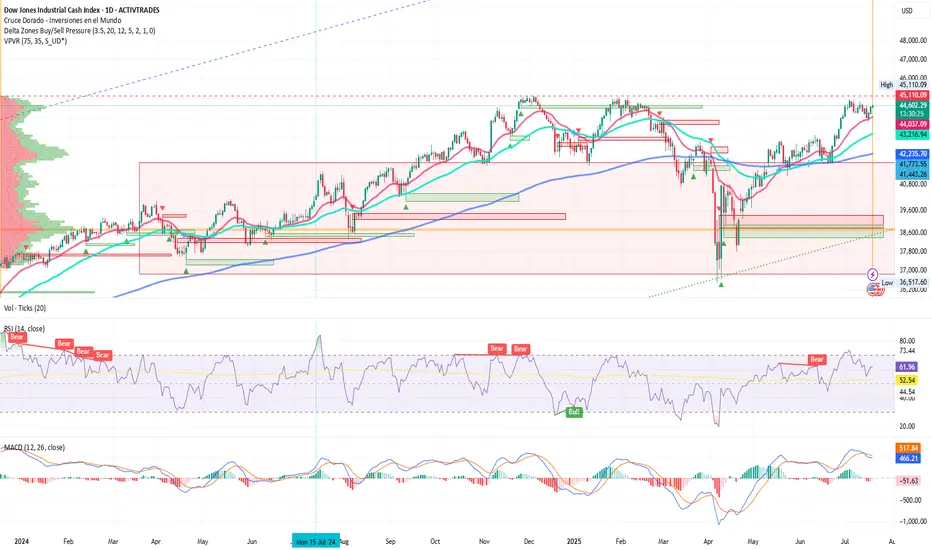
Dow Jones: Shaking amid rumors of Powell’s dismissalIon Jauregui – Analyst at ActivTrades
The main Wall Street indices closed Thursday’s session with mixed results. Comments from Trump stating he had no plans to fire Powell but “doesn’t rule anything out” except in cases of fraud, along with Powell’s declaration that he will serve his full term until mid-2026, pressured the market. The U.S. market has been dealing with these dismissal tensions for seven months, which made the Dow Jones appear weaker, while the S&P 500 and Nasdaq managed to stay in positive territory, supported by strong earnings from key companies. At the session’s start, the Dow Jones fell 0.09% to 44,202 points, while the S&P 500 rose 0.04% to 6,266 points and the Nasdaq gained 0.17% to 20,777 points. However, the Dow Jones closed at 44,484.49 points (+0.52%), the S&P 500 at 6,297.36 points (+0.54%), and the Nasdaq at 20,885.65 points (+0.75%). The day was marked by rumors from the White House, where an official stated that Trump would “probably soon” fire Jerome Powell. The news triggered an intraday drop of over 260 points in the Dow Jones, although markets later moderated losses after clarifications from the former president himself.
An early dismissal of Powell would likely impact the market very negatively and generate significant chaos. Trump’s interest in pressuring the Fed for rate cuts, although he cannot legally dismiss the central bank’s president, has been on the table since the start of his term. This has caused pronounced volatility movements. Meanwhile, the 10-year U.S. Treasury yield fell to 4.449%, as the market reduced the probability of a rate cut in September from 66% to 55% (CME FedWatch).
On the macroeconomic front, June retail sales rose 0.6%, far exceeding the expected 0.1%. Weekly jobless claims stood at 221,000, also below expectations. With these results, Trump has little leverage to challenge the Fed.
Notable corporate results:
PepsiCo surprised positively with EPS of $2.12 (vs. $2.03 expected) and rose 5.7% at the open.
United Airlines advanced 3.6%, beating earnings expectations with EPS of $3.87, although revenues slightly disappointed.
GE Aerospace raised its 2025 EPS forecast to a range of $5.60–5.80, driven by strong aftermarket demand.
Netflix reported after the close, with expectations of $7.09 EPS and $11.06 billion in revenue.
TSMC led chip sector gains, rising more than 3% after announcing record profits thanks to AI. AMD, NVIDIA, and Super Micro also traded higher.
Technical Analysis
Observing the Dow Jones daily chart (Ticker AT: USAIND), since late April the index has moved upward toward its long-term control zone around 42,230 points, where the Point of Control (POC) acts as support for the current rally. In recent days, candles have used the 50-day moving average as support. The price expansion that began on June 6 with a golden cross appears solid. The bullish delta pressure zones from February and last year’s Christmas rally coincide with the current trading zone, suggesting a potential fourth attempt to break the current all-time highs at 45,110.09 points in pursuit of 46,000. If this price area is not breached, a pullback toward the POC zone could occur, and if that level fails to hold, a drop toward 39,600 points may follow.
*******************************************************************************************
La información facilitada no constituye un análisis de inversiones. El material no se ha elaborado de conformidad con los requisitos legales destinados a promover la independencia de los informes de inversiones y, como tal, debe considerarse una comunicación comercial.
Toda la información ha sido preparada por ActivTrades ("AT"). La información no contiene un registro de los precios de AT, o una oferta o solicitud de una transacción en cualquier instrumento financiero. Ninguna representación o garantía se da en cuanto a la exactitud o integridad de esta información.
Cualquier material proporcionado no tiene en cuenta el objetivo específico de inversión y la situación financiera de cualquier persona que pueda recibirlo. La rentabilidad pasada y las estimaciones no sinónimo ni un indicador fiable de la rentabilidad futura. AT presta un servicio exclusivamente de ejecución. En consecuencia, toda persona que actúe sobre la base de la información facilitada lo hace por su cuenta y riesgo. Los tipos de interés pueden cambiar. El riesgo político es impredecible. Las acciones de los bancos centrales pueden variar. Las herramientas de las plataformas no garantizan el éxito.
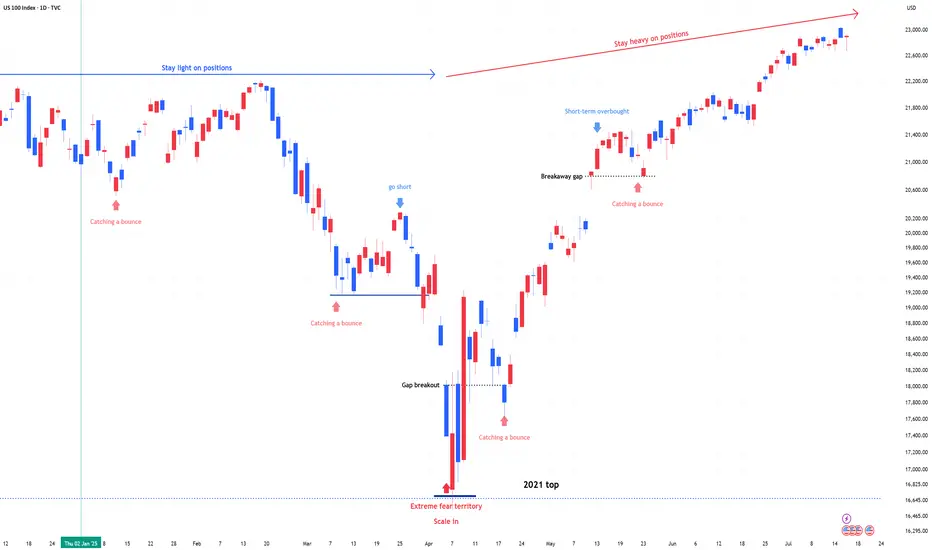
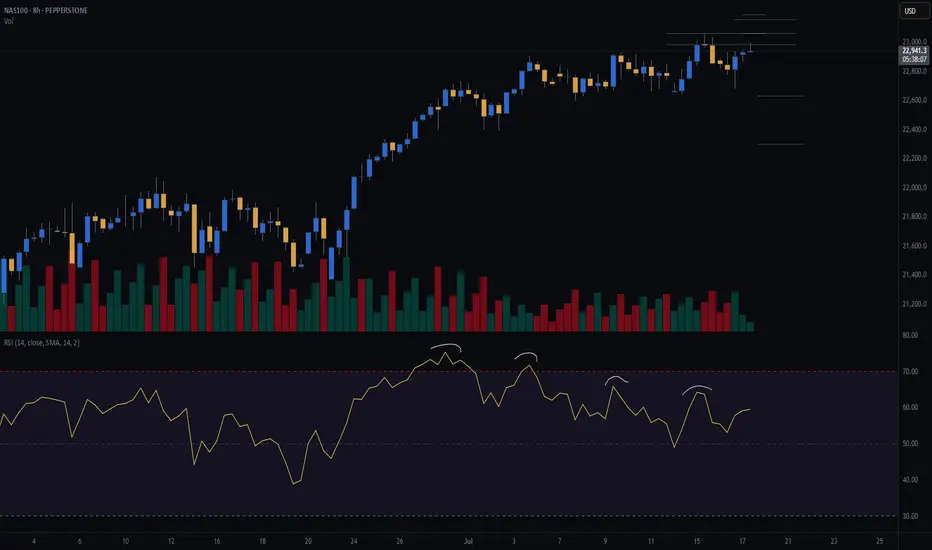
US 100 (NDQ) : Stay Heavy on Positions1) April Fear & Buy Signals
In early April, the Nasdaq 100 experienced a sharp sell-off, triggering extreme fear sentiment across the market.
At that point, scale-in buy signals appeared—classic "buy the fear" conditions.
2) Current Market State: No More Fear, but Watching
Since then, the market has stabilized.
The fear has disappeared, but we are still in a wait-and-see mode as traders assess the next move.
Momentum is holding, but participation remains cautious.
3) Stay Heavy on Positions
Despite short-term uncertainty, I’m maintaining an overweight position on the Nasdaq 100.
As long as we don’t see a major breakdown, the bias remains bullish.
US30"Given the downward trend line formed on the one-hour chart, I expect the price to react in the area I’ve marked in blue and then move downward."

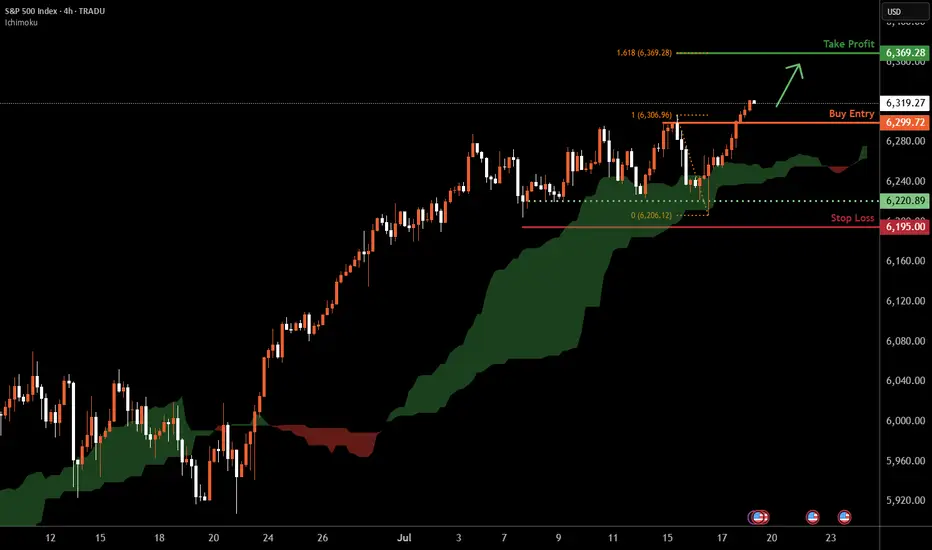
S&P 500 H4 | Making a run towards a new ATH?The S&P 500 (SPX500) is falling towards a pullback support and could potentially bounce off this level to climb higher.
Buy entry is at 6,299.72 which is a pullback support.
Stop loss is at 6,195.00 which is a level that lies underneath a multi-swing-low support.
Take profit is at 6,369.28 which is a resistance that aligns with the 161.8% Fibonacci extension.
High Risk Investment Warning
Trading Forex/CFDs on margin carries a high level of risk and may not be suitable for all investors. Leverage can work against you.
Stratos Markets Limited (tradu.com ):
CFDs are complex instruments and come with a high risk of losing money rapidly due to leverage. 66% of retail investor accounts lose money when trading CFDs with this provider. You should consider whether you understand how CFDs work and whether you can afford to take the high risk of losing your money.
Stratos Europe Ltd (tradu.com ):
CFDs are complex instruments and come with a high risk of losing money rapidly due to leverage. 66% of retail investor accounts lose money when trading CFDs with this provider. You should consider whether you understand how CFDs work and whether you can afford to take the high risk of losing your money.
Stratos Global LLC (tradu.com ):
Losses can exceed deposits.
Please be advised that the information presented on TradingView is provided to Tradu (‘Company’, ‘we’) by a third-party provider (‘TFA Global Pte Ltd’). Please be reminded that you are solely responsible for the trading decisions on your account. There is a very high degree of risk involved in trading. Any information and/or content is intended entirely for research, educational and informational purposes only and does not constitute investment or consultation advice or investment strategy. The information is not tailored to the investment needs of any specific person and therefore does not involve a consideration of any of the investment objectives, financial situation or needs of any viewer that may receive it. Kindly also note that past performance is not a reliable indicator of future results. Actual results may differ materially from those anticipated in forward-looking or past performance statements. We assume no liability as to the accuracy or completeness of any of the information and/or content provided herein and the Company cannot be held responsible for any omission, mistake nor for any loss or damage including without limitation to any loss of profit which may arise from reliance on any information supplied by TFA Global Pte Ltd.
The speaker(s) is neither an employee, agent nor representative of Tradu and is therefore acting independently. The opinions given are their own, constitute general market commentary, and do not constitute the opinion or advice of Tradu or any form of personal or investment advice. Tradu neither endorses nor guarantees offerings of third-party speakers, nor is Tradu responsible for the content, veracity or opinions of third-party speakers, presenters or participants.
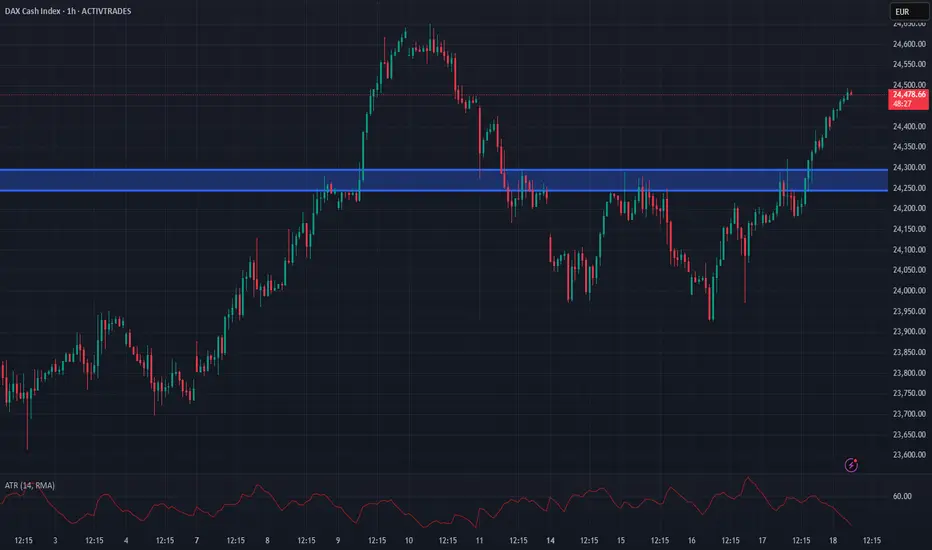
Dax Breaks Higher to keep the bullish toneDax has moved back above the 24245-24295 zone impulsively and we retain the overall bullish tone
Retests of this area can provide an opportunity to get long
Stops need to be below 24170
Targets can be back towards 24400 and even hold a runner back to the All time highs
Dow Eyes 45000 After Bullish BreakoutThe U.S. 30 contract has broken topside from a short-term bull flag, reinforcing the broader uptrend and putting 45000 resistance back in focus.
Traders looking to play a continuation can consider longs with a tight stop beneath for protection. A break of 45000 may trigger a fresh burst of upside momentum, putting big figures above in play.
Bullish price momentum is also building again, adding to the case for upside.
Good luck!
DS

UK100 short - head and shoulders H4Risk/ reward = 4.6
Entry = 8 998.5
Stop loss = 9 034.2
Take profit level 1 = 8 859.8
Take profit level 2 = 8 794
Still need confirmation,
Waiting for H4 candle to close at 23.00 and will need to validate volume.

NAS100 (CASH100) SHORT - Double Top H8Risk/reward = 4.6
Entry price = 23 063
Stop loss price = 23 190
Take profit level 1 (50%) = 22 635
Take profit level 2 (50%) = 22 303
Still waiting for confirmation on some variables.
For example, need H8 candle to close in range and volume to validate, amongst other variables.
5 Proven Tricks to Trade Without FOMO After Missing Your TriggerYo traders! In this video, I’m breaking down what to do if you miss a trading trigger , so you can stay calm , avoid FOMO , and still catch the next move. We’re diving into five solid strategies to re-enter the market without losing your cool:
Buy on the pullback zone.
Buy with an engulfing candle after a pullback.
Buy after breaking the resistance formed by the pullback.
Buy after the second wave with an indecision candle.
Buy after breaking a major resistance post-second wave, confirmed by RSI or momentum oscillators.
These tips are all about keeping your trades smart and your head in the game. For more on indecision candles, check out this lesson . Wanna master breakout trading? Here’s the breakout trading guide . Drop your thoughts in the comments, boost if you vibe with it, and let’s grow together! 😎

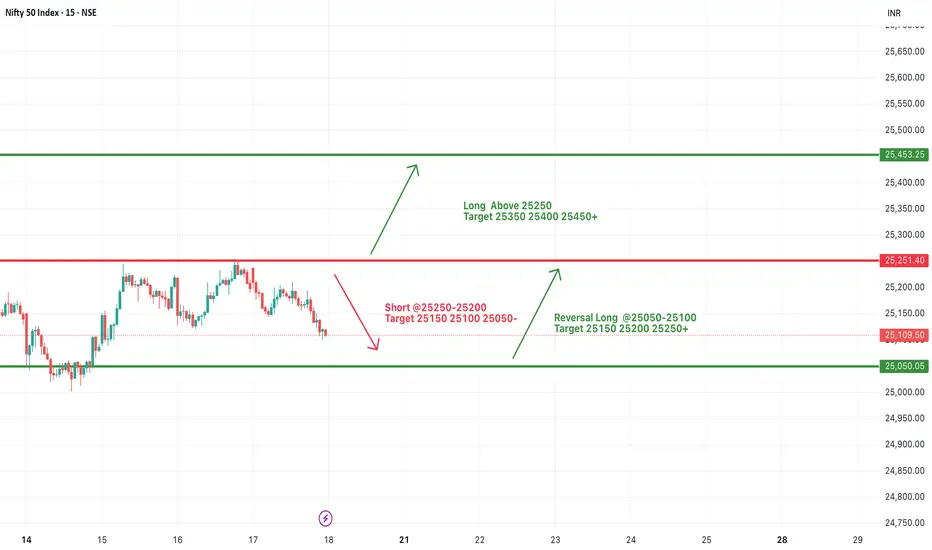
#NIFTY Intraday Support and Resistance Levels - 18/07/2025Nifty is likely to open slightly gap-up today near the 25100–25150 zone. There are no major changes from yesterday’s levels, so the same trading levels remain in focus for today’s session. If Nifty sustains above the 25250 level, we can expect an upside move toward 25350, 25400, and even 25450+ levels. This area remains a crucial resistance zone for potential bullish continuation.
On the downside, if Nifty fails to cross and sustain above 25250 and breaks below the 25200–25250 zone, we may witness a downward move with possible targets at 25150, 25100, and 25050.
A reversal long opportunity may arise in the 25050–25100 support zone if the market finds buying interest after a dip. From this level, we can expect targets around 25150, 25200, and 25250+.
The index is trading in a tight range with no fresh cues. Avoid aggressive entries and stick to level-based trades with strict stop-loss and partial profit booking.
[INTRADAY] #BANKNIFTY PE & CE Levels(18/07/2025)Bank Nifty is expected to open flat around the 56800 zone, suggesting indecision in the early session. If it manages to move upward and sustain above the 57050–57100 resistance range, it could invite bullish momentum targeting 57250, 57350, and even 57450+. A breakout above this level can trigger a continuation of upward movement, but volume and price confirmation are essential.
On the downside, if the index stays weak and slips below the 56950–56900 zone, we may see fresh bearish pressure pulling it toward 56750, 56650, and 56550 support levels. This zone remains a crucial intraday pivot for traders to watch.
A reversal opportunity may also emerge if the index drops further near 56550–56600 and then shows a sharp recovery. In such a case, targets of 56750, 56850, and 56950+ are possible, making it a good support-based bounce trade. Overall, the market might remain sideways with both opportunities for quick scalps and reversals—focus on key levels and act with strict stop losses.

Has the DXY got you confused? Well, check out this analysis.Welcome back, traders, it’s Skeptic from Skeptic Lab! 😎 , the DXY has entered a corrective phase over the past weeks. In this analysis, I’ve broken down the technicals and chart with a skeptical eye, outlined long and short triggers on the 4h timeframe , and tried to give you a solid multi-timeframe view of the setup. At the end, I’ve shared a key educational tip that can seriously boost your win rate and R/R , so make sure you check out the full analysis.
💬If you’ve got a specific symbol in mind for analysis, drop it in the comments. Have a profitable Friday, fam <3

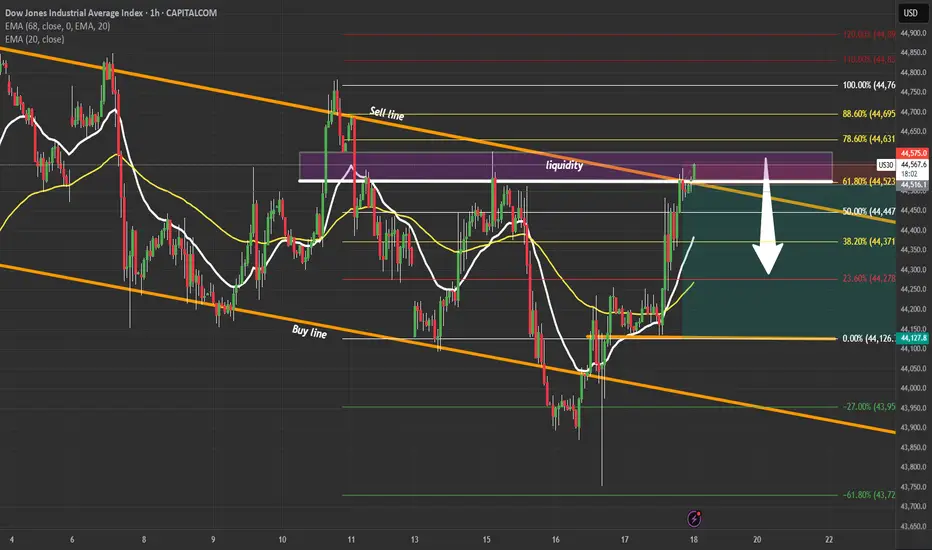
US30 High-Probability Short SetupUS30 | Liquidity Grab at 61.8% Fib 🔍
Price tapped a major liquidity zone inside the descending channel near the 61.8% Fibonacci level.
Plan: Waiting for confirmation to short toward 44,150.
Breakout or rejection? Drop your thoughts below!
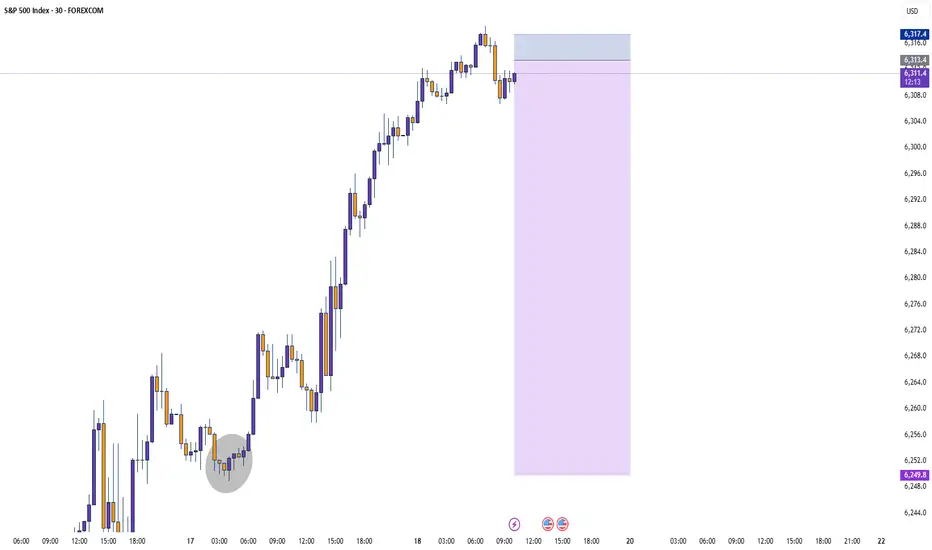
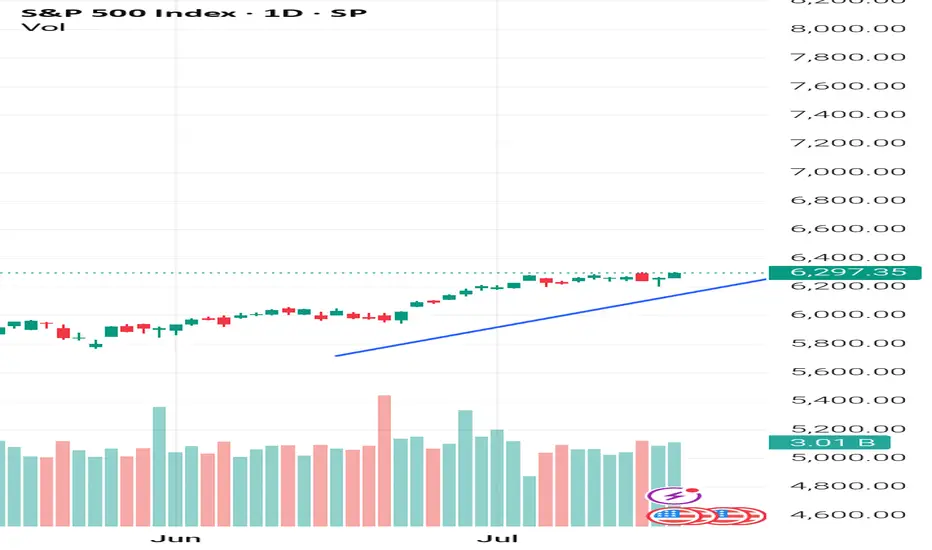
Risk environment to remain positive? S&P continuation?Despite all the recent tariff concerns, inflation concerns and Middle East worries. The S&P continues to push all tine highs. And 'risk surprises' not withstanding, is likely to do so. Backed up by a solid start to ratings season, especially from Netflix.
In the currency space, that should mean the JPY remains weak. And I'm cutoutting recent JPY strength due to profit taking ahead of weekend elections. But moving into the new week, i'll be looking for JPY short opportunities.
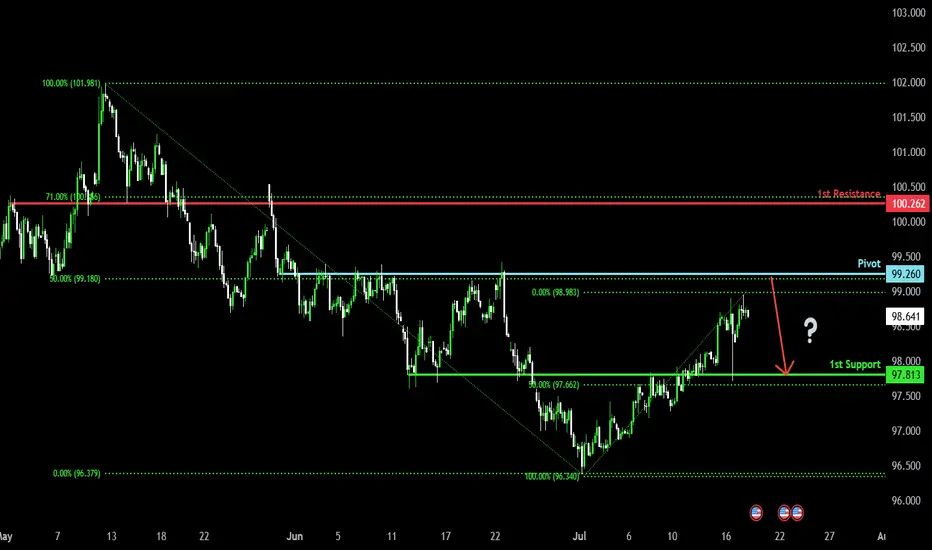
Bearish reversal?US Dollar Index (DXY) is rising towards the pivot and could reverse to the 1st support which acts as an overlap support.
Pivot: 99.26
1st Support: 97.81
1st Resistance: 100.26
Risk Warning:
Trading Forex and CFDs carries a high level of risk to your capital and you should only trade with money you can afford to lose. Trading Forex and CFDs may not be suitable for all investors, so please ensure that you fully understand the risks involved and seek independent advice if necessary.
Disclaimer:
The above opinions given constitute general market commentary, and do not constitute the opinion or advice of IC Markets or any form of personal or investment advice.
Any opinions, news, research, analyses, prices, other information, or links to third-party sites contained on this website are provided on an "as-is" basis, are intended only to be informative, is not an advice nor a recommendation, nor research, or a record of our trading prices, or an offer of, or solicitation for a transaction in any financial instrument and thus should not be treated as such. The information provided does not involve any specific investment objectives, financial situation and needs of any specific person who may receive it. Please be aware, that past performance is not a reliable indicator of future performance and/or results. Past Performance or Forward-looking scenarios based upon the reasonable beliefs of the third-party provider are not a guarantee of future performance. Actual results may differ materially from those anticipated in forward-looking or past performance statements. IC Markets makes no representation or warranty and assumes no liability as to the accuracy or completeness of the information provided, nor any loss arising from any investment based on a recommendation, forecast or any information supplied by any third-party.