Market indices

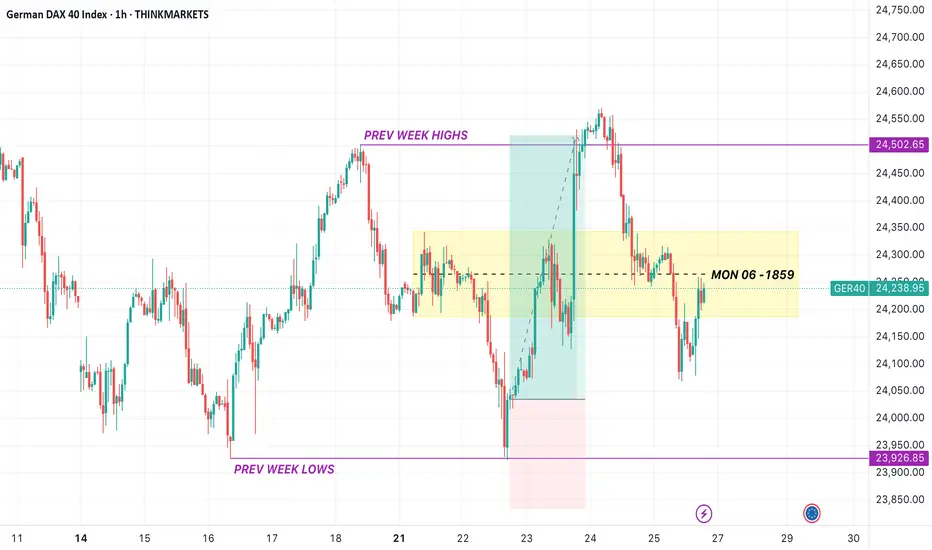
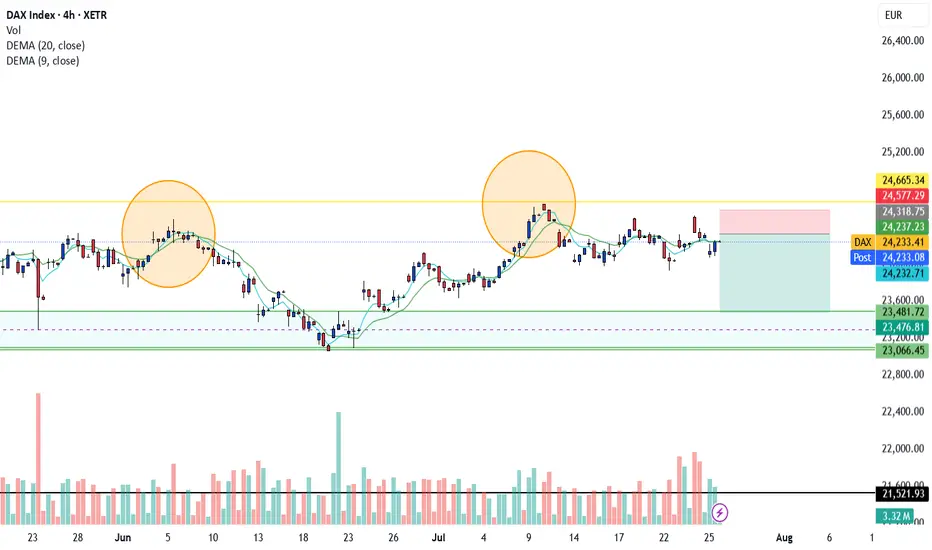
DAX Bearichthe complete set up shoxs that Dax is ranging inside the internal zone , creating a double top on the 4H time frame, witing for the smal trigger to short the position
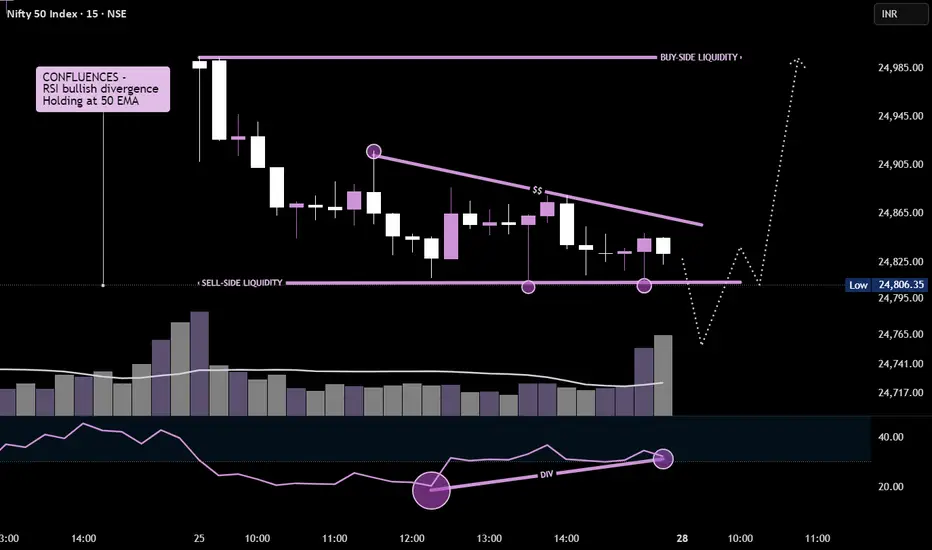
NIFTY50 - 15MIN Potential reversal brewingPrice is forming a falling wedge pattern with clear bullish RSI divergence, signaling potential reversal.
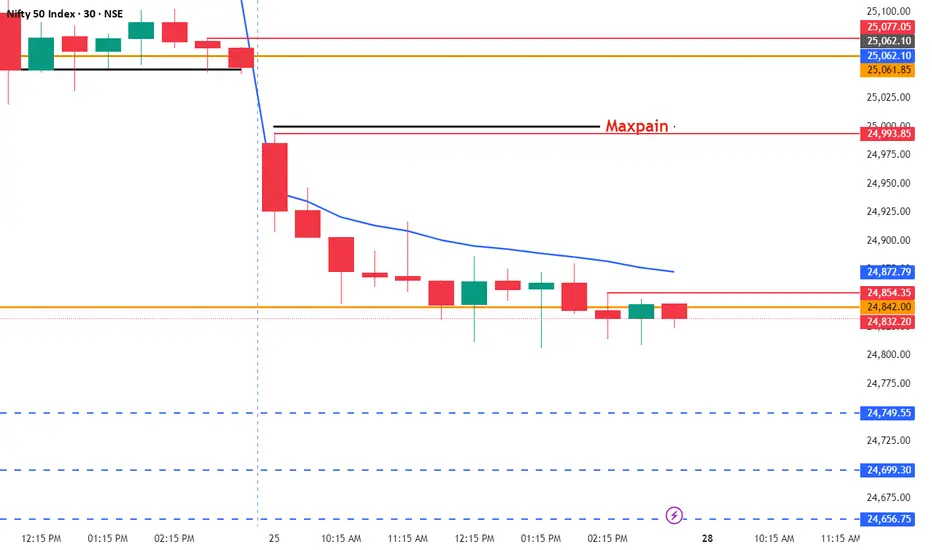
Monday Gap down ProbabilityAs market sentiments are negative where smallcap and midcap tumbles possible gap down after weekend , positive bias after breaking 25062 level till then market showing bearish movement
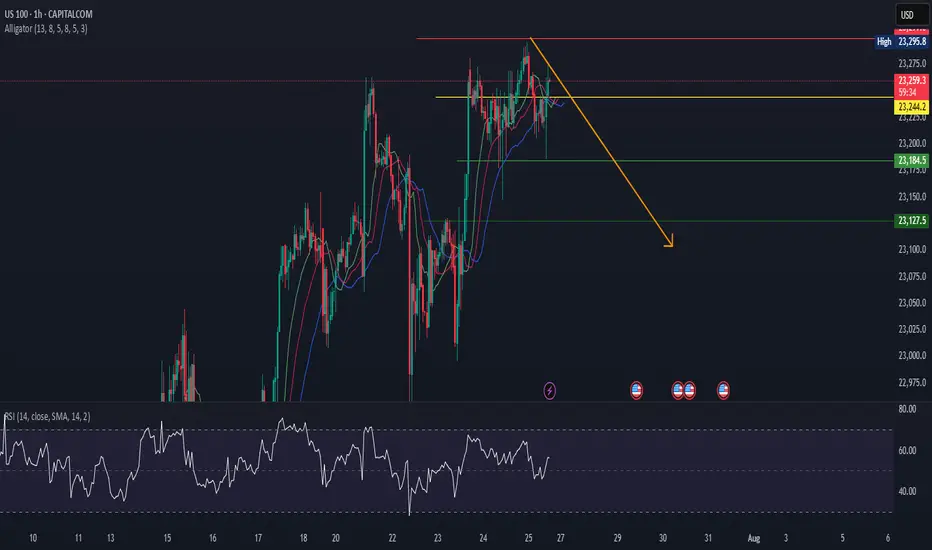
US100Us100 is in reversal MOde.
Big bearish divergence also shown in RSI.
Alligator alos indicates trend will go down from here.
we sell at CMP>
Results from 7/21/25Just like I said -- it played out
WE hit the Daily FVG and then headed up hard.
If you got in buys this week, COMMENT down below
share why and how.

RUT Echoes IWM – The Livermore Playbook?The Russell 2000 (RUT) is painting a structure that mirrors the IWM ETF – a widening accumulation channel, setting up for a potential breakout. The VolanX protocol flags this as a classic Livermore Speculative Chart pattern, where phases of quiet accumulation lead to an explosive markup.
Channel Support: ~2,245 is holding as the battleground for bulls.
Short-Term Projection: Expect a possible ping-pong move between 2,260 – 2,300 before the real momentum ignites.
Breakout Level: Above 2,310, the price could rip toward 2,390–2,400 (Livermore’s “point 10” territory).
VolanX suggests that this structure is not random – IWM and RUT are moving in tandem, with mid-cap risk appetite quietly building. If liquidity inflows continue, this setup could fuel a sharp vertical rally into August.
"Are you seeing the same Livermore-style accumulation in IWM as VolanX does?"
#RUT #IWM #VolanX #Livermore #Accumulation #BreakoutWatch #TradingView

Debt markets at a point of complacency see green arrowsJunk bonds are at a dangerous level now of complacency. I would buy TLT sell HYG

US30: Local Bearish Bias! Short!
My dear friends,
Today we will analyse US30 together☺️
The in-trend continuation seems likely as the current long-term trend appears to be strong, and price is holding below a key level of 44,774.9 So a bearish continuation seems plausible, targeting the next low. We should enter on confirmation, and place a stop-loss beyond the recent swing level.
❤️Sending you lots of Love and Hugs❤️

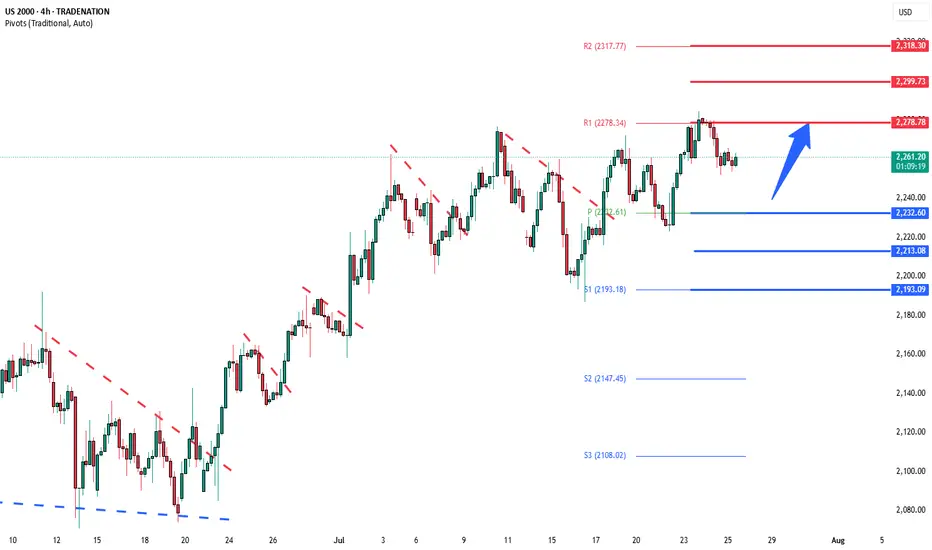
Russell2000 Bullish continuation supported at 2232.60Key Support and Resistance Levels
Resistance Level 1: 2278.80
Resistance Level 2: 2299.70
Resistance Level 3: 2318.30
Support Level 1: 2232.60
Support Level 2: 2213.00
Support Level 3: 2193.00
This communication is for informational purposes only and should not be viewed as any form of recommendation as to a particular course of action or as investment advice. It is not intended as an offer or solicitation for the purchase or sale of any financial instrument or as an official confirmation of any transaction. Opinions, estimates and assumptions expressed herein are made as of the date of this communication and are subject to change without notice. This communication has been prepared based upon information, including market prices, data and other information, believed to be reliable; however, Trade Nation does not warrant its completeness or accuracy. All market prices and market data contained in or attached to this communication are indicative and subject to change without notice.
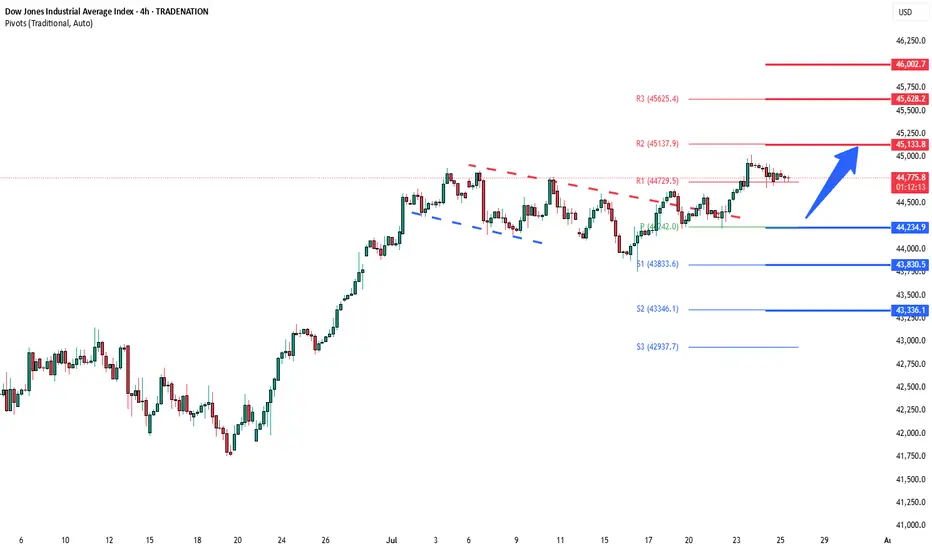
DowJones bullish breakout support at 44240Key Support and Resistance Levels
Resistance Level 1: 45135
Resistance Level 2: 45630
Resistance Level 3: 46000
Support Level 1: 44240
Support Level 2: 43830
Support Level 3: 43340
This communication is for informational purposes only and should not be viewed as any form of recommendation as to a particular course of action or as investment advice. It is not intended as an offer or solicitation for the purchase or sale of any financial instrument or as an official confirmation of any transaction. Opinions, estimates and assumptions expressed herein are made as of the date of this communication and are subject to change without notice. This communication has been prepared based upon information, including market prices, data and other information, believed to be reliable; however, Trade Nation does not warrant its completeness or accuracy. All market prices and market data contained in or attached to this communication are indicative and subject to change without notice.
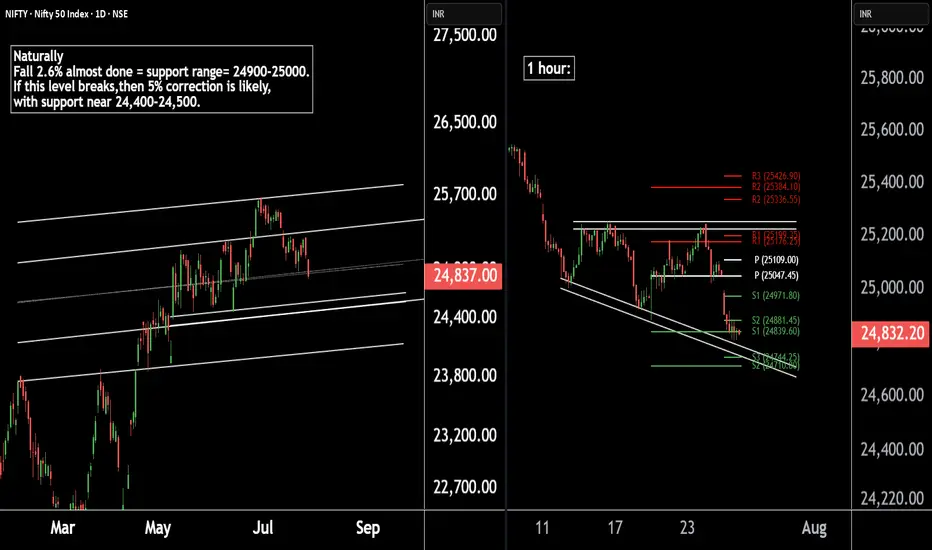
Nifty 50 Update | Technical Levels MappedThere are two chart of Nifty50.
Nifty 50 is trading within a well-defined parallel channel. As part of its natural corrective phase, a potential decline of around 5% cannot be ruled out, with key support anticipated near the 24,400–24,500 zone.
Nifty is forming a broadening wedge pattern on the 1-hour timeframe, with crucial support around 24,740. Additionally, both the weekly and monthly pivot supports are aligned in the 24,740–24,710 zone, reinforcing the significance of this level.
If this level sustain then we may see higher prices in Nifty50.
Thank You !!
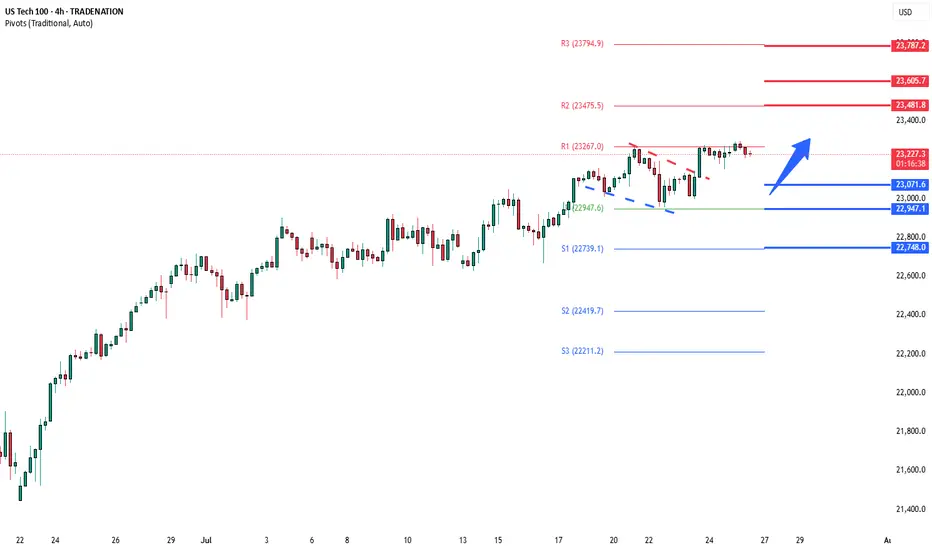
NSDQ100 pushing to new ATH?Thursday was a slightly positive session for equities, with the NASDAQ 100 rising +0.18% to close at a fresh record high, driven by strong economic data. However, overall market action was subdued, with the S&P 500’s trading range the narrowest since February (0.35%).
Notably, the equal-weighted S&P 500 fell -0.33%, highlighting underlying weakness outside mega-cap tech.
A key drag on the NASDAQ came from Tesla (-8.20%), which slumped after disappointing earnings. This weighed on the Magnificent 7, which declined -0.21% despite gains in the other six members.
On the macro front, the US dollar strengthened as Donald Trump downplayed his dispute with Fed Chair Jerome Powell, though continued to pressure the Fed on interest rates. Meanwhile, the FCC approved Paramount’s merger with Skydance, signaling a green light for M&A activity in media despite political tensions.
Conclusion – NASDAQ 100 Trading View:
The NASDAQ 100 remains technically bullish, setting new highs amid resilient economic data. However, breadth is weakening, and headline risk—especially around earnings (e.g., Tesla)—could trigger short-term volatility. Traders should stay long with caution, watching for sector rotation or profit-taking near highs, and monitor Fed-related rhetoric for macro-driven moves.
Key Support and Resistance Levels
Resistance Level 1: 23480
Resistance Level 2: 23600
Resistance Level 3: 23790
Support Level 1: 23070
Support Level 2: 22950
Support Level 3: 22750
This communication is for informational purposes only and should not be viewed as any form of recommendation as to a particular course of action or as investment advice. It is not intended as an offer or solicitation for the purchase or sale of any financial instrument or as an official confirmation of any transaction. Opinions, estimates and assumptions expressed herein are made as of the date of this communication and are subject to change without notice. This communication has been prepared based upon information, including market prices, data and other information, believed to be reliable; however, Trade Nation does not warrant its completeness or accuracy. All market prices and market data contained in or attached to this communication are indicative and subject to change without notice.
SellRejection Level
Daily Volume
Market Structure Shift
London US Session
Trend Line Break
Untapped Order Point
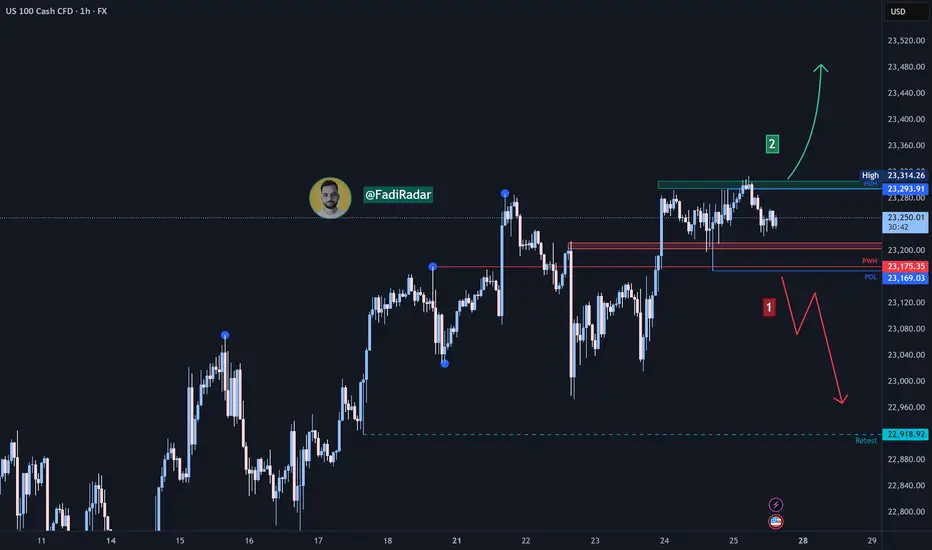
Nasdaq Index (US100 / NASDAQ) Technical Analysis:The Nasdaq index continues its medium- to long-term uptrend. Yesterday, it tested the 23,170$ level and rebounded upward, reaching 23,310$.
🔹 Bearish Scenario:
If the price breaks and closes below 23,200$, it may decline toward 23,000$, followed by 22,920$.
🔹 Bullish Scenario:
If the price holds above 23,300$, the uptrend is likely to continue toward a new high near 23,400$.
⚠️ Disclaimer:
This analysis is for educational purposes only and does not constitute financial advice. Always monitor the markets and perform your own analysis before making any trading decisions.
dxy buy tradeThe Relative Strength Index (RSI) is showing an upward trend, indicating increasing momentum. Additionally, the Moving Average Convergence Divergence (MACD) is showing a bullish crossover, further supporting the potential for an upward move

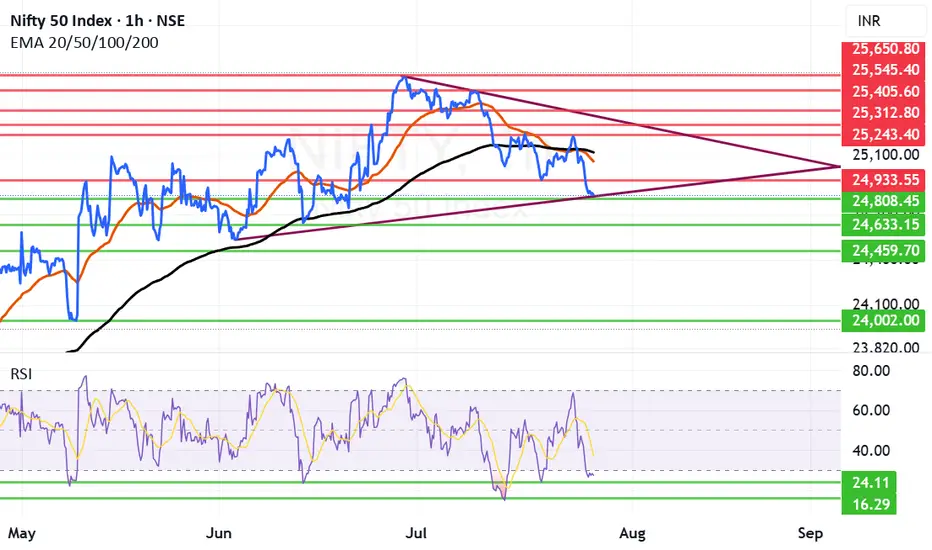
Nifty Next Week: Can Nifty make a comeback after drubbing?Nifty received proper drubbing after falling below critical supports of Mother and Father line. Trump's warning signals for IT companies and the continuing deadlock in Trade deal with US weighing on Indian markets. Additionally the earning season also giving many disappointing and few good result has broken the back of the Bull rally and now Nifty is reeling under 25K levels.
Only silver line in the cloud seems to be that RSI is below 30. Currently RSI is at 27.52. Usually RSI has found support near 24 if not 24 it might bounce back from 16. So hopefully we can see some short covering in the beginning or middle of next week. Also next week the decision for Tariffs should come. If the result will be in favour of India we might see a strong come back as lot of sectors / Large cap stocks currently are looking oversold.
The Supports for Nifty Remain at: 24808 (Strong support), 24633, 24459 Below 24459 the index will be in firm grip of Bears who might try to drag Nifty towards 24K levels or even below that in unlikely circumstances.
The Resistances for Nifty Remain at: 24933, 25058 (Mother Line Resistance of Daily Chart), 25119 (Father Line Resistance) and 25243. After we get a closing above 25243 the Bulls can gain some momentum.
Disclaimer: The above information is provided for educational purpose, analysis and paper trading only. Please don't treat this as a buy or sell recommendation for the stock or index. The Techno-Funda analysis is based on data that is more than 3 months old. Supports and Resistances are determined by historic past peaks and Valley in the chart. Many other indicators and patterns like EMA, RSI, MACD, Volumes, Fibonacci, parallel channel etc. use historic data which is 3 months or older cyclical points. There is no guarantee they will work in future as markets are highly volatile and swings in prices are also due to macro and micro factors based on actions taken by the company as well as region and global events. Equity investment is subject to risks. I or my clients or family members might have positions in the stocks that we mention in our educational posts. We will not be responsible for any Profit or loss that may occur due to any financial decision taken based on any data provided in this message. Do consult your investment advisor before taking any financial decisions. Stop losses should be an important part of any investment in equity.
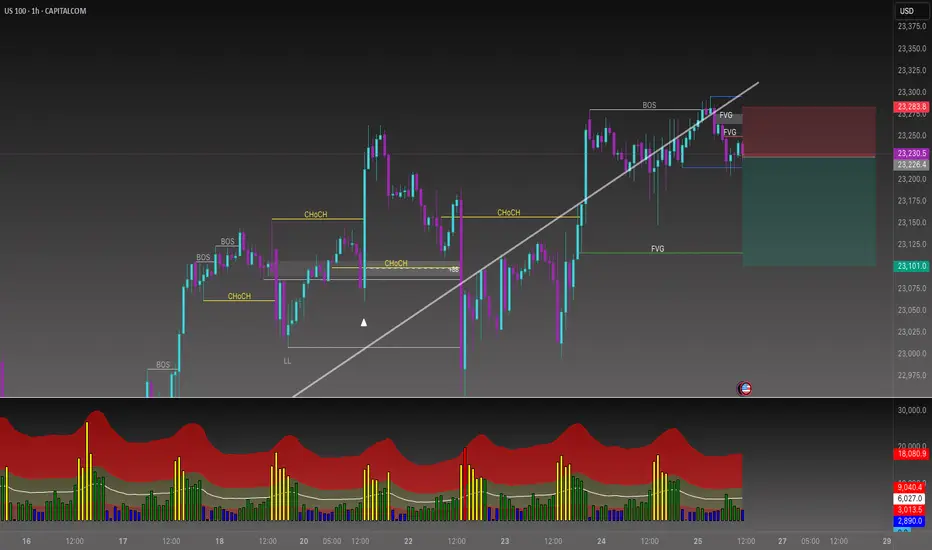
Do you want to keep buying NAS100?📉 Sell-Side Bias Activated
After PEPPERSTONE:NAS100 confirming the trend shift with a clean Break of Structure (BOS) and a strong rejection from the FVG (Fair Value Gap) zone, price failed to hold above 23,275.
This move validated the liquidity sweep and imbalance fill. Multiple FVGs stacked above suggest premium pricing and further downside potential.
🧠 I’m now watching for continuation setups toward discount zone. Especially below 23,100 and possibly targeting the lower FVG region.
This is a classic smart money play, manipulation, BOS, FVG retest, and selloff.
🔻Bias: Bearish
🎯 Target: Liquidity pools below 23,100
🛑 Invalidated above 23,280 (structure reclaim)
Trendline BreakThe price has broken a bullish trendline followed by a pullback and now the price looks to go short
WE ONLY TRADE PULLBACKS

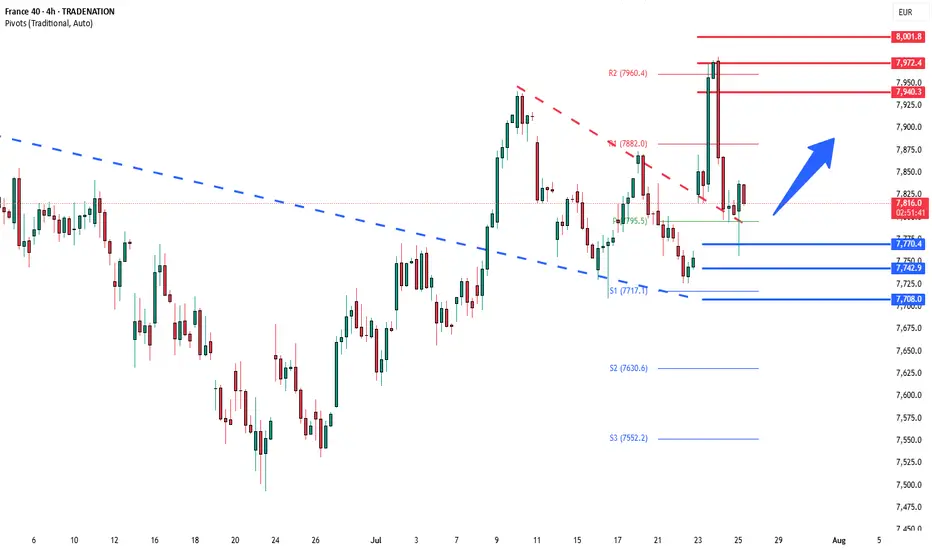
CAC breakout retest support at 7770The CAC 40 index continues to display a bullish bias, underpinned by a well-established rising trend. Recent intraday price action indicates a breakout from consolidation, suggesting renewed upward momentum.
Key Technical Levels:
Support:
7770 – This level marks the prior consolidation zone and now serves as critical support.
7740 – Secondary support, guarding against deeper downside.
7700 – Key psychological and technical level; a breach would suggest trend weakness.
Resistance:
7940 – Immediate upside target from the breakout pattern.
7970 – Minor resistance within an extended bullish leg.
8000 – Major psychological resistance and potential profit-taking zone.
Trading Scenarios:
Bullish Scenario:
A corrective pullback toward the 7770 level, followed by a bullish reversal, would confirm support and potentially set the stage for an advance toward 7940, with scope to extend to 7970 and 8000 in the medium term.
Bearish Scenario:
A daily close below 7770 would invalidate the bullish breakout and suggest a short-term trend reversal. This would open the door to a retracement toward 7740, with extended downside risk to 7700.
Conclusion:
The CAC 40 remains technically bullish as long as price holds above the 7770 support level. Traders should watch for confirmation of support on pullbacks to position for a continuation higher. A decisive break below 7770, however, would shift sentiment to neutral-to-bearish, triggering a deeper correction.
FTSE rally resistance at 9150The FTSE remains in a bullish trend, with recent price action showing signs of a corrective pullback within the broader uptrend.
Support Zone: 9045 – a key level from previous consolidation. Price is currently testing or approaching this level.
A bullish rebound from 9045 would confirm ongoing upside momentum, with potential targets at:
9150 – initial resistance
9172 – psychological and structural level
9200 – extended resistance on the longer-term chart
Bearish Scenario:
A confirmed break and daily close below 9150 would weaken the bullish outlook and suggest deeper downside risk toward:
9018 – minor support
8980 – stronger support and potential demand zone
Outlook:
Bullish bias remains intact while the FTSE holds above 9150. A sustained break below this level could shift momentum to the downside in the short term.
This communication is for informational purposes only and should not be viewed as any form of recommendation as to a particular course of action or as investment advice. It is not intended as an offer or solicitation for the purchase or sale of any financial instrument or as an official confirmation of any transaction. Opinions, estimates and assumptions expressed herein are made as of the date of this communication and are subject to change without notice. This communication has been prepared based upon information, including market prices, data and other information, believed to be reliable; however, Trade Nation does not warrant its completeness or accuracy. All market prices and market data contained in or attached to this communication are indicative and subject to change without notice.

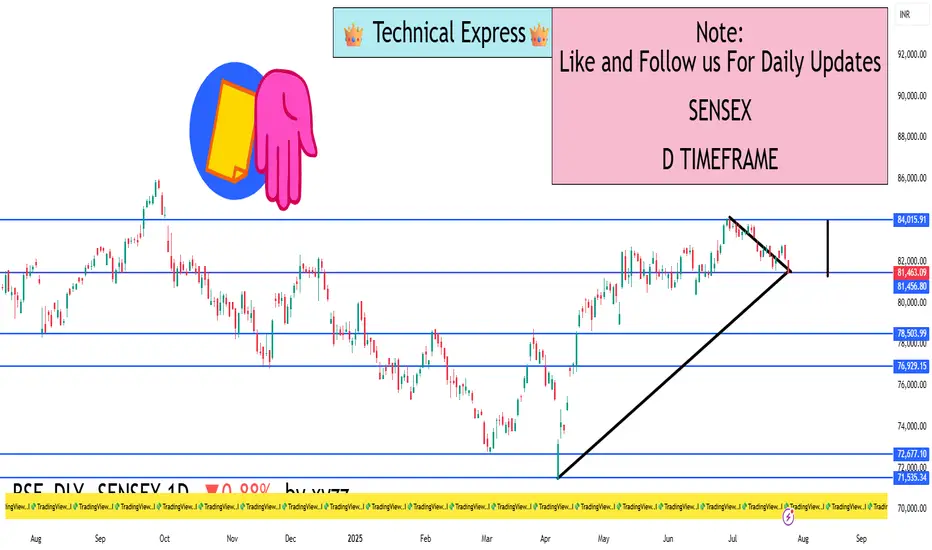
SENSEX 1D Timeframe📉 SENSEX Daily Overview (as of July 25, 2025)
Current Price: Around 81,460
Daily Change: Down by approximately 720 points (–0.9%)
Day’s High: About 82,070
Day’s Low: About 81,400
Previous Close: Around 82,184
📊 1-Day Candlestick Analysis
The candle for today is bearish, indicating strong selling pressure.
The price opened near previous levels but faced resistance at around 82,000.
Sellers dominated most of the day, pushing the index toward the 81,400 support zone.
🔍 Key Support and Resistance Levels
Level Type Price Range
Resistance 82,000 – 82,200
Support 81,400 – 81,000
If Sensex breaks below 81,400, the next target could be around 80,500 or 79,900.
If it holds above support and bounces, it could retest 82,200.
🧠 Technical Trend Analysis
Short-Term Trend: Bearish
Medium-Term Trend: Neutral to mildly bullish (as long as above 80,000)
Market Structure: Lower highs forming, suggesting pressure building on bulls
Indicators (assumed):
RSI may be approaching oversold
MACD likely showing bearish crossover
Volume increasing on red candles—indicating strong sell interest
📌 Sentiment & Market Context
Financial stocks (like banking, NBFCs) are under pressure.
Global cues (such as interest rate uncertainty and geopolitical concerns) are impacting investor confidence.
FII outflows and weak earnings in key sectors are adding to bearish momentum.
The broader trend remains range-bound, but with short-term downside bias.
✅ Strategy Suggestions (For Traders & Investors)
Swing Traders: Wait for a reversal candle (like a bullish engulfing or hammer) before considering long positions.
Breakout Traders: Watch for breakdown below 81,000 for continuation of the fall.
Positional Traders: Can wait to enter near 80,000–79,500 if the market holds that key level.
🔄 Summary
SENSEX is under pressure with a drop of 720+ points.
Technical structure suggests caution, especially if 81,000 breaks.
Support: 81,000 – 80,500
Resistance: 82,000 – 82,200