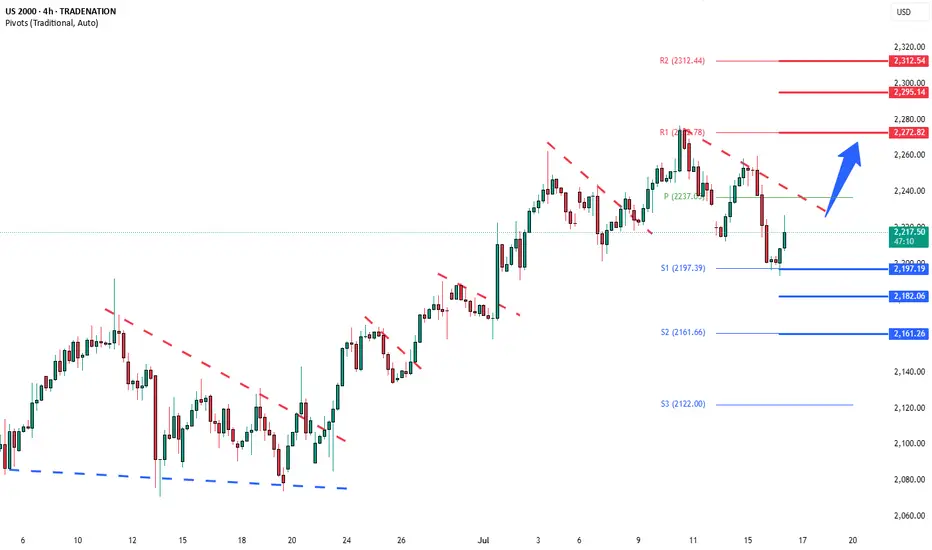
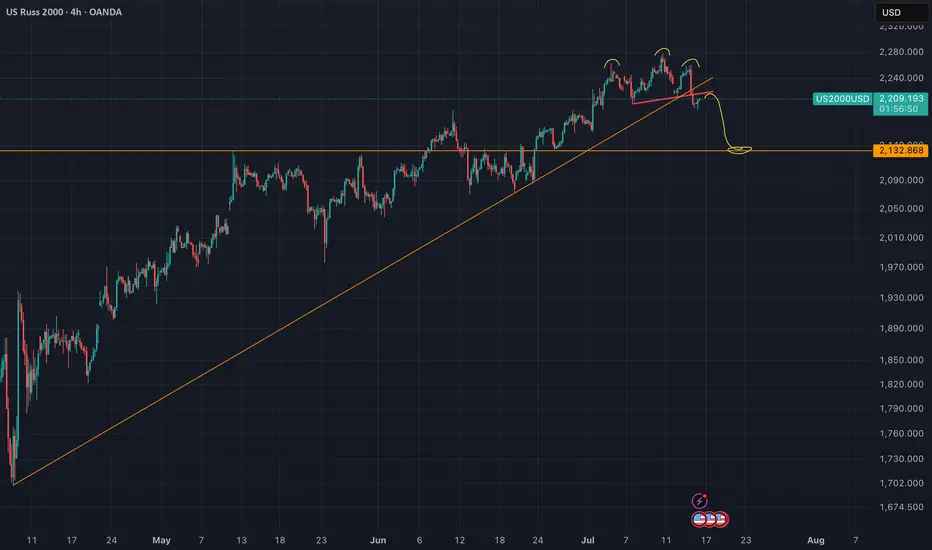
Russell2000 corrective pullback supported at 2197Key Support and Resistance Levels
Resistance Level 1: 2270
Resistance Level 2: 2295
Resistance Level 3: 2313
Support Level 1: 2197
Support Level 2: 2180
Support Level 3: 2160
This communication is for informational purposes only and should not be viewed as any form of recommendation as to a particular course of action or as investment advice. It is not intended as an offer or solicitation for the purchase or sale of any financial instrument or as an official confirmation of any transaction. Opinions, estimates and assumptions expressed herein are made as of the date of this communication and are subject to change without notice. This communication has been prepared based upon information, including market prices, data and other information, believed to be reliable; however, Trade Nation does not warrant its completeness or accuracy. All market prices and market data contained in or attached to this communication are indicative and subject to change without notice.
Market indices
Trade, Fed, and Policy Developments Impacting NASDAQ 100Tariff Expansion Threat:
Donald Trump signaled upcoming tariffs on pharmaceuticals and semiconductors, two sectors heavily represented in the NASDAQ 100. These measures could:
Raise consumer costs.
Disrupt tech and healthcare supply chains.
Add margin pressure on multinational firms.
Corporate Impact:
Rio Tinto revealed $300M in losses from US aluminum tariffs on Canadian output.
Canada-US trade talks will intensify, but tariffs appear likely to remain, adding to cost overhang for manufacturers and downstream users.
Fed Leadership Uncertainty:
Kevin Hassett is emerging as the frontrunner to replace Fed Chair Jerome Powell in 2026.
Trump is critical of Powell, even citing Fed building renovation costs as a potential fireable offense.
This adds uncertainty to monetary policy continuity, especially as inflation rises and rate path expectations diverge.
401(k) and Private Equity Access:
The administration is finalizing an executive order allowing 401(k) plans to invest in private equity, a move that could:
Increase alternative asset exposure.
Boost private market valuations.
Signal a policy tilt toward financial market liberalization, which may help sustain risk sentiment in the medium term.
Conclusion for NASDAQ 100 (NSDQ100) Trading
The near-term risk for NASDAQ 100 is tilted negative due to the tariff threats on semiconductors and pharma, both major index components.
Fed leadership uncertainty could inject volatility into rate expectations, pressuring tech valuations sensitive to discount rate changes.
However, the longer-term policy shift toward broader 401(k) access to private markets could support overall market sentiment and capital flows.
Bias: Cautiously Bearish in the short term due to trade and Fed risks; neutral to slightly bullish medium term if private capital access reforms proceed and trade escalation is contained.
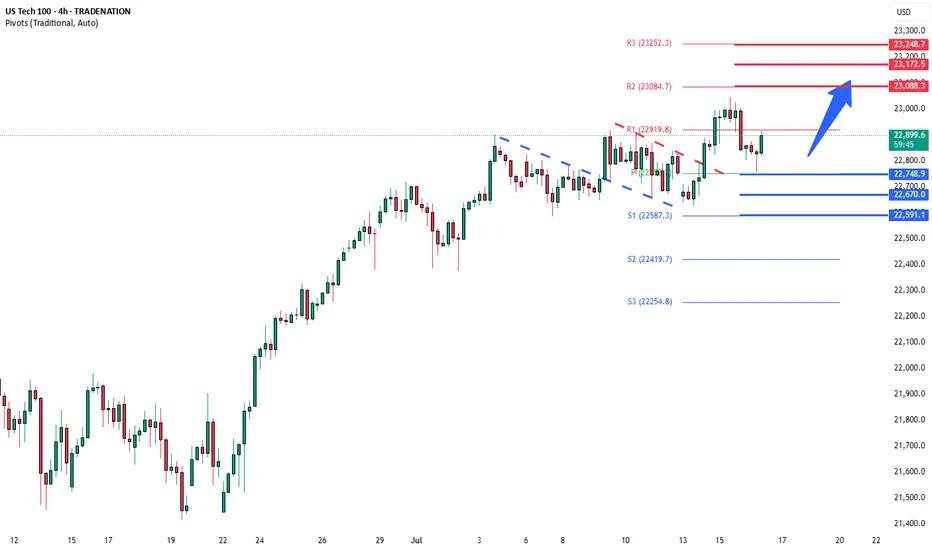
Key Support and Resistance Levels
Resistance Level 1: 23080
Resistance Level 2: 23170
Resistance Level 3: 23250
Support Level 1: 22750
Support Level 2: 22670
Support Level 3: 22590
This communication is for informational purposes only and should not be viewed as any form of recommendation as to a particular course of action or as investment advice. It is not intended as an offer or solicitation for the purchase or sale of any financial instrument or as an official confirmation of any transaction. Opinions, estimates and assumptions expressed herein are made as of the date of this communication and are subject to change without notice. This communication has been prepared based upon information, including market prices, data and other information, believed to be reliable; however, Trade Nation does not warrant its completeness or accuracy. All market prices and market data contained in or attached to this communication are indicative and subject to change without notice.
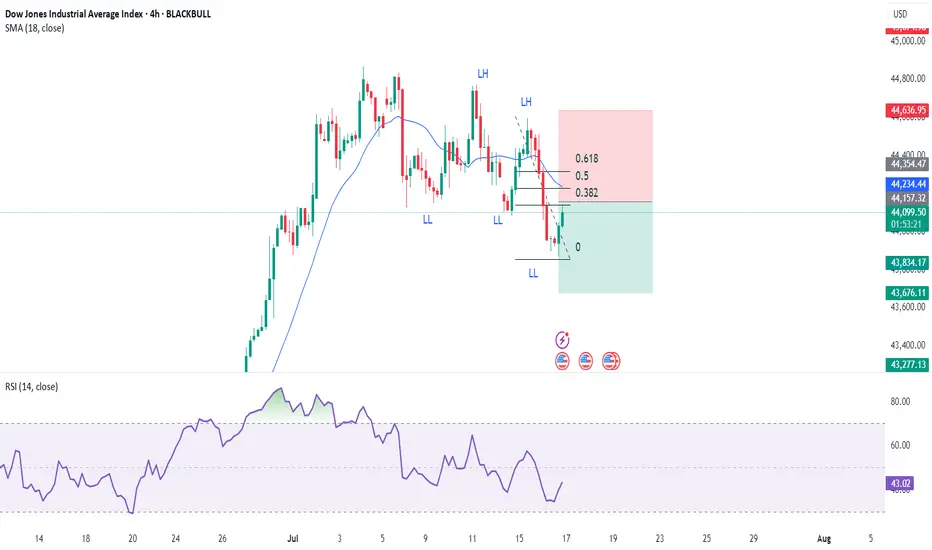
Dow Short IdeaDow jones has started making LL's so it is effectively in a downward trend on 4Hr chart so shorting on pullback to key Fib Retracement levels would be a good idea.
US2000 - Head And Shoulders (Top signal)Reversal in play. The neckline of the H&S got validated yesterday.
Nothing here should be interpreted as financial advise. Always do your own research and decisions.
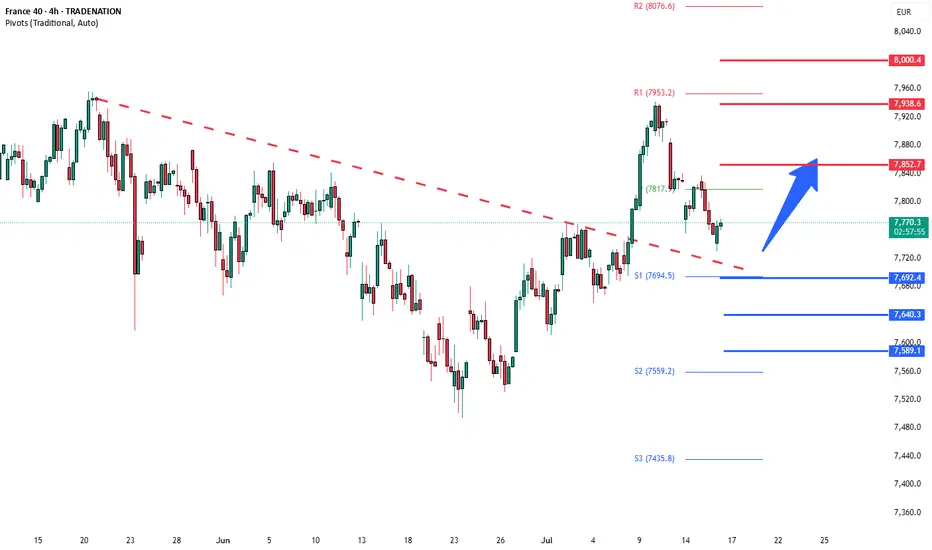
CAC40 Bullish breakout retest support at 7690The CAC40 remains in a bullish trend, with recent price action showing signs of a corrective pullback within the broader uptrend.
Support Zone: 7960 – a key level from previous consolidation. Price is currently testing or approaching this level.
A bullish rebound from 7690 would confirm ongoing upside momentum, with potential targets at:
7850 – initial resistance
7940 – psychological and structural level
8000 – extended resistance on the longer-term chart
Bearish Scenario:
A confirmed break and daily close below 7690 would weaken the bullish outlook and suggest deeper downside risk toward:
7640 – minor support
7590 – stronger support and potential demand zone
Outlook:
Bullish bias remains intact while the CAC40 holds above 7690. A sustained break below this level could shift momentum to the downside in the short term.
This communication is for informational purposes only and should not be viewed as any form of recommendation as to a particular course of action or as investment advice. It is not intended as an offer or solicitation for the purchase or sale of any financial instrument or as an official confirmation of any transaction. Opinions, estimates and assumptions expressed herein are made as of the date of this communication and are subject to change without notice. This communication has been prepared based upon information, including market prices, data and other information, believed to be reliable; however, Trade Nation does not warrant its completeness or accuracy. All market prices and market data contained in or attached to this communication are indicative and subject to change without notice.
Market Mood Sours as Inflation Surprises AgainU.S. stock markets were under pressure on Tuesday after new inflation data came in higher than expected. This has made investors rethink how soon the Federal Reserve might cut interest rates.
What Happened?
● The Consumer Price Index (CPI) recorded its biggest monthly rise in 5 months.
● Core inflation (which excludes food and energy) jumped by 2.9% compared to last year — more than the Fed's 2% target.
What It Means
● Investors had expected the Fed to cut interest rates multiple times in 2025.
● After the inflation report, they now think the Fed will cut less than expected.
● The chances of a rate cut in September also dropped sharply.
Market Impact
● Bond yields went up — the 10-year U.S. government bond yield rose to 4.49%, making borrowing more expensive.
● Stock futures fell (Dow, S&P 500, Nasdaq), as higher yields tend to hurt company profits and stock prices.
S&P 500 and Dow Struggle at Resistance
● Both the S&P 500 and Dow Jones faced resistance near all-time highs.
● This rejection suggests potential for further short-term pullback, especially if macro pressures like inflation and rate uncertainty persist.
Near-Term Outlook
With inflation running hotter than expected, hopes for early Fed rate cuts have cooled. Traders and investors should remain cautious, manage risk actively, and prepare for continued volatility in the coming weeks.

USNAS100 – Bearish Below 22900 as Earnings & Tariffs Hit MarketUSNAS100 – Bearish Bias Ahead of Earnings, PPI & Tariff Tensions
S&P 500 and Nasdaq futures are slightly lower as traders weigh rate outlook, tariff developments, and major earnings reports.
📊 Earnings in Focus:
Goldman Sachs NYSE:GS , Morgan Stanley NYSE:MS , and Bank of America NYSE:BAC are set to report today.
JPMorgan Chase NYSE:JPM and Citigroup NYSE:C posted strong results yesterday, but expressed caution over U.S. tariff policies.
🌍 Tariff Watch:
Trump announced a 19% tariff on Indonesian goods, with more deals anticipated ahead of the August 1 tariff deadline. The EU is reportedly preparing retaliatory measures if negotiations stall.
🔧 Technical Outlook:
The Nasdaq100 shows bearish momentum as long as it trades below 22900 and 23010, with potential downside targets:
Support: 22720 → 22615 → 22420
Resistance: 23010 → 23170
To shift back to a bullish trend, price must stabilize above 22900 and break 23010.
Key Events Today:
• Corporate Earnings
• Tariff Developments
• U.S. PPI Report

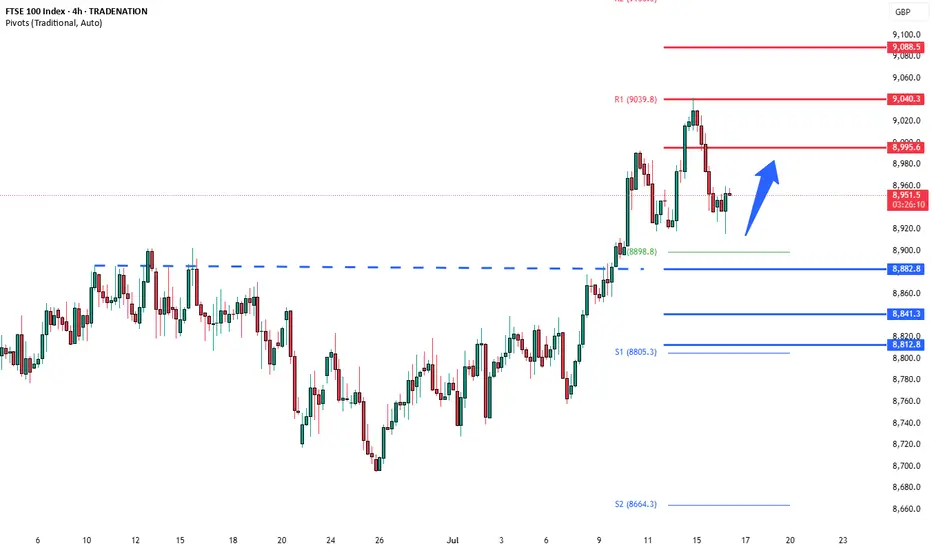
FTSE100 overbought pullback supported at 8880The FTSE remains in a bullish trend, with recent price action showing signs of a corrective pullback within the broader uptrend.
Support Zone: 8880 – a key level from previous consolidation. Price is currently testing or approaching this level.
A bullish rebound from 8880 would confirm ongoing upside momentum, with potential targets at:
8900 – initial resistance
9040 – psychological and structural level
9090 – extended resistance on the longer-term chart
Bearish Scenario:
A confirmed break and daily close below 8880 would weaken the bullish outlook and suggest deeper downside risk toward:
8840 – minor support
8820 – stronger support and potential demand zone
Outlook:
Bullish bias remains intact while the FTSE holds above 8880. A sustained break below this level could shift momentum to the downside in the short term.
This communication is for informational purposes only and should not be viewed as any form of recommendation as to a particular course of action or as investment advice. It is not intended as an offer or solicitation for the purchase or sale of any financial instrument or as an official confirmation of any transaction. Opinions, estimates and assumptions expressed herein are made as of the date of this communication and are subject to change without notice. This communication has been prepared based upon information, including market prices, data and other information, believed to be reliable; however, Trade Nation does not warrant its completeness or accuracy. All market prices and market data contained in or attached to this communication are indicative and subject to change without notice.
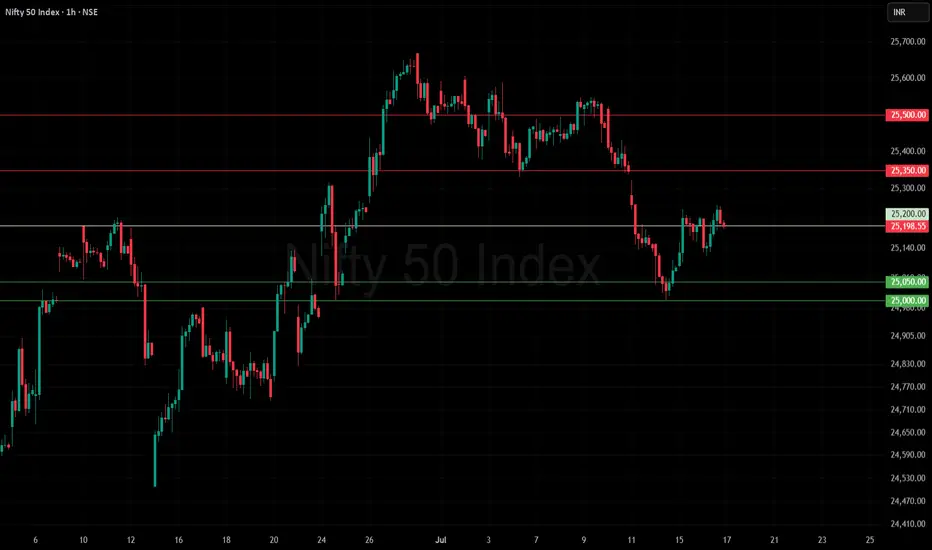
Nifty updateNifty Update (16 July 2025) 📈
Nifty is range bounded after a rebound from the support zone of 25,000–25,050 and closed positively ✅
It crossed above the initial target of 25,200 and approached the resistance zone near 25,350
🔹 Support: 25,000–25,050 (key for dip-buying opportunities)
🔹 Resistance: 25,350 (next immediate hurdle)
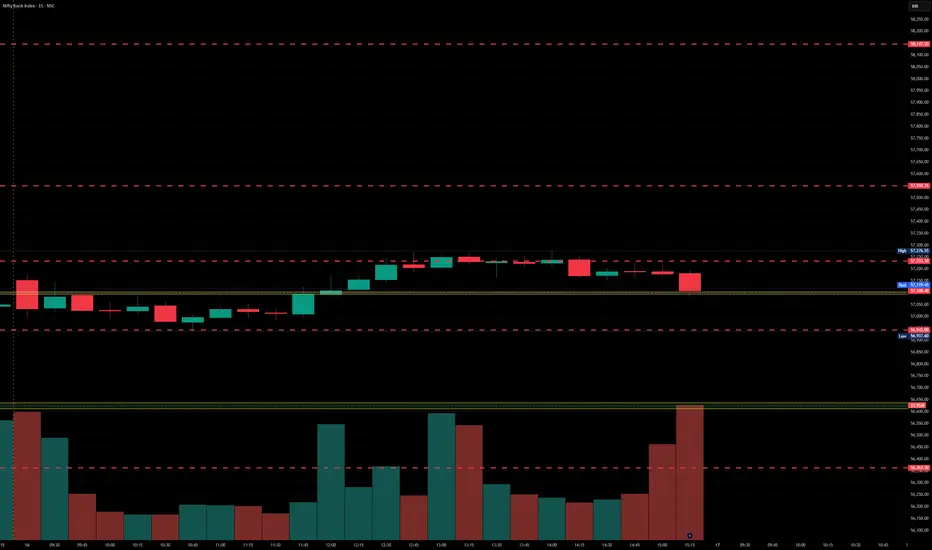
BankNifty levels - Jul 17, 2025Utilizing the support and resistance levels of BankNifty, along with the 5-minute timeframe candlesticks and VWAP, can enhance the precision of trade entries and exits on or near these levels. It is crucial to recognize that these levels are not static, and they undergo alterations as market dynamics evolve.
The dashed lines on the chart indicate the reaction levels, serving as additional points of significance. Furthermore, take note of the response at the levels of the High, Low, and Close values from the day prior.
We trust that this information proves valuable to you.
* If you found the idea appealing, kindly tap the Boost icon located below the chart. We encourage you to share your thoughts and comments regarding it.
Wishing you successful trading endeavors!
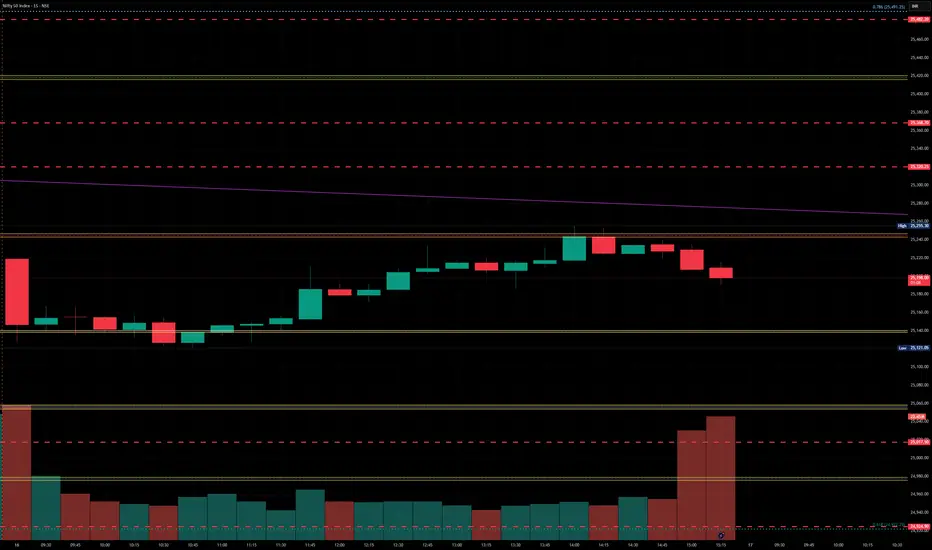
Nifty levels - Jul 17, 2025Nifty support and resistance levels are valuable tools for making informed trading decisions, specifically when combined with the analysis of 5-minute timeframe candlesticks and VWAP. By closely monitoring these levels and observing the price movements within this timeframe, traders can enhance the accuracy of their entry and exit points. It is important to bear in mind that support and resistance levels are not fixed, and they can change over time as market conditions evolve.
The dashed lines on the chart indicate the reaction levels, serving as additional points of significance to consider. Furthermore, take note of the response at the levels of the High, Low, and Close values from the day prior.
We hope you find this information beneficial in your trading endeavors.
* If you found the idea appealing, kindly tap the Boost icon located below the chart. We encourage you to share your thoughts and comments regarding it.
Wishing you success in your trading activities!
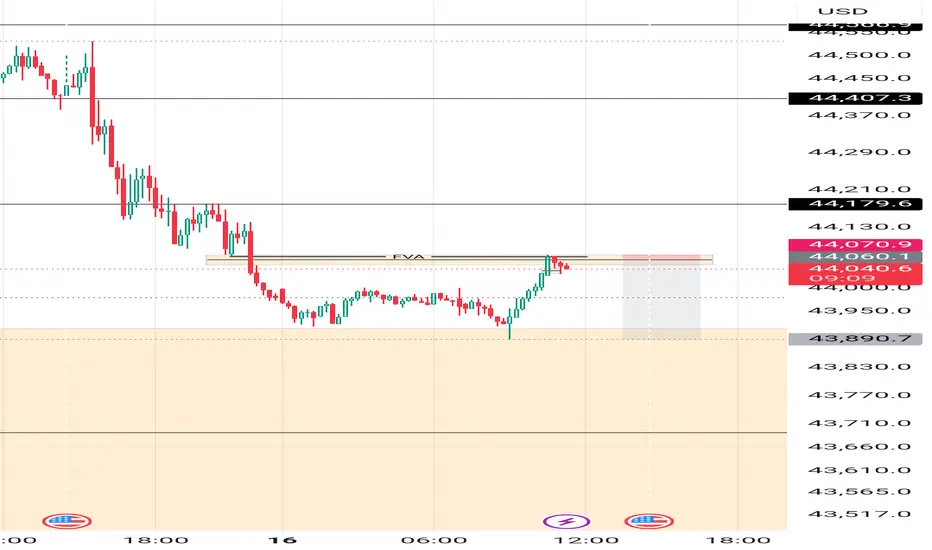
US30 – Bearish Outlook Below 44,500 as CPI Looms US30 – Bearish Outlook Below 44,500 as CPI Looms
US30 rallied and successfully reached our resistance target, as expected in the previous analysis.
However, with today’s CPI release, the market is likely to see increased volatility. As long as the index trades below 44,500–44,570, the bias remains bearish, with downside targets at 44,210 and 43,960.
• If CPI prints below 2.6%, we may see a bullish breakout toward 45,100
• Above or equal to 2.6% supports continuation of the bearish move
However, we expect a 2.7% reading, driven by tariff-related price increases, which would support the bearish scenario.


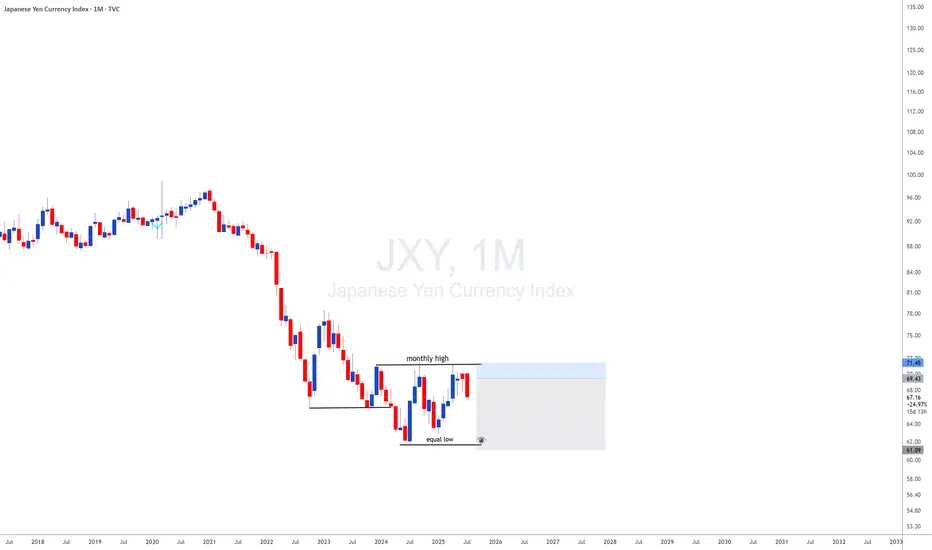
JXY with JXY looking monthly downside and DXY looing upside i will be looking for 35 years breakout of usdjpy meanning uj is a long therm upside
How to View the Assets in Japan
It should be noted that many of the assets the government owns are not marketable, or, if so, their
price can sharply drop in the case of fiscal crisis. Therefore, the financial situation should be assessed
first by gross debt.
In addition, the assets earmarked with the liabilities (such as pension reserves and FILP loans) are
not directly related to fiscal consolidation because they are not included in “Bonds outstanding of
central and local governments”, which is the benchmark of fiscal consolidation target
us30 to break down us30 to break down
bears to take control - as shown in zigzag manne
swing low broken
volumes drying up
stoploss will be swing high

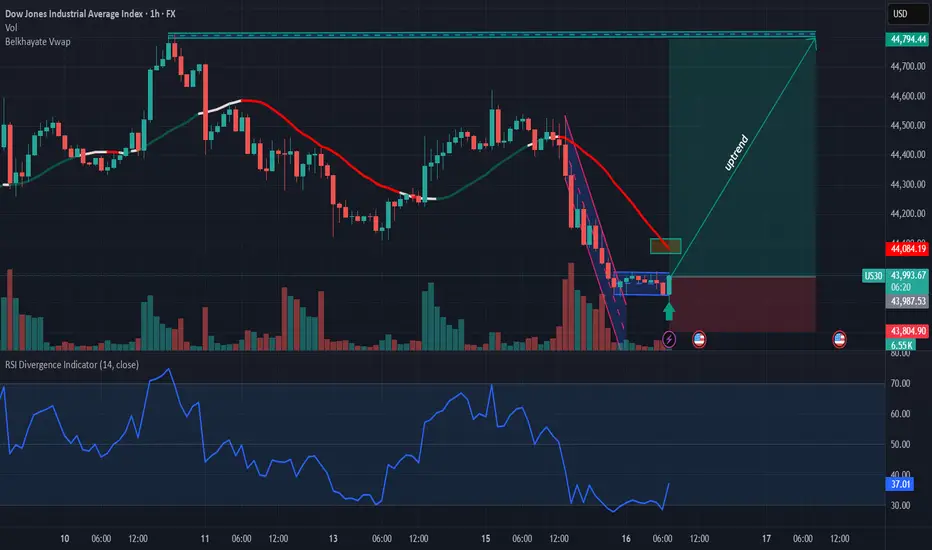
possibility bof uptrendIt is expected that some fluctuation and correction will form within the current resistance zone, then there is a possibility of a trend change and the start of a downtrend.
As long as the index does not stabilize above the green resistance zone, a downtrend is likely.


US30: Buy ideaOn US30 as you can see on the chart we would have a hight probability to have an uptrend.
DOLLAR INDEX U.S. Economic Data Release on the July 15th
Key Inflation Indicators
Indicator Current Forecast Previous
Core CPI m/m
0.2% 0.3% 0.1%
CPI m/m
0.3% 0.3% 0.1%
CPI y/y
2.7% 2.6% 2.4%
Core CPI m/m came in slightly below forecast, but still accelerated from the previous month, indicating underlying inflation pressures remain present.
Headline CPI m/m matched expectations, showing persistent monthly price growth.
Annual CPI (y/y) registered above forecast, indicating inflation is running hotter than previously expected and at its highest level since early 2025.
Empire State Manufacturing Index
Indicator Current Previous
Empire State Manufacturing Index 5.5 -8.3
The sharp rebound from negative territory signals a marked improvement in manufacturing sentiment in the New York region, pointing to possible resilience in U.S. industrial activity.
Market Implications
US Dollar (USD):
Inflation coming in at or above forecast (annual and headline monthly), along with better-than-expected manufacturing data, has support the USD in the short term. Stronger inflation weakens the case for near-term Federal Reserve rate cuts.
Treasury Yields:
Yields edged higher as bond traders weigh persistent inflation against a resilient economy, with less urgency for monetary easing.
Equity Markets:
Slightly hotter inflation and improved factory activity brings mixed reactions. Investors could become cautious over reduced chances of Fed rate cuts, but healthy manufacturing data may fuel selective equity support.
Commodities:
Gold and other non-yielding assets faced modest headwinds from a stronger USD and rising yields.
In summary:
U.S. inflation data for June shows headline and annual CPI above forecast, and core inflation still rising, suggesting persistent price pressures. The Empire State Manufacturing Index rebounded sharply, signaling improved business sentiment. These surprises likely reinforce expectations for a cautious Federal Reserve, with possible USD gains and ripple effects across equity, bond, and commodity markets.
#DXY #DOLLAR

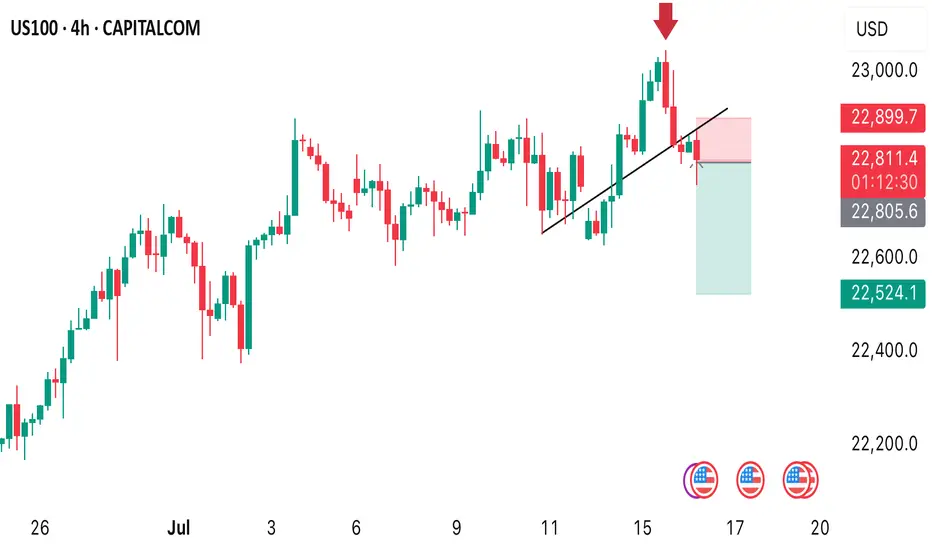
US100 SELL OPPORTUNITY A sell opportunity is envisaged as price dropped from the ALL TIME HIGH of 23000. I am shorting it with my target placed at 22524
Take advantage of this opportunity
check the trendGiven the behavior of the index in the current support area, possible scenarios have been identified.
If the index breaks through the support area, a continuation of the downward trend will be likely.

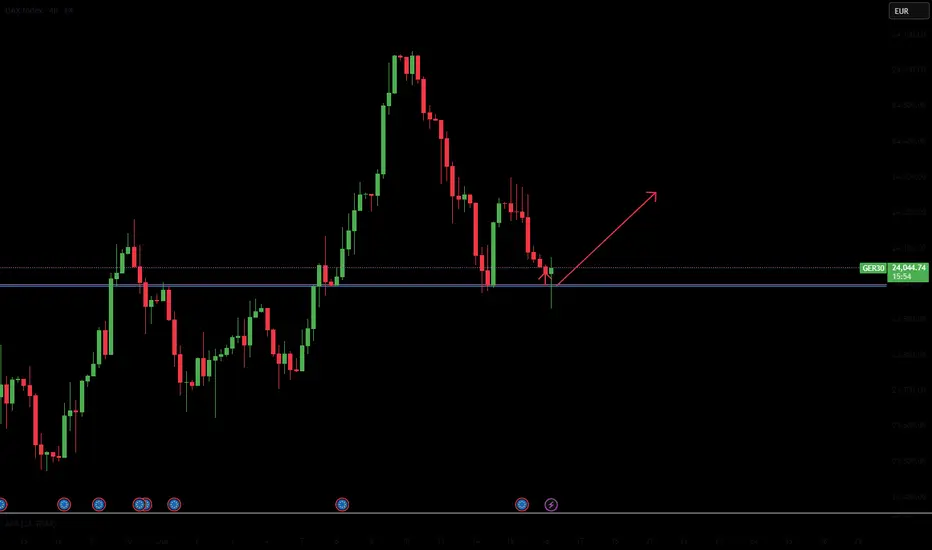
ger30 long again trend on daily is bullish ,we have a level all we need s our entry patterns on the smaller time frames . waiting for mine