Nifty levels - Jul 28, 2025Nifty support and resistance levels are valuable tools for making informed trading decisions, specifically when combined with the analysis of 5-minute timeframe candlesticks and VWAP. By closely monitoring these levels and observing the price movements within this timeframe, traders can enhance the accuracy of their entry and exit points. It is important to bear in mind that support and resistance levels are not fixed, and they can change over time as market conditions evolve.
The dashed lines on the chart indicate the reaction levels, serving as additional points of significance to consider. Furthermore, take note of the response at the levels of the High, Low, and Close values from the day prior.
We hope you find this information beneficial in your trading endeavors.
* If you found the idea appealing, kindly tap the Boost icon located below the chart. We encourage you to share your thoughts and comments regarding it.
Wishing you success in your trading activities!
Market indices
WEEKLY NYA turns and E Wave see 12/8 2024 forecast The chart of the NYA I have not changed or relabeled anything since 12/8 2024 best trades WAVETIMER

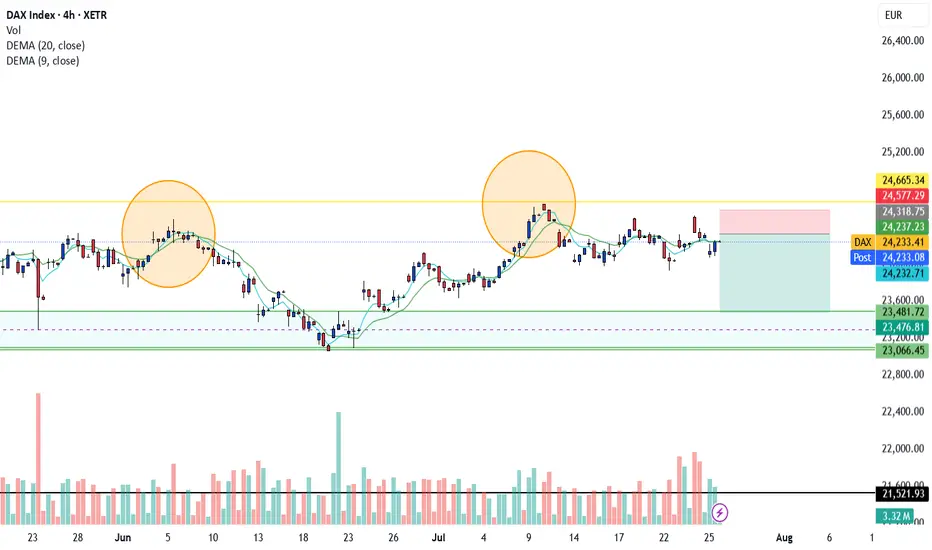
DAX Bearichthe complete set up shoxs that Dax is ranging inside the internal zone , creating a double top on the 4H time frame, witing for the smal trigger to short the position
dxy buy tradeThe Relative Strength Index (RSI) is showing an upward trend, indicating increasing momentum. Additionally, the Moving Average Convergence Divergence (MACD) is showing a bullish crossover, further supporting the potential for an upward move

BankNifty levels - Jul 28, 2025Utilizing the support and resistance levels of BankNifty, along with the 5-minute timeframe candlesticks and VWAP, can enhance the precision of trade entries and exits on or near these levels. It is crucial to recognize that these levels are not static, and they undergo alterations as market dynamics evolve.
The dashed lines on the chart indicate the reaction levels, serving as additional points of significance. Furthermore, take note of the response at the levels of the High, Low, and Close values from the day prior.
We trust that this information proves valuable to you.
* If you found the idea appealing, kindly tap the Boost icon located below the chart. We encourage you to share your thoughts and comments regarding it.
Wishing you successful trading endeavors!

SPX chit chat... we're still up for nowAfter that crazy April 2025 crash, it feels like we should not be this high so fast... that's how I felt before too. But the rising channel is holding up right now. We are approaching the top. In previous times, the market grinded even higher (COVID pandemic was the last example).
Today we squeezed out new ATHs. The month ends next week and a new one begins. Less fear; more charts for the rest of the year.
See you in August!

US30 - LONGAfter a huge push to the upside price came down during the asian/London session. Looking for buyers to take over once again and push back to yesterday's highs. Being patient as always and waiting for confirmation around my entry zone.
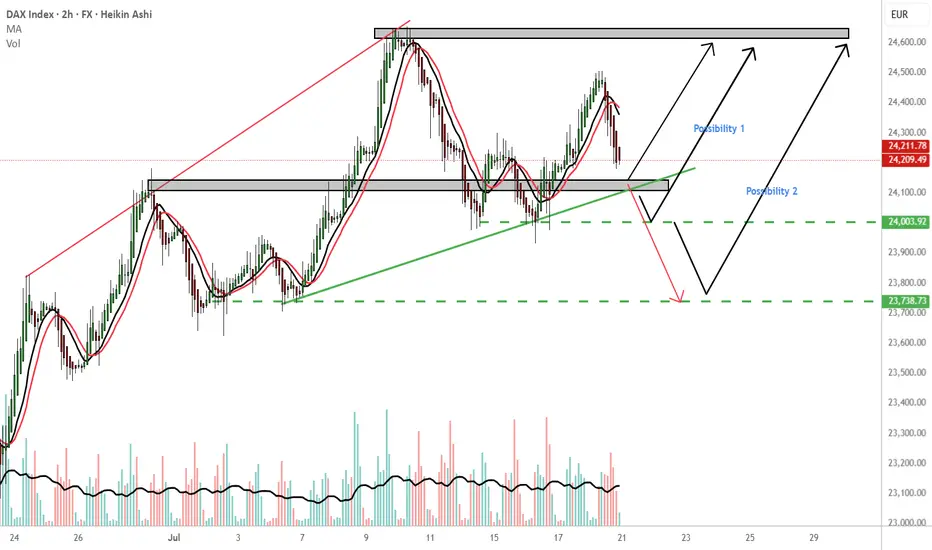
GER 30 endless possibilitiesMy most immediate outcome is reversal 24,140 price area. TP:24,600
Possibility 1: If Ger 30 holds the 24,000 price area i would consider a buy to 24,600.
Possibility 2: If Ger30 holds the 23,730 price area that would be another possibility for a buy. TP 24,600.
WCS: Worst case scenario, continuation downwards from the 24140 PL. Consider the red arrow. The 24,140 is a important price area please wait for confirmation
Please follow your trading plan.
THOUGHTS????
S&P500 push to new ATH? Key Developments:
AI Drives Earnings Momentum
Alphabet reported strong results, but flagged surging AI infrastructure costs, signaling increased capex ahead.
SK Hynix posted record earnings and committed to expanding AI-related investments, reinforcing the sector’s critical growth role.
Investor sentiment remains AI-positive, with capital rotation favoring tech and semiconductors despite margin compression risks.
Banking Sector Boosted by Tariff-Driven Volatility
Deutsche Bank’s FIC (Fixed Income & Currencies) trading revenue jumped 11% to €2.28B, its best Q2 since 2007, aided by global trade uncertainty.
BNP Paribas also beat earnings estimates, continuing the strong showing from European banks amid market volatility.
Trade & Tariff Watch
The EU and US are nearing a deal on a 15% standard tariff rate, potentially stabilizing trade flows and market pricing.
Trump’s broader reciprocal tariff push remains in focus, especially after the US-Japan deal. Investors are watching for signs of escalation or resolution with other partners like the EU and Canada.
Fed in the Political Spotlight
Trump visited the Fed’s construction site, criticizing costs and maintaining pressure on Chair Jerome Powell.
Speculation about Fed leadership changes and political interference is unsettling, though markets have largely shrugged this off for now.
Meanwhile, House Republicans are drafting a follow-up tax-and-spending plan, which could shape future fiscal policy and market expectations.
Conclusion: S&P 500 Trading Outlook
The S&P 500 remains buoyed by strong earnings, particularly from AI-linked sectors and financials, while geopolitical risks and tariff volatility are being absorbed as catalysts for trading profits rather than panic.
Bullish factors: Strong corporate earnings (Alphabet, SK Hynix, Deutsche Bank), potential trade de-escalation (EU-US tariff deal), and AI momentum.
Risks to monitor: Rising AI capex (impact on margins), political tension around the Fed, and tariff uncertainty.
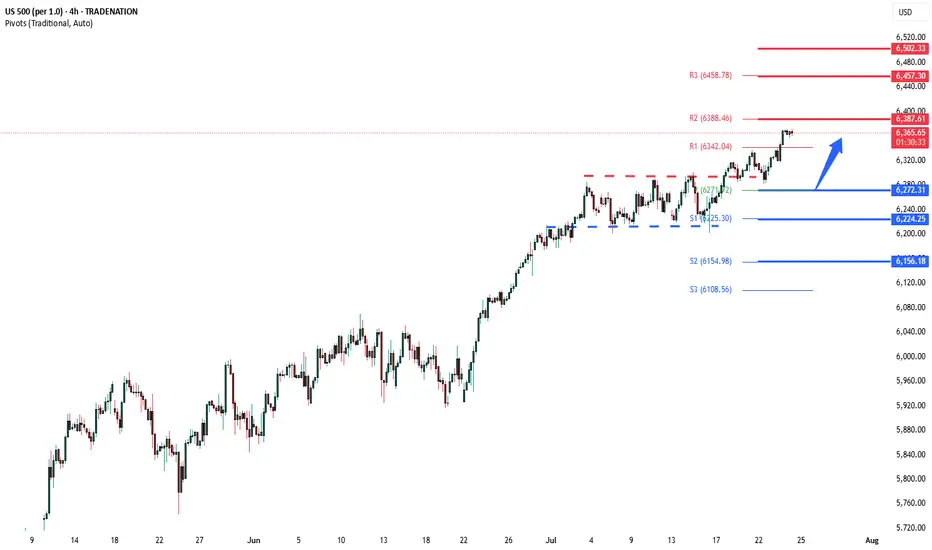
Key Support and Resistance Levels
Resistance Level 1: 6387
Resistance Level 2: 6457
Resistance Level 3: 6502
Support Level 1: 6272
Support Level 2: 6224
Support Level 3: 6156
This communication is for informational purposes only and should not be viewed as any form of recommendation as to a particular course of action or as investment advice. It is not intended as an offer or solicitation for the purchase or sale of any financial instrument or as an official confirmation of any transaction. Opinions, estimates and assumptions expressed herein are made as of the date of this communication and are subject to change without notice. This communication has been prepared based upon information, including market prices, data and other information, believed to be reliable; however, Trade Nation does not warrant its completeness or accuracy. All market prices and market data contained in or attached to this communication are indicative and subject to change without notice.
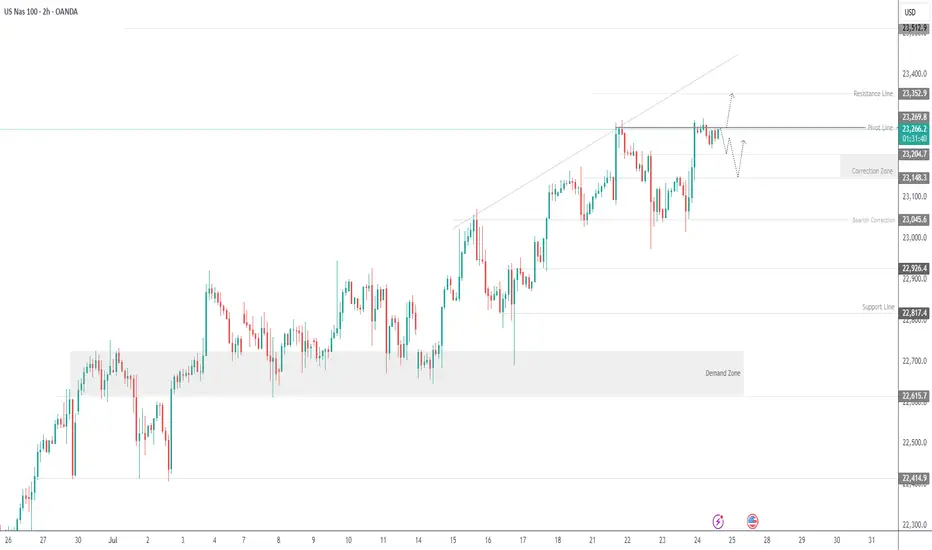
USNAS100 - Tech Index Pulls Back After Testing 23,295USNAS100 | OVERVIEW
The index came close to registering a new ATH at 23,295 before pulling back slightly.
Today, it appears to be in a bearish correction phase toward 23,200 and 23,150, as long as the price trades below 23,270.
Market sentiment may remain cautious, especially with no major earnings reports scheduled before the open, although Intel’s report after the close could have a notable impact.
A 1H close above 23,290 would invalidate the correction and open the way toward 23,350 and 23,500.
Key Levels:
Support: 23,200 · 23,150 · 23,050
Resistance: 23,350 · 23,520
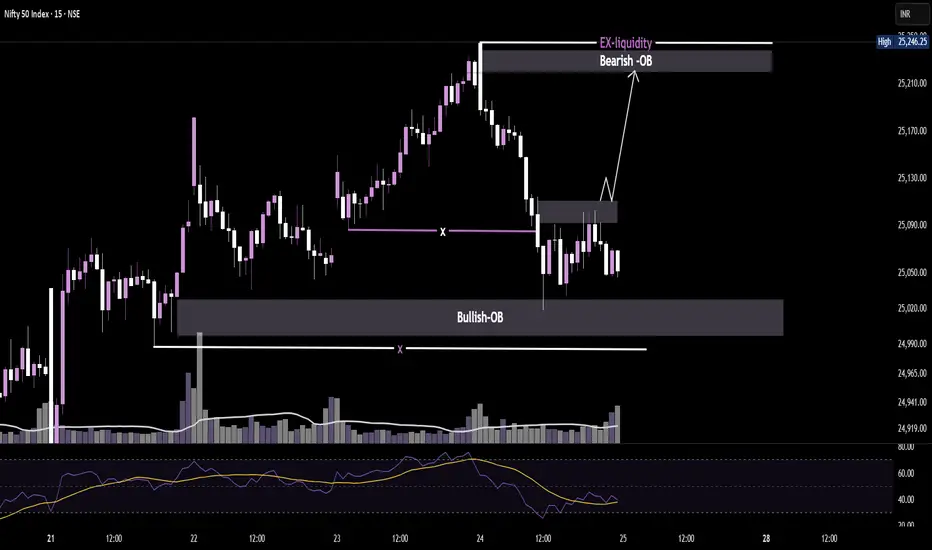
NIFTY 15MIN OB to OB play LoadingPrice tapped a bullish order block, reclaiming structure with volume backing.
Now aiming for the bearish OB + external liquidity above 25,240.
Clean transition zone — watching for rejection or continuation.
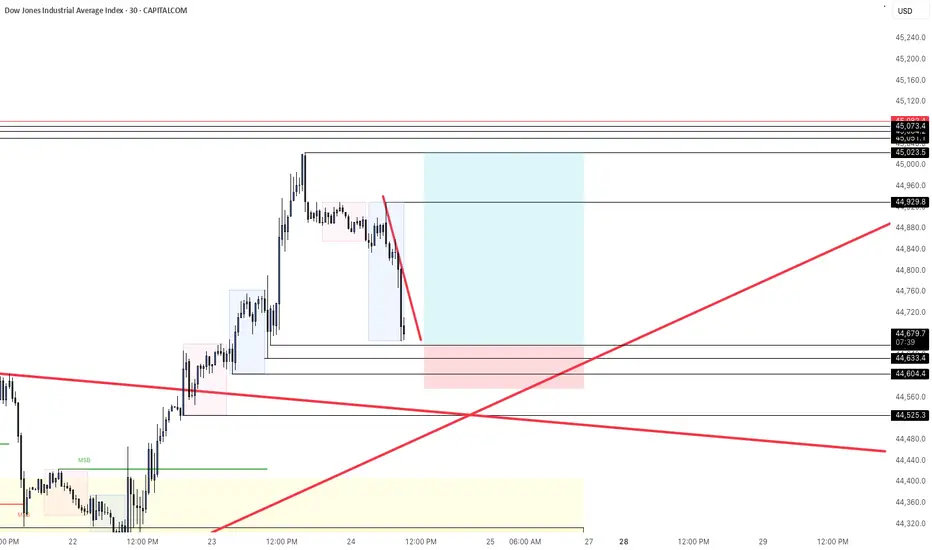
US30 Hits New All-Time High – What’s Next?US30 | OVERVIEW
The price has printed a new all-time high, exactly reaching our target at 45,090, as previously anticipated.
Today, we may see a correction toward 44,770 and 44,610. If the price stabilizes above these levels, another bullish leg is expected.
On the upside, a break above 44,910 would confirm a bullish continuation toward 45,090 and 45,250.
Key Levels:
Support: 44,770 · 44,610 · 44,370
Resistance: 45,090 · 45,250
previous idea:

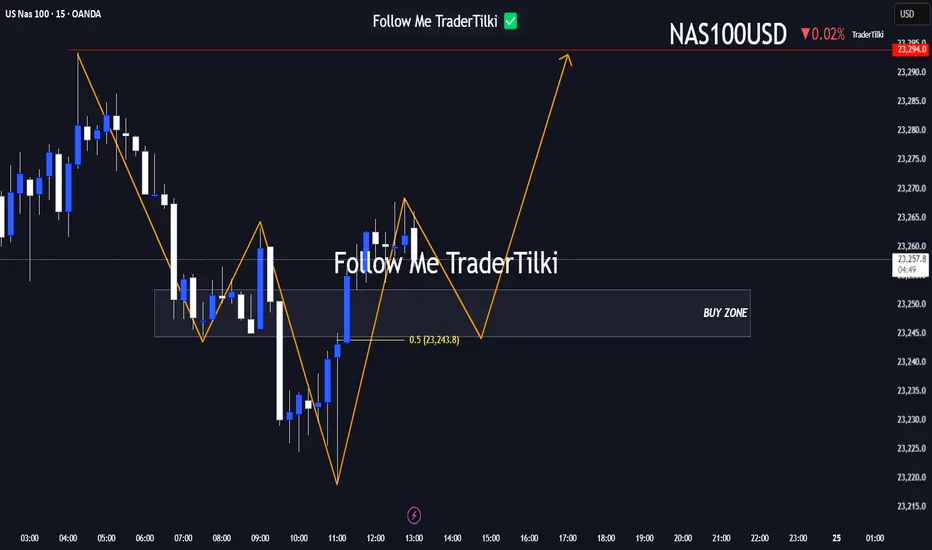
Here’s a fresh Nasdaq100 analysis I’ve put together for you.Hey Guys,
Here’s a fresh Nasdaq100 analysis I’ve put together for you.
I’ve marked the buy zone between 23,252 and 23,240. If price dips into that range, I’m anticipating a potential move upward toward 23,294.
Your likes and support are my biggest source of motivation to keep sharing these insights.
Huge thanks to everyone backing me with a thumbs-up!
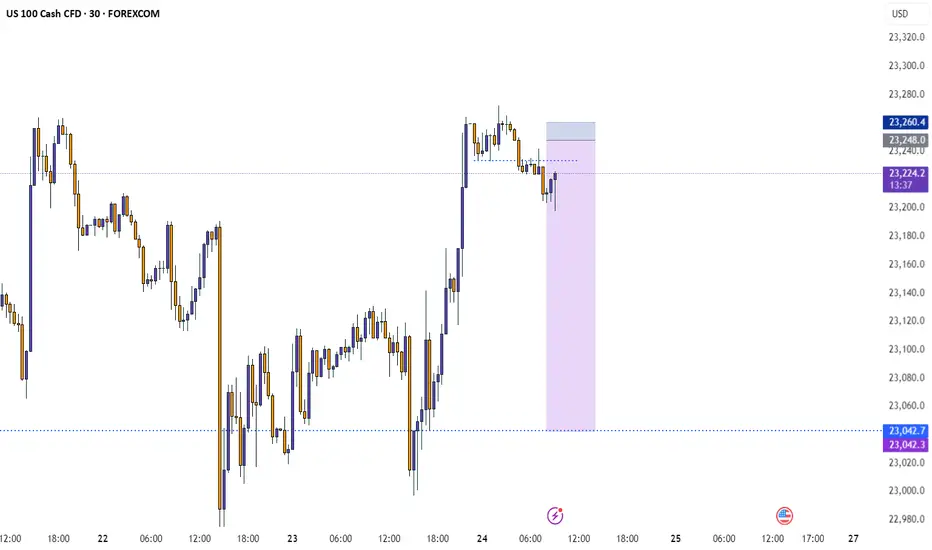
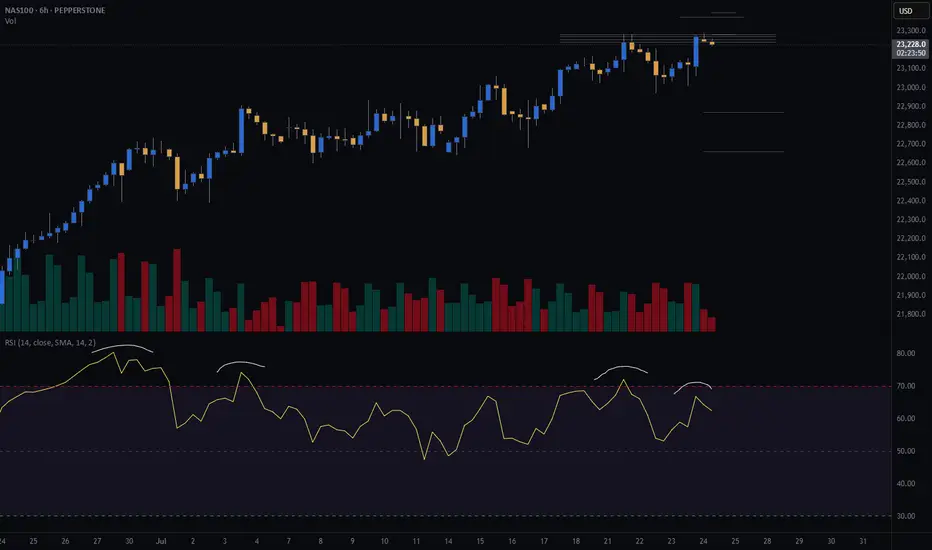
NAS100 Bigger Picture. Uptrend to be resumedLooking at the current structure through the lens of a trend trading approach, what we saw on NAS100 is more than a simple price bounce, it’s a trend continuation trading within a high-volatility environment. As price is approaching a key resistance level, how price is behaving around this dynamic trendline will be key.
This recent retracement and rejection happening near what we can call a demand zone cluster, was confirmed by a beautiful bounce off the support range. And right now price is respecting the upper and lower bounds nicely.
What happens next? Price is showing signs of bullish exhaustion, but the higher-timeframe structure supports a continuation.
My projected target is towards the upper resistance line, that’s my 23,100 zone as shown.

SellRejection Level
Daily Volume
Market Structure Shift
London Session
Trend Line Break
Untapped Order Point
Nasdaq Ascending Trend has been broken.Good night traders.
With Tuesday & today's move. NQ has broken the ascending trend, and retested the highs.
A total of 107 daily candles, 7,000pips move.
Reasons for taking this trade:
Current monthly candle has 2.9m volume, compared to a 6m & 7million from last 2 months. With only 8 days missing to end the month, how to fill all that pending volume?
Ascending trend has been broken and retested.
Expect a deep correction, around 2000-2400-2600 pips. There is correlation between 38.2 Fibo level.
Last week there was a manipulation with Powell dismiss rumor on Wednesday, next day on Thursday NQ rallied to the upside. Today being also Wednesday we saw a huge rejection to the upside, but there is no continuation.
DXY reaching bottom, + has a deeper short trend initiation, starting on January 13.
Trade will be validated if NQ creates a LL followed by a LH within the next 2 days.
What do you think of this analysis?
Thank you.
Enjoy

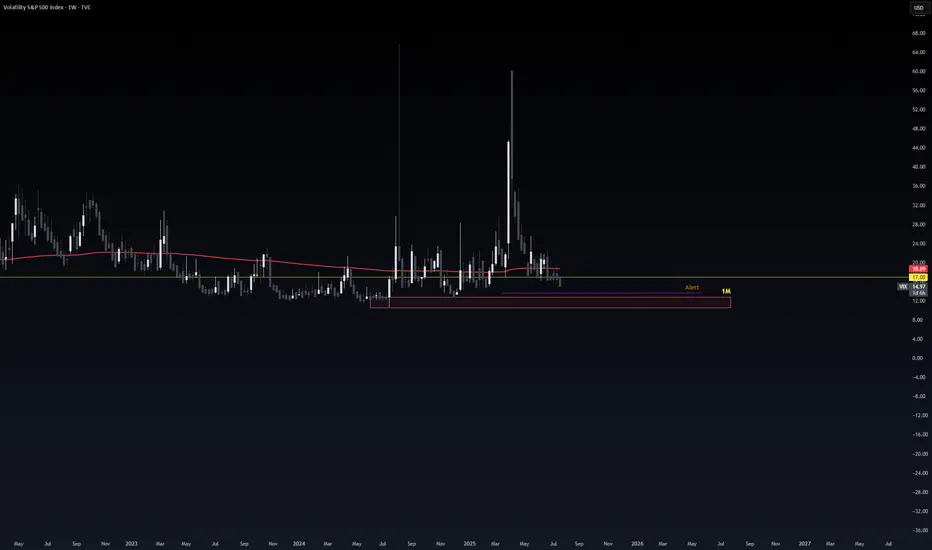
VIX Alarting !when VIX Reach Red Zone.
It consider as Extreeemeee Greeeed !!.
100% market will take U-Turn direction which will be Red in Up coming days !
although im day trading im good and never keep money in market after close.
#nifty directions and levels for July 24Good morning, friends! 🌞
Here are the market directions and levels for July 24th:
The global market is showing a moderately bullish sentiment.
Meanwhile, the local market is also exhibiting a moderately bullish tone.
Today, Gift Nifty indicates a gap-up opening of around 60 points.
What can we expect today?
In the previous session, both Nifty and Bank Nifty took a solid pullback.
At the same time, the open interest also shifted to the bullish side.
So, if the gap-up sustains, we can expect the pullback continuation.
Also, as it’s a new moon day(for south), some volatility can be expected.
Let’s look at the charts:
Current View:
The current view suggests that, as mentioned above,
if the gap-up sustains, we can expect a rally continuation with some consolidation.
In this case, the parameters are showing slight strength,
so the rejection zone may act just around the minor resistance.
Alternate View:
The alternate view suggests that
if the gap-up does not sustain or if the market rejects near immediate resistance with a solid reversal,
then we can expect a minor correction of around 23% to 38%.
However, unless the market breaks below the 38% level,
we cannot confirm a reversal into a bearish trend.

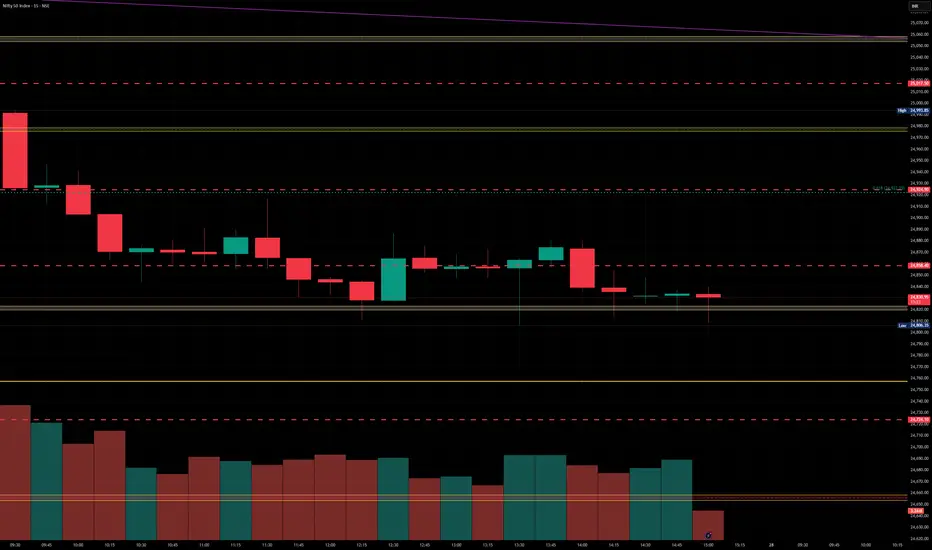
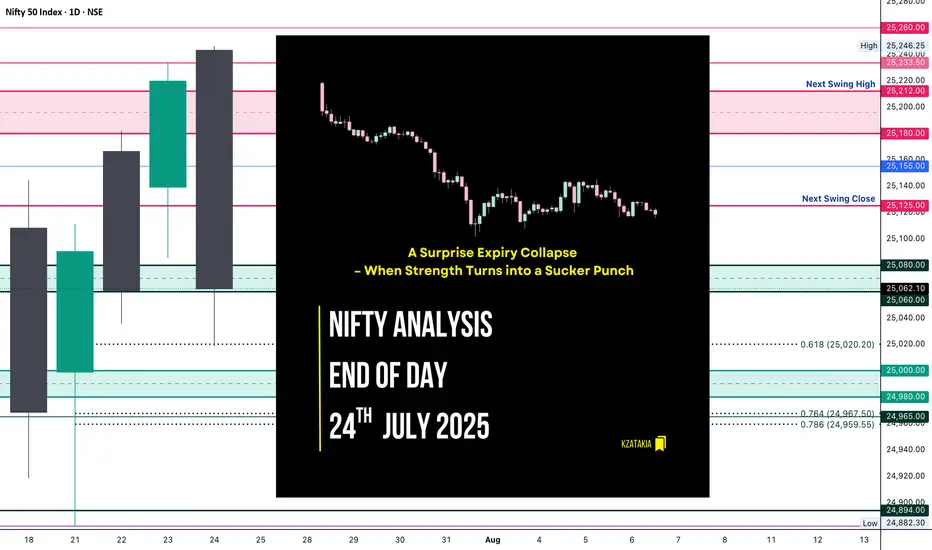
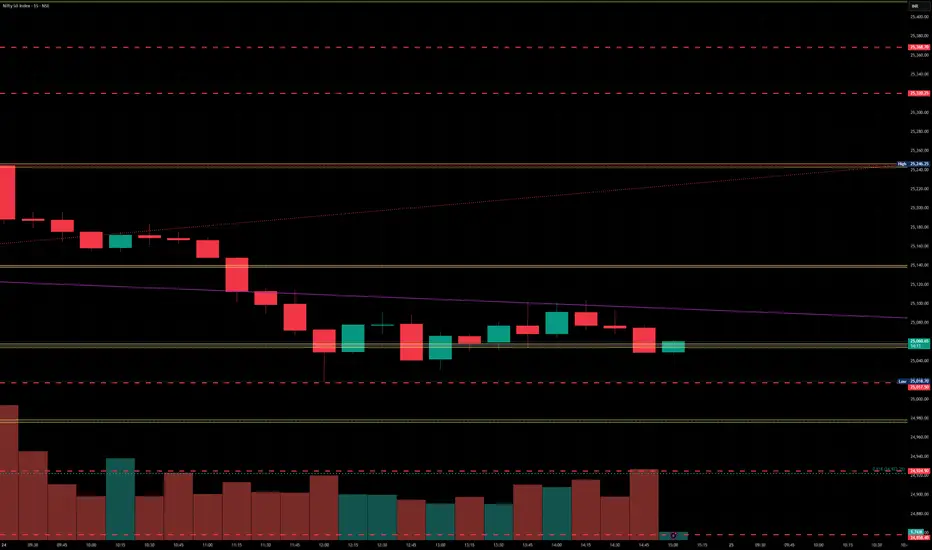
Nifty Analysis EOD – July 24, 2025 – Thursday 🟢 Nifty Analysis EOD – July 24, 2025 – Thursday 🔴
📉 A Surprise Expiry Collapse – When Strength Turns into a Sucker Punch
Today’s session was an unexpected twist.
Nifty opened above the previous day’s high, giving early hope to the bulls—but within the first hour, it slipped to 25,155 and formed its IB. What followed was a sharp 136-point fall, breaking not just yesterday’s low, but also the July 22nd low. This sudden bearish momentum was completely news-driven, and expiry-day long unwinding only added fuel to the fire.
Despite a strong close yesterday, today’s fall erased all of July 23rd’s gains and brought us right back to July 22nd’s close—neutralizing the recent upward effort.
The day closed at 25,062, marginally above key support. Technically, today’s low respected the 0.618 Fib retracement level drawn from July 21st’s low to July 23rd’s high—so a dead cat bounce is possible if no further bad news hits. But if we open below 25,050 tomorrow, expect more downside pressure toward 24,960–24,890 zones.
🕯 5 Min Time Frame Chart with Intraday Levels
🕯 Daily Time Frame Chart with Intraday Levels
🕯 Daily Candle Breakdown
Open: 25,243.30
High: 25,246.25
Low: 25,018.70
Close: 25,062.10
Change: −157.80 (−0.63%)
Candle Structure Analysis:
🔴 Body: Large red body (181.2 pts) shows strong intraday selling.
☁️ Upper Wick: Tiny (2.95 pts) → sellers dominated from the start.
🌊 Lower Wick: Moderate (43.4 pts) → small recovery near close.
Candle Type:
Almost a bearish Marubozu — clear domination by sellers with barely any upper shadow, signaling intense sell pressure.
Key Insight:
Bulls lost control after open.
Bears took charge below 25,155.
Close near support, but bias cautious.
Bulls must reclaim 25,150+ for recovery, else 25,000 may give way.
🛡 5 Min Intraday Chart
⚔️ Gladiator Strategy Update
ATR: 185.97
IB Range: 83.55 → Medium
Market Structure: Balanced
Trades Triggered:
⏰ 10:05 AM – Short Entry → SL Hit
⏰ 11:10 AM – Short Entry → Target Hit (1:3.6 Risk:Reward)
📊 Support & Resistance Levels
Resistance Zones:
25,125
25,155
25,180 ~ 25,212
25,233
Support Zones:
25,080 ~ 25,060
25,020
25,000 ~ 24,980
24,967 ~ 24,959
24,882
🔮 What’s Next?
A gap-up or stable open may trigger a dead cat bounce toward 25,150–25,180.
A gap-down below 25,050 confirms bearish continuation → next targets: 24,960 / 24,890.
Watch price action around the 25,020–25,060 zone closely.
🧠 Final Thoughts
“Markets are never wrong – opinions often are.”
— Jesse Livermore
Today was a reminder of how expiry day surprises and news flows can flip the narrative. Stay flexible, and keep a bias—but not a blind one.
✏️ Disclaimer
This is just my personal viewpoint. Always consult your financial advisor before taking any action.
NASDAQ (CASH100) SHORT - double top H6Risk/reward = 4.3
Entry price = 23 282
Stop loss price = 23 398
Take profit level 1 (50%) = 22 871
Take profit level 2 (50%) = 22 663
If current H6 goes back into range, I will open short position.
All variables on checklist have been met.
I was out last night so I missed my initial entry. Hoping for a second chance.
Hopefully this short works because the last few higher time frame short setups have failed, although because of exit plan I have made very little losses.
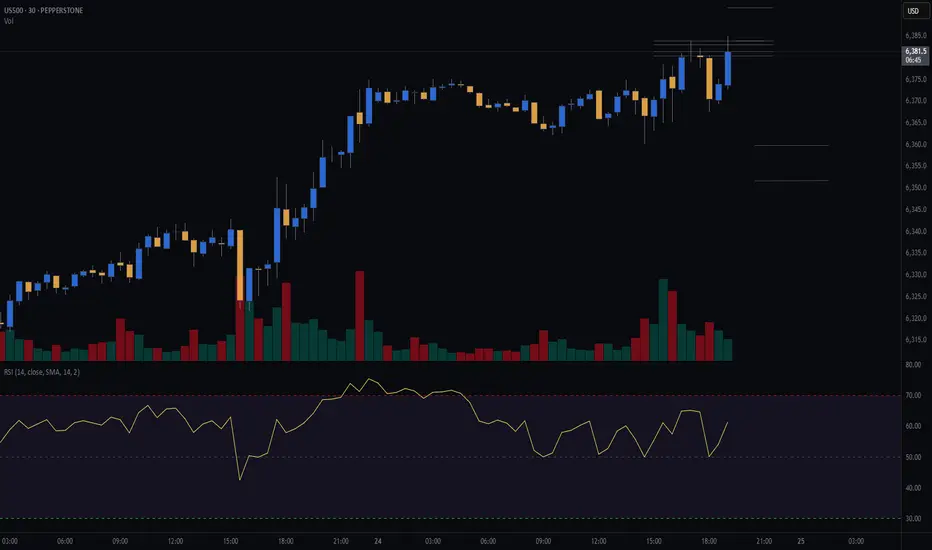
S&P (CASH500) SHORT - Double top 30minRisk/reward = 2.7
Entry price = 6384
Stop loss price = 6393.8
Take profit level 1 (50%) = 6359.8
Take profit level 2 (50%) = 6351.8
Will get confirmation of remaining variables at close of this 30min candle at 19.30.
Nifty levels - July 25, 2025Nifty support and resistance levels are valuable tools for making informed trading decisions, specifically when combined with the analysis of 5-minute timeframe candlesticks and VWAP. By closely monitoring these levels and observing the price movements within this timeframe, traders can enhance the accuracy of their entry and exit points. It is important to bear in mind that support and resistance levels are not fixed, and they can change over time as market conditions evolve.
The dashed lines on the chart indicate the reaction levels, serving as additional points of significance to consider. Furthermore, take note of the response at the levels of the High, Low, and Close values from the day prior.
We hope you find this information beneficial in your trading endeavors.
* If you found the idea appealing, kindly tap the Boost icon located below the chart. We encourage you to share your thoughts and comments regarding it.
Wishing you success in your trading activities!
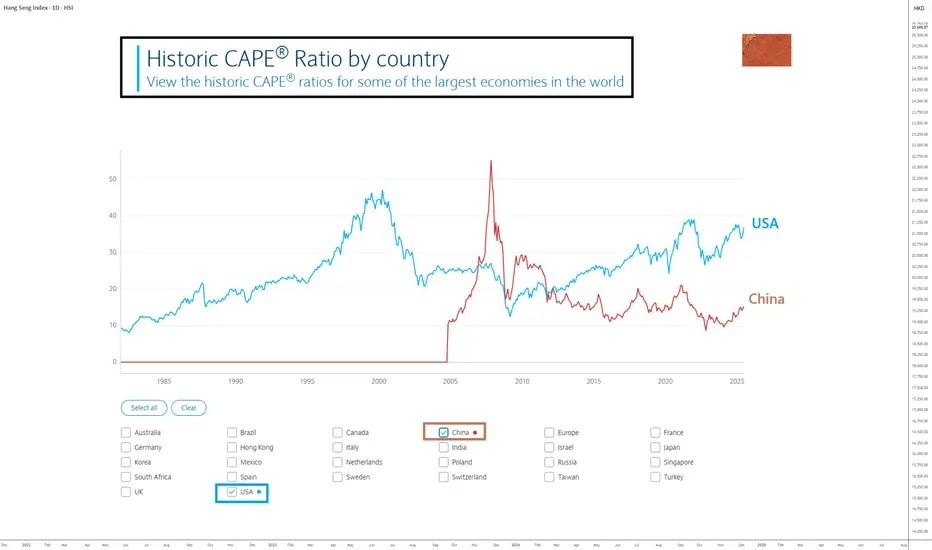
CHINA: Catch-Up Potential Remains AttractiveAs the U.S. stock market trades at all-time highs and has returned to its valuation levels of late 2021 (before the 2022 bear market), it may be wise to look at the Chinese stock market as a way to diversify your portfolio.
Regarding the analysis and potential of the S&P 500 Index, I encourage you to read my latest forward-looking study by clicking on the image below. Don’t forget to subscribe to our Swissquote account to be notified every morning when our new daily market analysis is published.
Let’s now turn back to the Chinese stock market. I believe Chinese equities still offer medium to long-term upside potential, both technically and fundamentally.
1) Strong catch-up potential from a fundamental valuation perspective
The Chinese stock market presents an interesting diversification opportunity from a valuation standpoint, with a Shiller PE ratio (CAPE) of 15 compared to 36 for the S&P 500.
Chinese equities are significantly cheaper than U.S. equities and also benefit from an ultra-accommodative monetary policy from the People's Bank of China and an expansionary fiscal policy by the Chinese government. These are key fundamental factors that support strong upside potential for Chinese equities.
2) From a technical standpoint, the ATH is the natural target for Chinese indices
Focusing on the technical analysis of the Shenzhen Composite Index (weekly chart), the setup is clear: a trading range between support at 7,500 points and resistance at 16,000 points. The market has recently built a bullish reversal pattern at the lower bound, making the upper range the natural technical target.
3) Yuan strengthening in Forex is a positive signal for Chinese equities
Finally, one more factor supports Chinese equities from a diversification angle: currency effect. The Yuan Renminbi is technically strengthening, and the USD/CNY pair has just rejected long-term resistance. As a result, international investors could benefit from a stronger CNY in the coming months.
DISCLAIMER:
This content is intended for individuals who are familiar with financial markets and instruments and is for information purposes only. The presented idea (including market commentary, market data and observations) is not a work product of any research department of Swissquote or its affiliates. This material is intended to highlight market action and does not constitute investment, legal or tax advice. If you are a retail investor or lack experience in trading complex financial products, it is advisable to seek professional advice from licensed advisor before making any financial decisions.
This content is not intended to manipulate the market or encourage any specific financial behavior.
Swissquote makes no representation or warranty as to the quality, completeness, accuracy, comprehensiveness or non-infringement of such content. The views expressed are those of the consultant and are provided for educational purposes only. Any information provided relating to a product or market should not be construed as recommending an investment strategy or transaction. Past performance is not a guarantee of future results.
Swissquote and its employees and representatives shall in no event be held liable for any damages or losses arising directly or indirectly from decisions made on the basis of this content.
The use of any third-party brands or trademarks is for information only and does not imply endorsement by Swissquote, or that the trademark owner has authorised Swissquote to promote its products or services.
Swissquote is the marketing brand for the activities of Swissquote Bank Ltd (Switzerland) regulated by FINMA, Swissquote Capital Markets Limited regulated by CySEC (Cyprus), Swissquote Bank Europe SA (Luxembourg) regulated by the CSSF, Swissquote Ltd (UK) regulated by the FCA, Swissquote Financial Services (Malta) Ltd regulated by the Malta Financial Services Authority, Swissquote MEA Ltd. (UAE) regulated by the Dubai Financial Services Authority, Swissquote Pte Ltd (Singapore) regulated by the Monetary Authority of Singapore, Swissquote Asia Limited (Hong Kong) licensed by the Hong Kong Securities and Futures Commission (SFC) and Swissquote South Africa (Pty) Ltd supervised by the FSCA.
Products and services of Swissquote are only intended for those permitted to receive them under local law.
All investments carry a degree of risk. The risk of loss in trading or holding financial instruments can be substantial. The value of financial instruments, including but not limited to stocks, bonds, cryptocurrencies, and other assets, can fluctuate both upwards and downwards. There is a significant risk of financial loss when buying, selling, holding, staking, or investing in these instruments. SQBE makes no recommendations regarding any specific investment, transaction, or the use of any particular investment strategy.
CFDs are complex instruments and come with a high risk of losing money rapidly due to leverage. The vast majority of retail client accounts suffer capital losses when trading in CFDs. You should consider whether you understand how CFDs work and whether you can afford to take the high risk of losing your money.
Digital Assets are unregulated in most countries and consumer protection rules may not apply. As highly volatile speculative investments, Digital Assets are not suitable for investors without a high-risk tolerance. Make sure you understand each Digital Asset before you trade.
Cryptocurrencies are not considered legal tender in some jurisdictions and are subject to regulatory uncertainties.
The use of Internet-based systems can involve high risks, including, but not limited to, fraud, cyber-attacks, network and communication failures, as well as identity theft and phishing attacks related to crypto-assets.