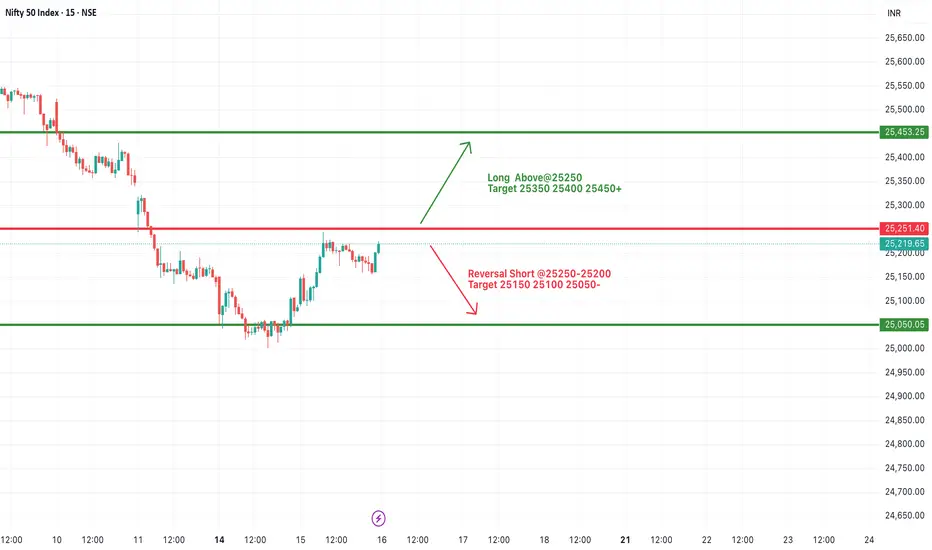
#NIFTY Intraday Support and Resistance Levels - 16/07/2025Nifty is likely to open flat near the 25200 mark, with the index currently hovering just below a key resistance zone of 25250. A decisive breakout above 25250 may provide momentum for a further upside rally toward 25350, 25400, and possibly 25450+. This level has acted as resistance in the past, so sustaining above it will be crucial for any bullish continuation.
On the flip side, 25250–25200 is also a potential reversal zone. If Nifty fails to break and sustain above it, then sellers may take control, and the index could see a pullback toward the immediate support levels of 25150, 25100, and 25050.
Since the index is near a crucial breakout/rejection point, early session price action will determine the direction.
Market indices
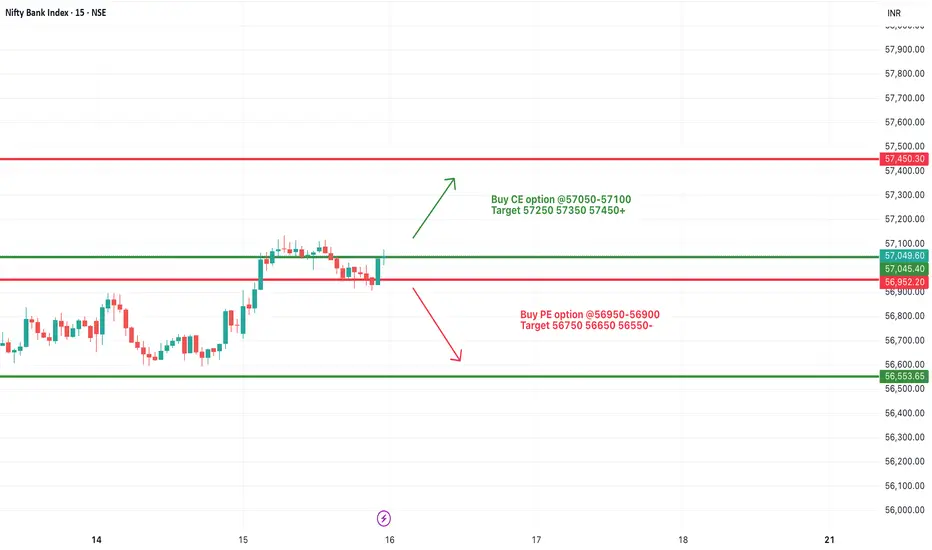
[INTRADAY] #BANKNIFTY PE & CE Levels(16/07/2025)Bank Nifty is expected to begin the day on a flat note near the 57000 mark, indicating indecisiveness after the previous session's recovery. The immediate resistance zone lies between 57050 and 57100. A sustained move above this level can trigger an upward continuation toward the targets of 57250, 57350, and possibly 57450+. This zone will be key for bullish momentum, and traders can look for strength confirmation around this breakout.
On the downside, the 56950–56900 level is crucial. If Bank Nifty slips below this zone, it may invite fresh selling pressure, with intraday downside targets around 56750, 56650, and 56550. The support at 56550 and below can act as demand zones for any pullback.
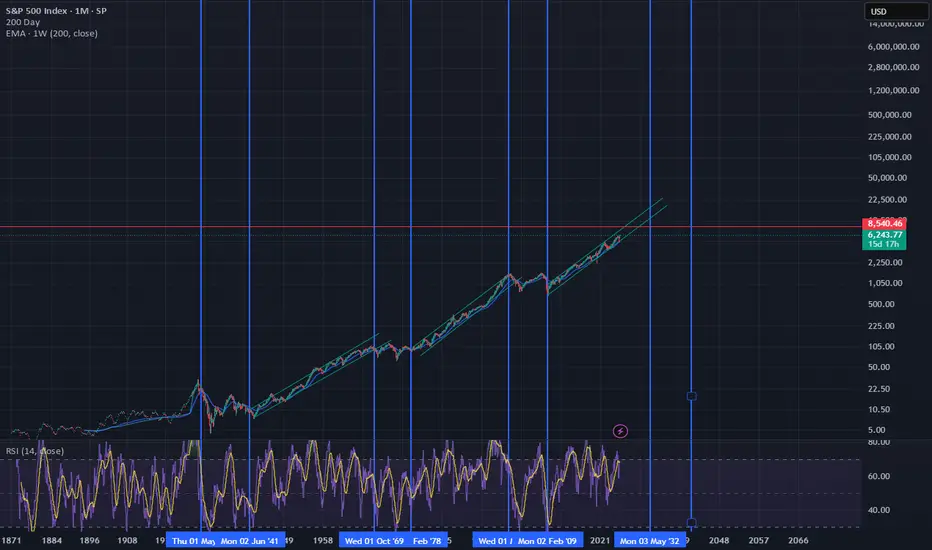
A steady move up for the next 3 yearsYou can clearly see the pattern. The boom/bust cycle, and inflation. Don't expect my lines to be exact. Imagine bitcoin if we hit the upper trend line.
Bullish for the next 3-5 years and another crisis. (2030)
They should teach this in school.
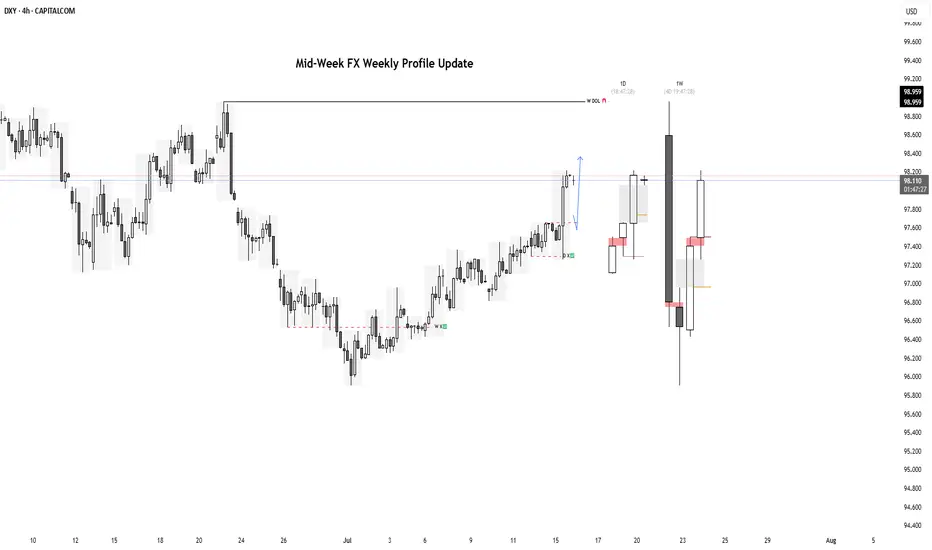
Mid-Week FX Profile UpdatesMid-Week FX Profile Update with Daily and Weekly Overlays
USDJPY
EURUSD
GBPUSD
GOLD
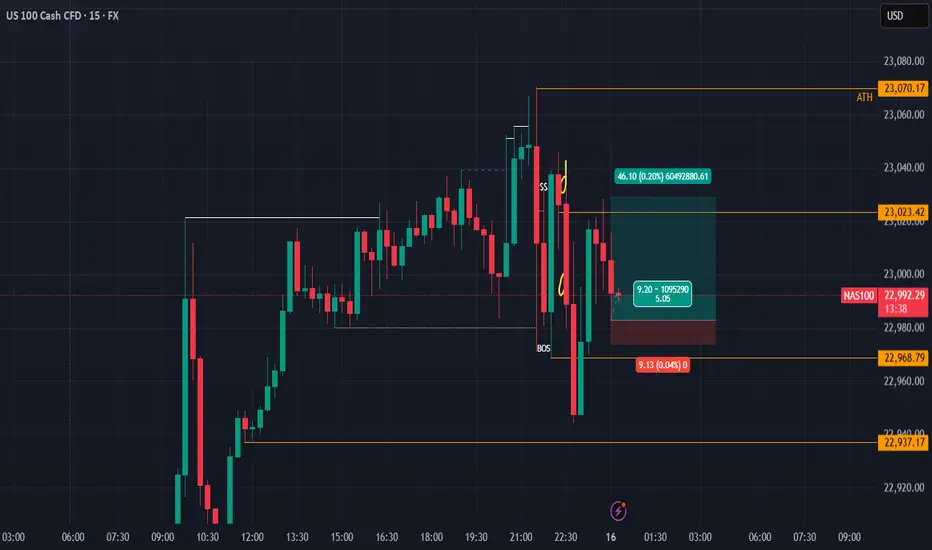
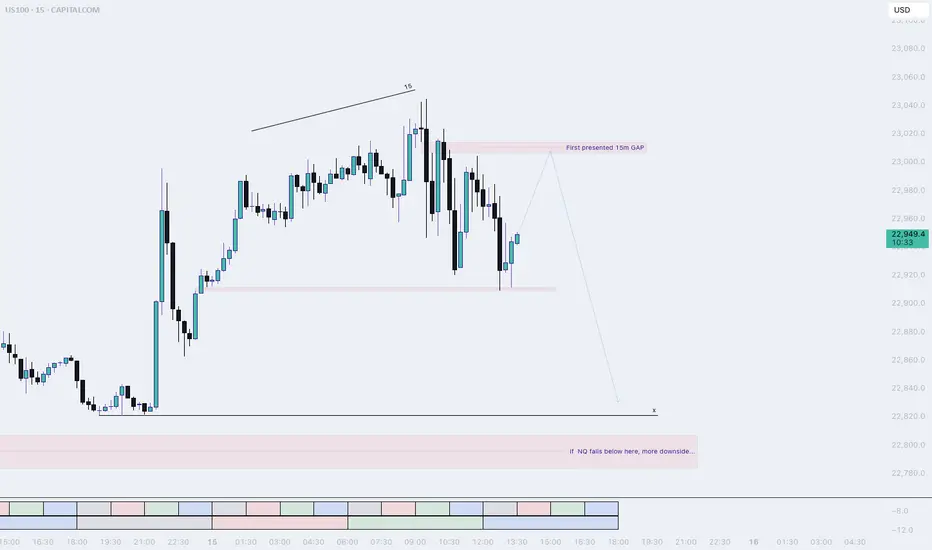
NQ Buy within range The overall trend is ranging, but the price recently created a new ATH and now it seem to be grabbing liquidity. With that, we can expect the price to continue pushing up to at least grab the liquidity above 23029.47.
Will China's strong growth and ongoing stimulus lift the HK50?
Despite US-China trade tensions and weak domestic demand, China’s GDP growth has surpassed its 5% target for the first half of the year. According to the National Bureau of Statistics, Q2 GDP grew 5.2% YoY, with authorities noting that stimulus measures aimed at boosting consumption had some effect. Reflecting this momentum, Morgan Stanley raised its 2024 China growth forecast from 4.2% to 4.5%, while Deutsche Bank revised its outlook to 4.7%, a 0.2 percentage point increase.
HK50 maintained its steady uptrend, marking a new 4-month high. Both EMAs widen the gap, indicating the potential continuation of bullish momentum. If HK50 breaches above the recent high at 24600, the index could gain upward momentum toward the next resistance at 24900. Conversely, if HK50 breaks below the support at 24100, the index may retreat to 23730.

Dollar Major BottomDollar has just finished a major zigzag correction. I was correct, in my last idea, of calling one more leg lower before this major low. Watch for the dollar to PUMP in 5 waves!

Dollar Index Having Bullish MomentumDollar Index shown good bullish momentum on previous day as we analyzed it earlier. Index has created a imbalance now the possibility for the index is to retrace back to imbalance and continue the bullish momentum and target towards the supply zone and swing high.

FX Matrix: DXY, GBPUSD, EURUSD Weekly UpdateWeekly Targets:
DXY: 98.138 - 98.261
GBPUSD: 1.34148 - 1.33606
EURUSD: 1.14463

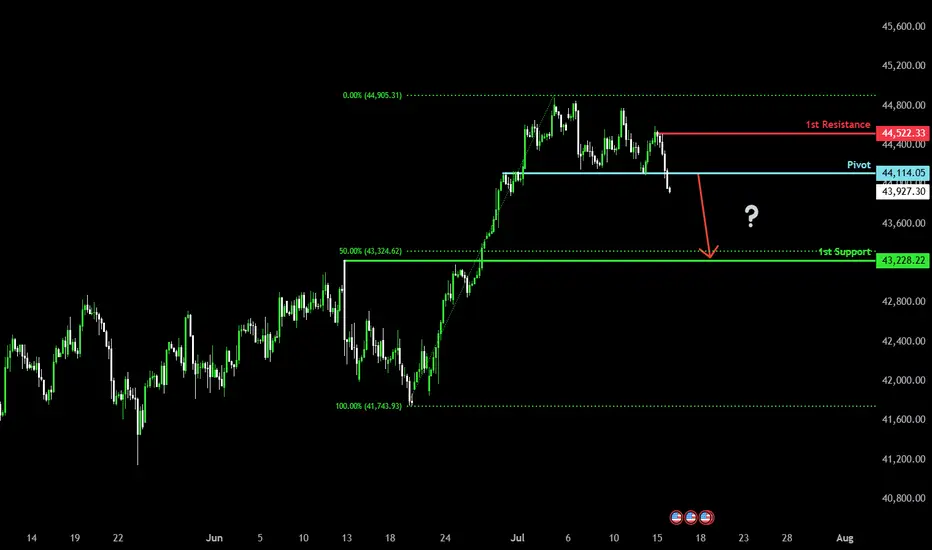
Bearish drop?Dow Jones (US30) has reacted off the pivot and could drop to the 1st support which has been identified as a pullback support.
Pivot: 44,114.05
1st Support: 43,228.22
1st Resistance: 44,522.33
Risk Warning:
Trading Forex and CFDs carries a high level of risk to your capital and you should only trade with money you can afford to lose. Trading Forex and CFDs may not be suitable for all investors, so please ensure that you fully understand the risks involved and seek independent advice if necessary.
Disclaimer:
The above opinions given constitute general market commentary, and do not constitute the opinion or advice of IC Markets or any form of personal or investment advice.
Any opinions, news, research, analyses, prices, other information, or links to third-party sites contained on this website are provided on an "as-is" basis, are intended only to be informative, is not an advice nor a recommendation, nor research, or a record of our trading prices, or an offer of, or solicitation for a transaction in any financial instrument and thus should not be treated as such. The information provided does not involve any specific investment objectives, financial situation and needs of any specific person who may receive it. Please be aware, that past performance is not a reliable indicator of future performance and/or results. Past Performance or Forward-looking scenarios based upon the reasonable beliefs of the third-party provider are not a guarantee of future performance. Actual results may differ materially from those anticipated in forward-looking or past performance statements. IC Markets makes no representation or warranty and assumes no liability as to the accuracy or completeness of the information provided, nor any loss arising from any investment based on a recommendation, forecast or any information supplied by any third-party.
DXY: potentially aiming for January 2025 highsAlthough we do not Trade the dollar specifically, it is a good barometer the feel out other assets.
It seems like DXY reached a MONTHLY LEVEL. I expect price to form a FVG within this rectangle on the daily level. Which will eventually create a GAP on one of the currencies. Will follow up when this happens.
IMO reversed and is going to reach the daily level quick. This will mean, POUND, EURO DOWN.

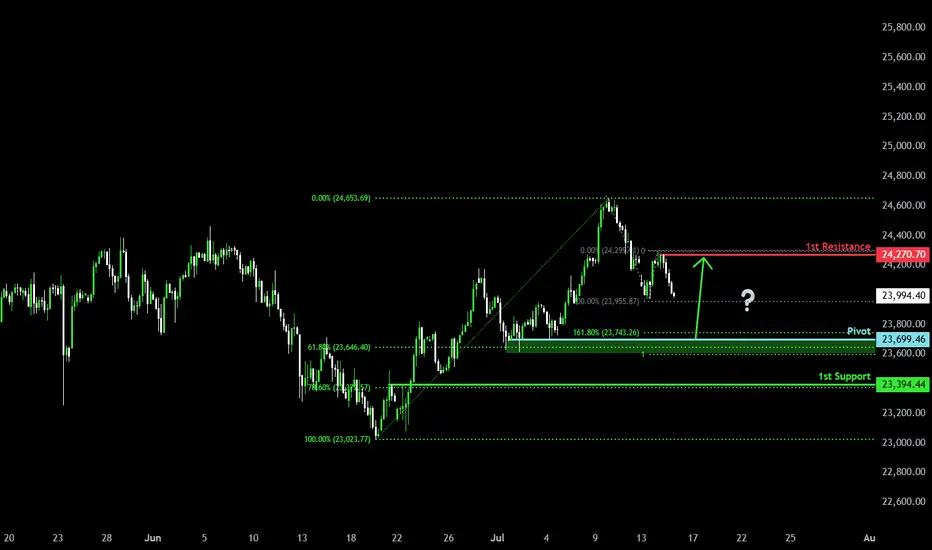
Falling towards Fibonacci confluence?DAX40 (DE40) is falling towards the pivot, which is a pullback support and could bounce to the pullback resistance.
Pivot: 23,699.46
1st Support: 23,394.44
1st Resistance: 24,270.70
Risk Warning:
Trading Forex and CFDs carries a high level of risk to your capital and you should only trade with money you can afford to lose. Trading Forex and CFDs may not be suitable for all investors, so please ensure that you fully understand the risks involved and seek independent advice if necessary.
Disclaimer:
The above opinions given constitute general market commentary, and do not constitute the opinion or advice of IC Markets or any form of personal or investment advice.
Any opinions, news, research, analyses, prices, other information, or links to third-party sites contained on this website are provided on an "as-is" basis, are intended only to be informative, is not an advice nor a recommendation, nor research, or a record of our trading prices, or an offer of, or solicitation for a transaction in any financial instrument and thus should not be treated as such. The information provided does not involve any specific investment objectives, financial situation and needs of any specific person who may receive it. Please be aware, that past performance is not a reliable indicator of future performance and/or results. Past Performance or Forward-looking scenarios based upon the reasonable beliefs of the third-party provider are not a guarantee of future performance. Actual results may differ materially from those anticipated in forward-looking or past performance statements. IC Markets makes no representation or warranty and assumes no liability as to the accuracy or completeness of the information provided, nor any loss arising from any investment based on a recommendation, forecast or any information supplied by any third-party.
NQ, PM session (Tuesday) (long into short idea)Most likely price will make one more pullback before dropping into sell-side liquidity.
The laggish price action tells us that NQ is not really done IMO. I think a retracement into the 15m Gap is doable for NQ.
Keep watching NQ afterwards, We want to see a sudden drop to confirm our down movement.
Shakeout On The WayUnlike the SPX, the DJI didn't make a higher-high. Why is this? I think partially because it's price weighted as opposed to market cap weighted like the Nasdaq or SPX. The other part would be CPI numbers.
So what's next for the DJI? I see hidden bullish divs long term and hidden bearish divs short term, this a common shake out tactic I see to liquidate longs and shorts. I'll be looking to load up on the trade at the bottom of the channel and play the range as it develops.
As always: stay calm, don't panic, and don't forget you can always use a stop loss
The fear and green index is at 74, when people are greedy be fearful.

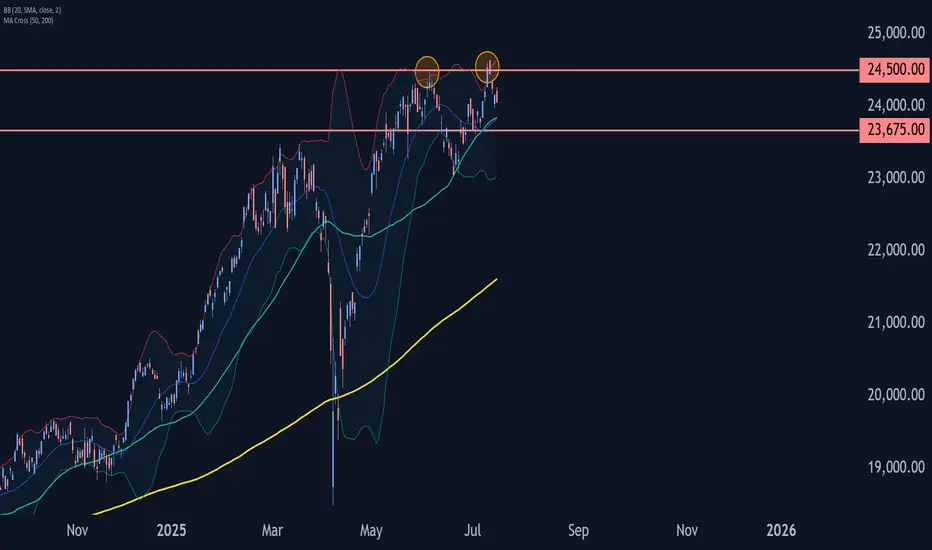
DAX Wave Analysis – 15 July 2025
- DAX reversed from the resistance area
- Likely to fall to support level 23675.00.
DAX index recently reversed down the resistance area between the pivotal resistance level 24500.00 (former top of wave 3 from June) and the upper daily Bollinger Band.
The downward reversal from this resistance zone stopped the earlier short-term ABC correction B.
Given the strength of the resistance level 24500.00, DAX index can be expected to fall further to the next support level 23675.00.
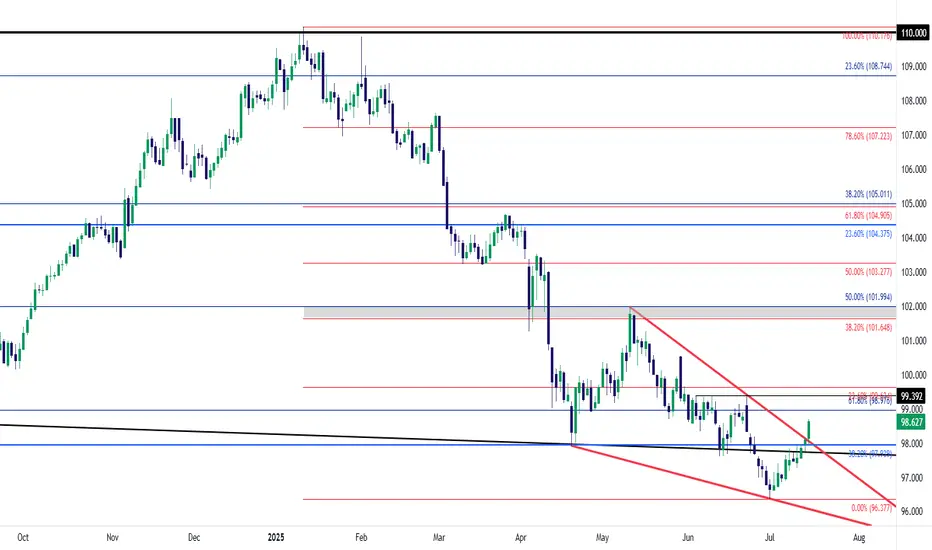
USD Falling Wedge Breakout - Bulls Continue to Turn the TideThe USD showed oversold conditions via RSI on both the daily and weekly chart as we began Q3. But, so far, the new quarter has shown a change-of-pace, as the currency has continued to rally with another topside breakout today around CPI data.
The breakout today happened at a big spot - as the long-term fibonacci level at 97.93 had previously helped to hold support back in April, leading to the bounce that ran into May. More recently that price had come in as resistance, until this morning's breakout. And it was in the immediate aftermath of the CPI release that buyers came in to hold the low at that exact level five minutes after the data dropped, and that led to a strong breakout in the USD as bulls took over.
The move is still fresh, however, as we haven't yet seen 23.6% of the sell-off from H1 get clawed back. The retracement from that move plots at 99.63, with the 100.00 level sitting overhead. Below that price, the 99.39 level remains notable as this was a June swing high, and now functions as a follow-through resistance level.
Bigger picture, it's the 101.65-102.00 zone that bulls will need to show up at to make this into anything more than a corrective pullback in a broader bearish trend. - js
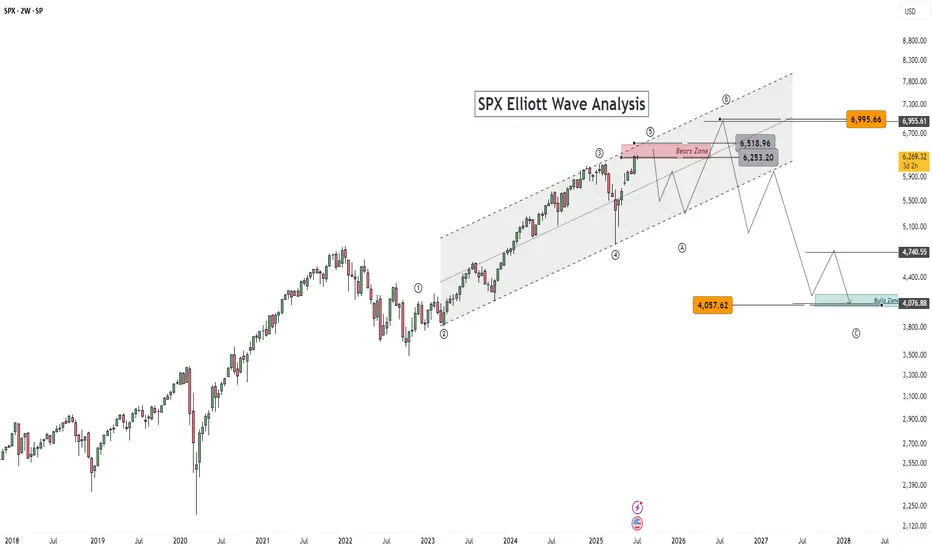
This is just my Elliott Wave Analysis not financial Advice. $SPThis is just my Elliott Wave Analysis not financial Advice. SP:SPX #SPX SP:SPX
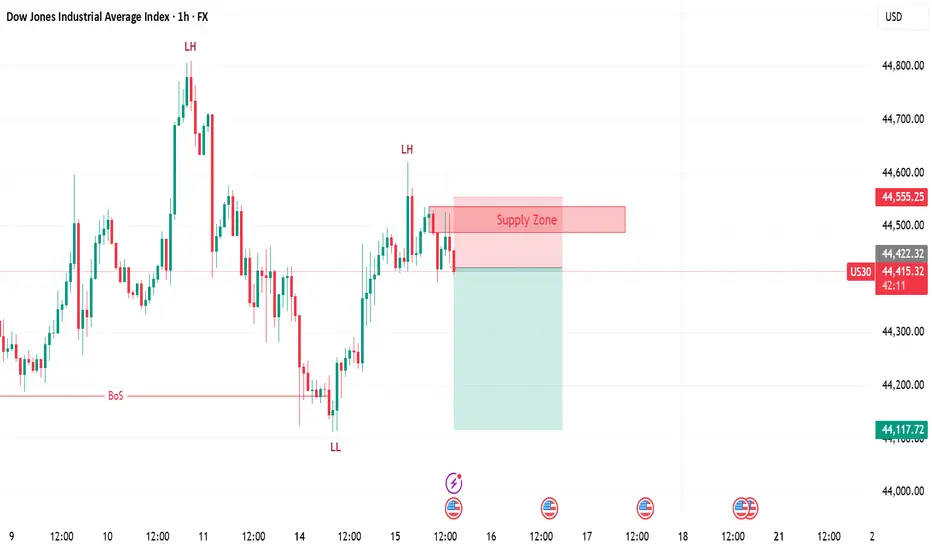
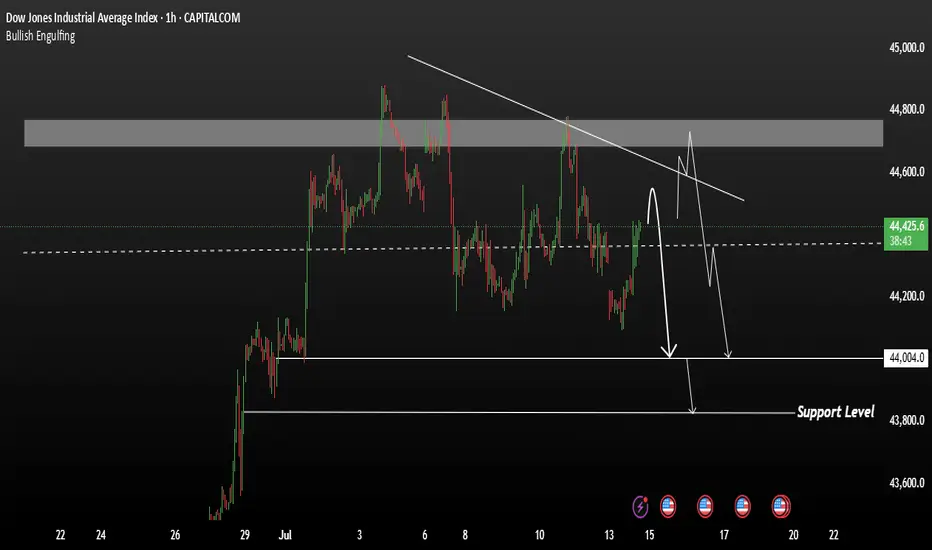
US30 Price close below Bullish reversal Then drop to 43,800The US30 is currently in a consolidation phase after a strong bullish rally, but is now showing signs of weakness. The index is facing resistance near 44,700, and as long as the price remains below this level, the bearish correction is expected to continue.
If the price fails to break above 44,700 and closes below this resistance, we could see a push toward the support zones at 44,004 and 43,800. A bullish reversal may only be considered if the price successfully holds above 44,700 on a strong candle close.
For now, bearish bias remains intact unless a confirmed breakout occurs above key resistance.
Ps Support with like and comments for more better analysis share with you Thanks for Supporting.
S&P 500 and the Elliott Wave TheoryThis is a continuation of a Weekly chart that I had previously posted. Our Wave 2(Red) was a Zigzag and the expectation is a Flat for Wave 4(Red) which we see occurred. Since Wave 4(Red) completed, a Wave 5(Red) was triggered. We can expect our Wave 5 to express itself in 5 Waves just like any other Wave. We can observe that our Wave 2(Green) was a Flat and we can expect our Wave 4(Green) to be a Zigzag. Wave 3(Green) was a strong upward move and a confirmation at its current price would trigger a Zigzag correction. This would be our Wave 4(Green) and would set the stage for the last wave before a major correction.

DXY Bearish The DXY is currently positioned at a critical level, experiencing significant volatility. It appears to be transitioning between key zones, with a potential shift from the 98.058–97.917 range into a bearish move. If confirmed, the index could target lower levels around 95.5 to 94.00

Nifty Analysis EOD – July 15, 2025 – Tuesday🟢 Nifty Analysis EOD – July 15, 2025 – Tuesday 🔴
"Buyers Step Back with Conviction, Reclaim Lost Ground"
Nifty began the session with a flat-to-positive tone, and the first 5-minute candle confidently added 60 points, pushing the index toward 25,150 – aligning with the Previous Day High (PDH). However, the level couldn't hold on the first attempt and Nifty slipped back to the day's open. After a brief consolidation, bulls made a strong comeback.
The second push broke through the PDH, Day High, and the resistance zone of 25,180–25,212, and extended the move up to mark the day’s high at 25,245.20. Post that, the index hovered above the breakout zone and closed solidly at 25,195.80, showing strength and follow-through.
📈 The day’s structure was clean and directional — a healthy bounce and hold above critical levels, reinforcing the idea that buyers are regaining control after last week’s consolidation and weakness.
🕯 5 Min Time Frame Chart with Intraday Levels
🕯 Daily Time Frame Chart with Intraday Levels
🕯 Daily Candle Breakdown
Open: 25,089.50
High: 25,245.20
Low: 25,088.45
Close: 25,195.80
Change: +113.50 (+0.45%)
📊 Candle Structure Breakdown
Real Body: 106.30 points – strong green bullish body
Upper Wick: 49.40 points – profit-taking or resistance at highs
Lower Wick: 1.05 points – negligible dip from open
🔍 Interpretation
Opened flat and quickly built momentum.
Temporary pullback in first 15 minutes was bought into strongly.
Closed with a clean green body, showing clear intraday bullish intent.
Holding above the 25,180–25,212 zone is a big win for bulls.
🕯 Candle Type
Bullish Marubozu-like (strong green body with minimal lower wick) — shows conviction and potential start of a new upswing post recent chop.
📌 Key Insight
25,080–25,100 is now a key base and must be protected.
If Nifty can break and hold above 25,240–25,250, a move toward 25,295–25,315 looks likely.
Failure to hold above 25,180 would be first sign of hesitation.
🛡 5 Min Intraday Chart
⚔️ Gladiator Strategy Update
ATR: 186.18
IB Range: 67.35 → Medium IB
Market Structure: 🟢 Balanced
Trades Triggered
10:30 AM – Long Trade → ✅ Target Achieved, Trailed SL (R:R 1:2.48)
📌 Support & Resistance Zones
Resistance Levels
25,168
25,180 ~ 25,212
25,260
25,295 ~ 25,315
Support Levels
25,125
25,080 ~ 25,060
25,000 ~ 24,980
24,965
💭 Final Thoughts
"Trend is nothing without follow-through — today buyers showed up, but tomorrow they must push past 25,250 to prove it wasn't just a bounce."
✏️ Disclaimer
This is just my personal viewpoint. Always consult your financial advisor before taking any action.

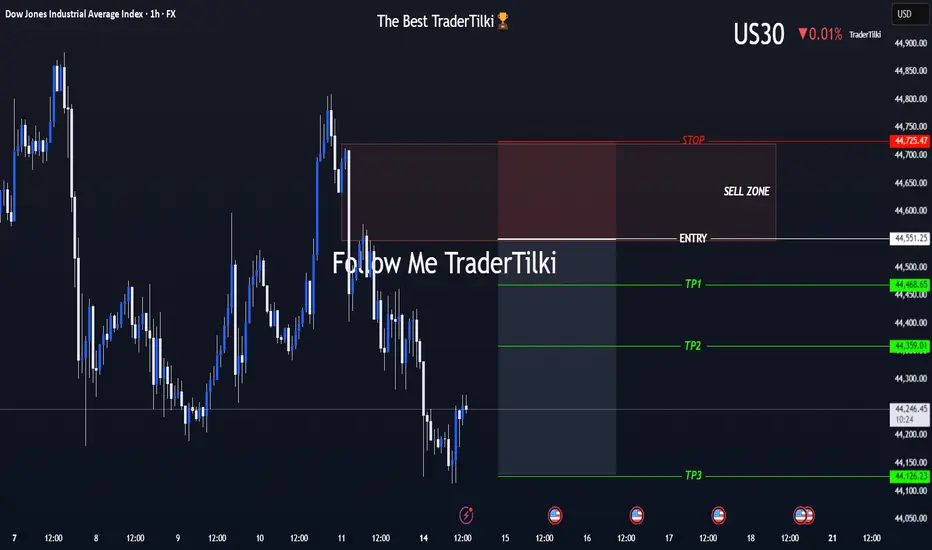
US30 (Dow Jones) Is On My Radar — The Moment’s Getting Close!Hey Guys,
I've marked my sell zone on the Dow Jones (US30) chart.
Once price reaches my entry range, I’ll be jumping into this high-probability trade setup.
🚪 Entry Levels: 44,551 – 44,632 – 44,677
🛑 Stop Loss: 44,725
🎯 Targets:
• TP1: 44,468
• TP2: 44,359
• TP3: 44,126
📐 Risk-to-Reward Ratio: Approximately 2.41 from the 44,551 entry
Your likes and support are what keep me motivated to share these analyses consistently.
Huge thanks to everyone who shows love and appreciation! 🙏
US30 | SELLConfirmation from 15 minute timeframe.
General trend in 1H is downward.
Trading with impulse.