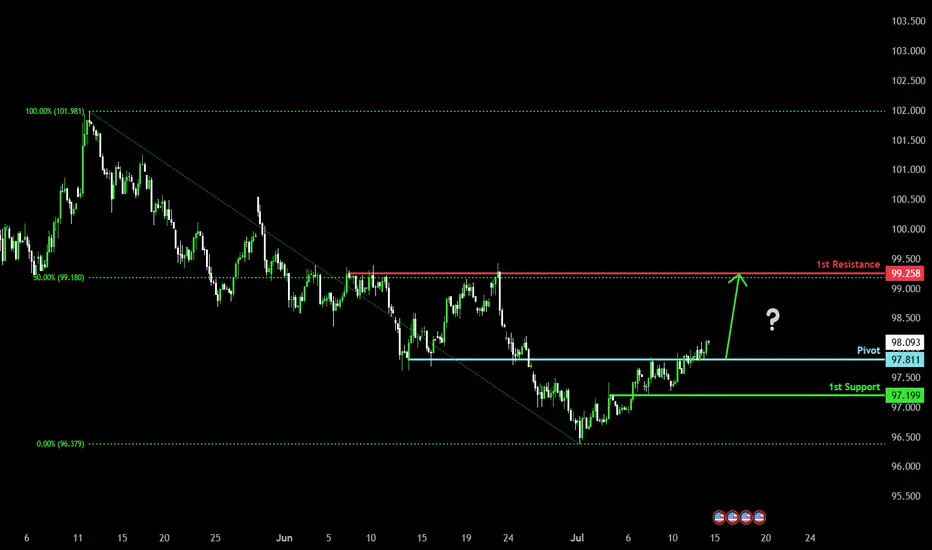
Potential bullish rise?US Dollar Index (DXY) has reacted off the pivot and could rise to the 50% Fibonacci resistance.
Pivot: 97.81
1st Support: 97.19
1st Resistance: 99.25
Risk Warning:
Trading Forex and CFDs carries a high level of risk to your capital and you should only trade with money you can afford to lose. Trading Forex and CFDs may not be suitable for all investors, so please ensure that you fully understand the risks involved and seek independent advice if necessary.
Disclaimer:
The above opinions given constitute general market commentary, and do not constitute the opinion or advice of IC Markets or any form of personal or investment advice.
Any opinions, news, research, analyses, prices, other information, or links to third-party sites contained on this website are provided on an "as-is" basis, are intended only to be informative, is not an advice nor a recommendation, nor research, or a record of our trading prices, or an offer of, or solicitation for a transaction in any financial instrument and thus should not be treated as such. The information provided does not involve any specific investment objectives, financial situation and needs of any specific person who may receive it. Please be aware, that past performance is not a reliable indicator of future performance and/or results. Past Performance or Forward-looking scenarios based upon the reasonable beliefs of the third-party provider are not a guarantee of future performance. Actual results may differ materially from those anticipated in forward-looking or past performance statements. IC Markets makes no representation or warranty and assumes no liability as to the accuracy or completeness of the information provided, nor any loss arising from any investment based on a recommendation, forecast or any information supplied by any third-party.
Market indices
SPX - Next Target is 7000- SPX is currently trading around 6200 after breakout previous all time high.
- Price has formed a nice broadening wedge pattern and currently heading towards the next resistance line.
- We can expect a slight correction upt o 6100, and reversal towards 7000.
- I'm expecting SPX to hit 7000 target by Q1 of 2026.
Trade Opportunity
Entry: 6200
TP1: 6400
TP2: 6600
TP3: 6800
TP4: 7000
SL at: 6057
Stay tuned frequent updates
Cheers
GreenCrypto

NAS100/US100 Short Swing Trade for week Risking 1% to make 2%PEPPERSTONE:NAS100 / CAPITALCOM:US100 Short trade for week - its swing trade, with my back testing of this strategy, it hits multiple possible take profits, manage your position accordingly.
This is good trade, don't overload your risk like greedy, be disciplined trader, this is good trade.
Use proper risk management
Looks like good trade.
Lets monitor.
Use proper risk management.
Disclaimer: only idea, not advice


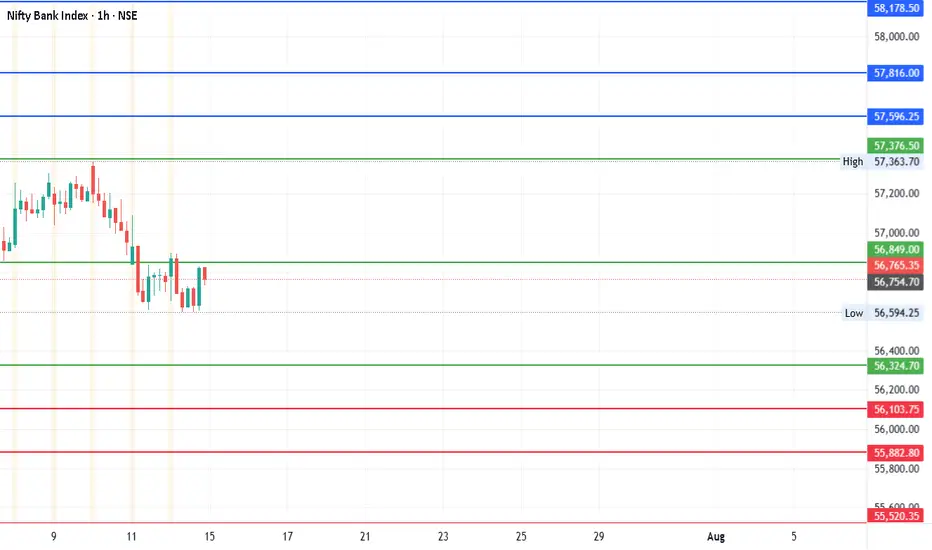
#BankNifty Weekly: Major Levels & Targets You Need to KnowDate: 14-07-2025
#Nifty Bank Technical Levels
Current Price: ₹56,765.35
Pivot Point: ₹56,849.40
Upside Targets (if price moves above Pivot)
| Target | Price |
| ----------- | ---------- |
| 🎯 Target 1 | ₹57,596.25 |
| 🎯 Target 2 | ₹57,816.00 |
| 🎯 Target 3 | ₹58,178.48 |
| 🎯 Target 4 | ₹58,540.95 |
🔽 Downside Targets (if price drops below Pivot)
| Target | Price |
| ----------- | ---------- |
| 🎯 Target 1 | ₹56,103.76 |
| 🎯 Target 2 | ₹55,882.80 |
| 🎯 Target 3 | ₹55,520.33 |
| 🎯 Target 4 | ₹55,157.85 |
🛑 Support & Resistance Levels
Support: ₹56,324.71
Resistance: ₹57,376.51
Observations:
Since the current price is below the pivot (₹56,849.40), immediate bearish bias could be assumed unless a strong reversal happens.
A break below ₹56,324.71 (Support) could trigger the downside targets.
Conversely, crossing back above the pivot may shift bias to bullish, targeting the resistance and beyond.
#TradingView #Stocks #Equities #StockMarket #Investing #Trading #Nifty
#TechnicalAnalysis #StockCharts #Finance #BankNifty #NiftyBank #WeeklyAnalysis
NASDAQ Is looking for a massive break-out to 24000!Nasdaq (NDX) is most likely taking advantage of the 4H MA50 (blue trend-line) as a Support and after hitting it, it appears that the price will look for a way above the Parabola.
This might be similar to what took place after the May 07 test of the 4H MA50. The price broke above that parabolic pattern and peaked on the 2.0 Fibonacci extension. As a result, we are looking for 24000 as a potential Target in the next 2 weeks.
-------------------------------------------------------------------------------
** Please LIKE 👍, FOLLOW ✅, SHARE 🙌 and COMMENT ✍ if you enjoy this idea! Also share your ideas and charts in the comments section below! This is best way to keep it relevant, support us, keep the content here free and allow the idea to reach as many people as possible. **
-------------------------------------------------------------------------------
Disclosure: I am part of Trade Nation's Influencer program and receive a monthly fee for using their TradingView charts in my analysis.
💸💸💸💸💸💸
👇 👇 👇 👇 👇 👇

Dollar looks ready to blast off...we'll see if its a risk assetBasic, strength and pattern analysis. Dollar appears to be completing its Primary A wave of a cyclical correction. Strength has built up, the pattern looks right, and leave it to a large magnitude A wave to complete in a no man's land of Fib support...(ABC extension corrective not pictured).
I would expect a run back up to the Intermediate B over the next 6-8 months, and maybe even higher. One more low is possible, but not necessary...neither from a pattern perspective, nor from a strength perspective, although I have a little extension box below in green, and if it is to extend, that is the target.

25-07-03 NDX 22867 - Recovery done/Correction aheadImpulsive recovery with nice 1 to 5 structure.
Expect maybe last 3-5% upward, then correction down to 20'600.

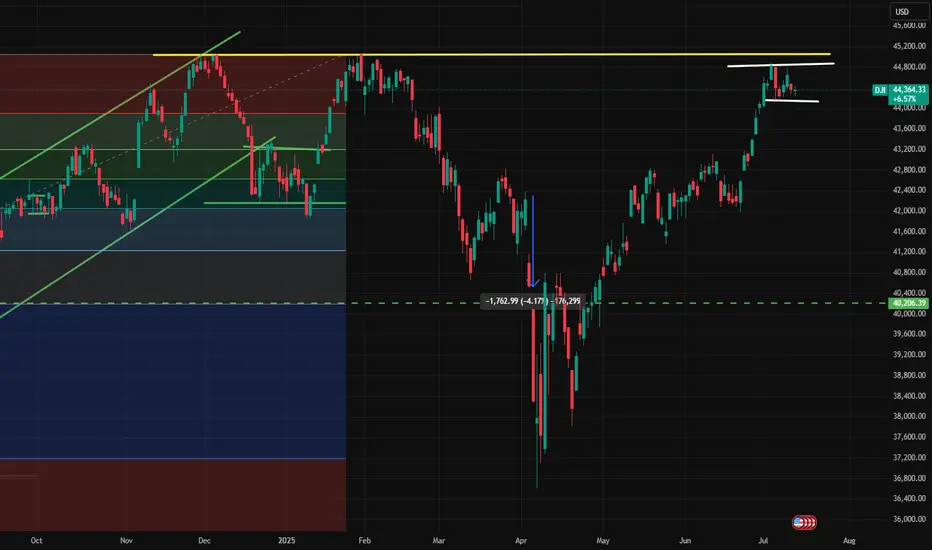
Dow Jones Technical Outlook – July 2025The Dow Jones is currently trading in a tight consolidation range just below its major resistance zone near 45,200.
After a strong bullish rally, the index is showing signs of exhaustion with lower volatility and sideways price action — forming a potential rectangle pattern. This type of structure typically signals a continuation or reversal, depending on the breakout direction.
📌 Key Levels to Watch:
Resistance: 45,200 – A breakout above this level may trigger a strong upside rally toward
Support: 44,050 – A breakdown below this can open the door for a retest of 43,200 or even 42,000.
Price is coiling — the market is waiting. The next breakout could set the tone for weeks to come.

SPX looking brittleSPX seems to showing signs of cooling, noting by the 50/200 SMA lines clearly show this. Also, lower highs. Don't wait until you're in the red to sell! Remember that retailers have been buying and institutions have been offloading stocks. Someone will be holding the bag!

Nifty Analysis EOD – July 14, 2025 – Monday🟢 Nifty Analysis EOD – July 14, 2025 – Monday 🔴
"Broken Support, Fought Resistance – Tug of War in Play"
Nifty began the day with a classic Open = High (OH) setup, instantly rejecting any bullish intent. The crucial support zone of 25,080–25,060 was taken out early, and the market went on to mark the day's low at 25,001.95, a level that quickly turned into a decisive battleground.
After a bounce from the low, 25,125 emerged as a stiff resistance that pushed the index back below the broken support zone. For most of the session, the same support zone turned into resistance — a textbook polarity flip. However, in the final hour, Nifty showed resilience and finally closed back above 25,080, ending the session at 25,082.30.
🔄 The structure was full of failed intraday breakouts, signaling confusion and conflict — likely fueled by a wider CPR, imbalanced market structure, and medium IB of 109 pts. It was a low-volatility session, but packed with psychological tests.
🕯 5 Min Time Frame Chart with Intraday Levels
🕯 Daily Time Frame Chart with Intraday Levels
🕯 Daily Candle Breakdown
Open: 25,149.50
High: 25,151.10
Low: 25,001.95
Close: 25,082.30
Change: −67.55 (−0.27%)
📊 Candle Structure Breakdown
Real Body: 67.20 points – small to moderate bearish body
Upper Wick: 1.60 points – negligible upside attempt
Lower Wick: 80.35 points – strong defense from day’s low
🔍 Interpretation
Opened higher but got instantly rejected (OH formation).
Sellers took charge early but failed to hold momentum all the way.
The long lower wick reflects buyer presence at key 25,000 zone.
The close below open but above reclaimed support suggests tug of war — with bulls slightly redeeming themselves by EOD.
🕯 Candle Type
Hammer-like red candle — while bearish on close, the long lower shadow indicates potential exhaustion of selling and hints at reversal if follow-through buying emerges next session.
📌 Key Insight
25,000–25,020 has emerged as crucial near-term support.
A strong open or close above 25,150–25,180 may confirm a bullish reversal setup.
Breakdown below 25,000 opens the door for a fall toward 24,950 or lower.
🛡 5 Min Intraday Chart
⚔️ Gladiator Strategy Update
ATR: 188.77
IB Range: 109.20 → Medium IB
Market Structure: 🔴 Imbalanced
Trades Triggered
09:50 AM – Long Trade → ❌ SL Hit
01:05 PM – Short Trade → ❌ SL Hit
📉 Tough day for directional trades — false breakouts dominated.
📌 Support & Resistance Zones
Resistance Levels
25,125
25,168
25,180 ~ 25,212
25,260
25,295 ~ 25,315
Support Levels
25,080 ~ 25,060
25,000 ~ 24,980
24,965
💭 Final Thoughts
“Reclaimed ground doesn’t mean victory – yet. Watch the next move. Rejection below 25,000 ends the bulls' narrative; a strong move above 25,180 rewrites it.”
✏️ Disclaimer
This is just my personal viewpoint. Always consult your financial advisor before taking any action.

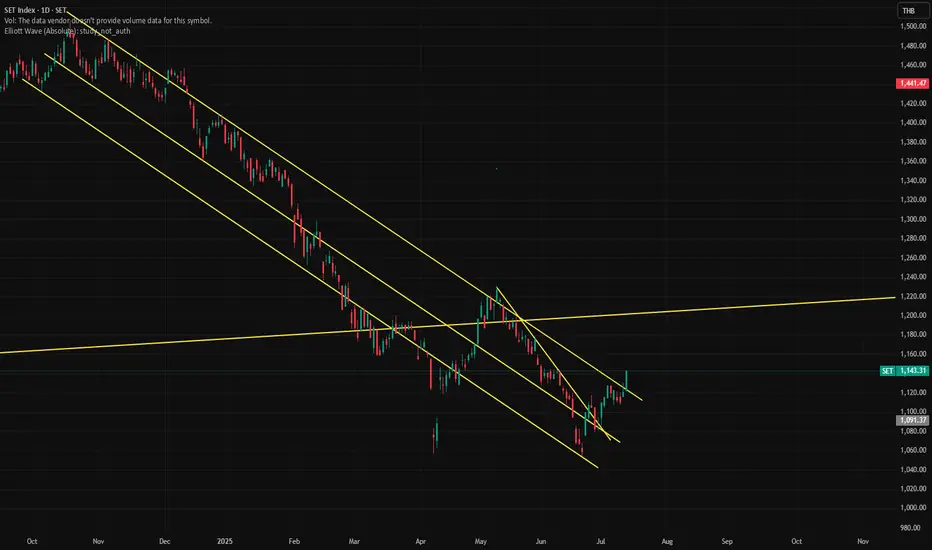
Set Breaking up downtrend channelHi there!!
Set Breaking up downtrend channel , This sign may be similar double bottom pattern ??
Focus and see
bullish on IBEX35I like the growing momentum I'm seeing from the 1h TF. Could possibly be the final bull sweep before this trend channel is broken to meet the ATH. sl around 13.735

HK50 Index Robbery Plan – Bulls in Control, Load Up🚨💸💥**HK50 MONEY HEIST ALERT – Thief Trading Style Entry Plan!**💥💸🚨
"Swipe the Trend, Rob the Risk – The Hong Kong Vault is Open!"
🌍🌎Hey there, Global Money Movers, Heist Planners & Market Robbers!🕵️♂️💰
Welcome to another high-stakes operation brought to you by the Thief Trading Style – where strategy meets chaos, and profits are earned with precision. 🏴☠️📊
🎯 Mission Brief: HK50 Index Robbery – Long Entry Blueprint
Based on our exclusive blend of technical & fundamental analysis, the HK50 (Hong Kong Index) is entering the Loot Zone – bullish bias detected and price action confirming a strategic long opportunity. Here's how we execute the plan:
🔓 ENTRY – The Vault is Open!
🎯 Strike anywhere near recent swing lows/highs on the 15m or 30m timeframe.
💡 Ideal Entry Zones: Closest bullish structure or reversal support.
📌 Tip: Set alerts at key reaction zones – timing is the true thief’s edge.
🛑 STOP LOSS – Escape Hatch Point
🛡️ SL placed below nearest swing low on the 4H timeframe (~23640.0).
💡 Adjust based on your risk tolerance, lot size, and trade stacking.
🏁 TARGET – The Getaway Route
🎯 TP zone: ~25200.0
🚀 Optional: Use Trailing SL to maximize robbery exit on spikes or trap fails.
💬 “Escape before target” if market sentiment flips or volatility surges.
🧲 Scalper Alert: Ride the Bull Only!
💵 Scalping allowed on buy side only.
If you’ve got capital power – go direct. Otherwise, join the swing thieves and ride with momentum. 📈💣
🧠 Why Bullish? | Heist Justification
📊 Current momentum supported by:
🔎 Technical Trend Reversal Patterns
📉 ATR exhaustion near previous downside levels
📰 Positive Macro, Global Cues, & Institutional Sentiment
👉 For the full scoop – combine this with:
📰 COT Data & Market Sentiment
🌐 Intermarket & Geopolitical Outlook
📈 Index-Specific & Seasonal Cycle Studies
Stay ahead, rob smart! 💼💼
⚠️ Risk & News Alert – Don’t Get Caught!
🔔 Avoid entries during major news drops!
✅ Use trailing stop-losses on running trades.
🚷 Protect your loot at all costs – market volatility is the real SWAT team! 🚓
💥Support Our Robbery Crew!
📢 Smash the Boost Button 💣💥 to support the Thief Trading Style revolution!
Together, we rob with discipline, plan with clarity, and exit with satisfaction.
💰Let’s stack profits, not just candles. 📈🤑
📝 Disclaimer:
This is a high-level market outlook, not financial advice. Adjust based on your capital, risk tolerance, and analysis. Always monitor your trades and adapt to the ever-changing market landscape.
Follow for more Heist Plans – this is just the beginning! 🕶️🔐
**See you at the next vault…**🚁💼📈
#ThiefTrading #HK50 #MarketHeist #IndexAnalysis #BullishBreakout #SmartMoney #ScalpersWelcome #SwingTrading #TechnicalAnalysis #RiskReward #TradingViewElite #ProfitWithStyle

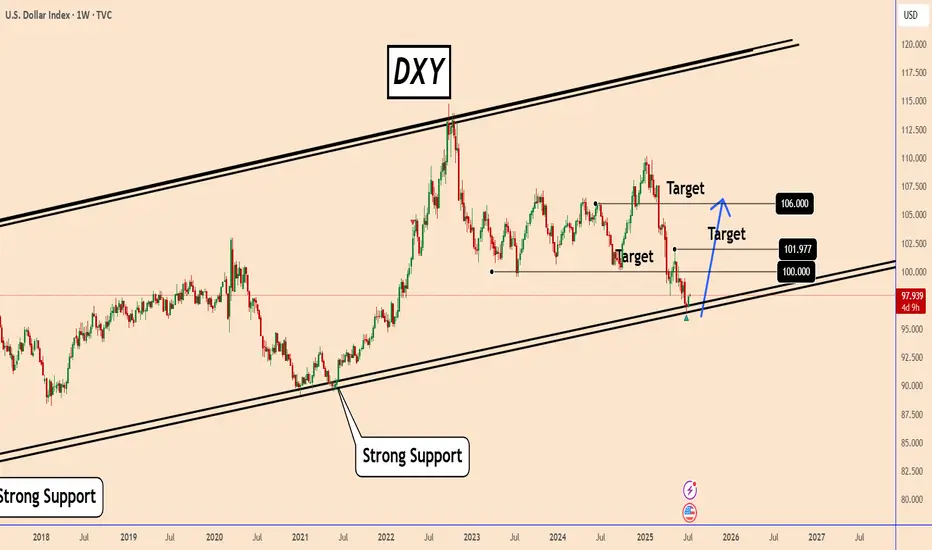
Weekly DXY OutlookWeekly DXY Outlook - Updated
DXY is still bullish and is rising slowly
On the weekly chart, the US Dollar Index (DXY) has reached a critical zone that was last tested in February 2022.
While a rebound is not guaranteed, the fact that the DXY has declined nearly 12% over just six months—despite a resilient U.S. economy—suggests the potential for renewed strength in the dollar.
I think the index could begin a recovery toward key levels at 100.00, 101.97, and possibly 106.00/
It’s worth noting that the broader bearish trend began with the trade tensions initiated during the Trump administration, which strained relations with several major trading partners.
Given that this is a weekly chart, it should be used more as a reference point rather than a trading signal.
You may find more details in the chart!
Thank you and Good Luck!
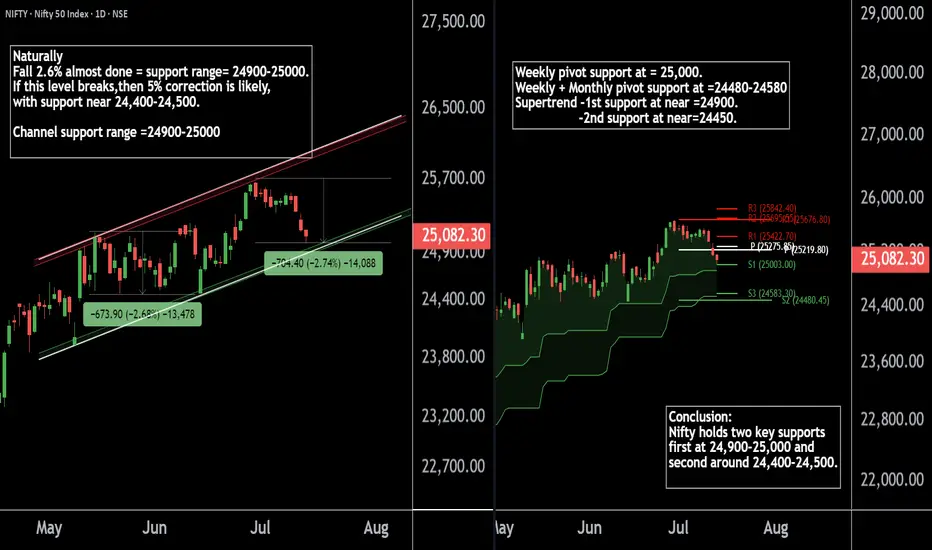
Nifty50's Key Level !! Keep an eye on these levels.Here are two Nifty charts, both on the daily timeframe.
Current Correction:
Nifty has naturally corrected by 2.7%, currently trading in the 24,900-25,000 range.
Weekly Pivot:
The weekly pivot support is positioned at 25,000, providing immediate support.
Support Levels:
First Support: 24,900-25,000 zone.
Second Support: If this level breaks, Nifty may see a 5% correction, with the next support around 24,400-24,500.
If this level sustain we may see higher prices in Nifty 50.
Thank You !!
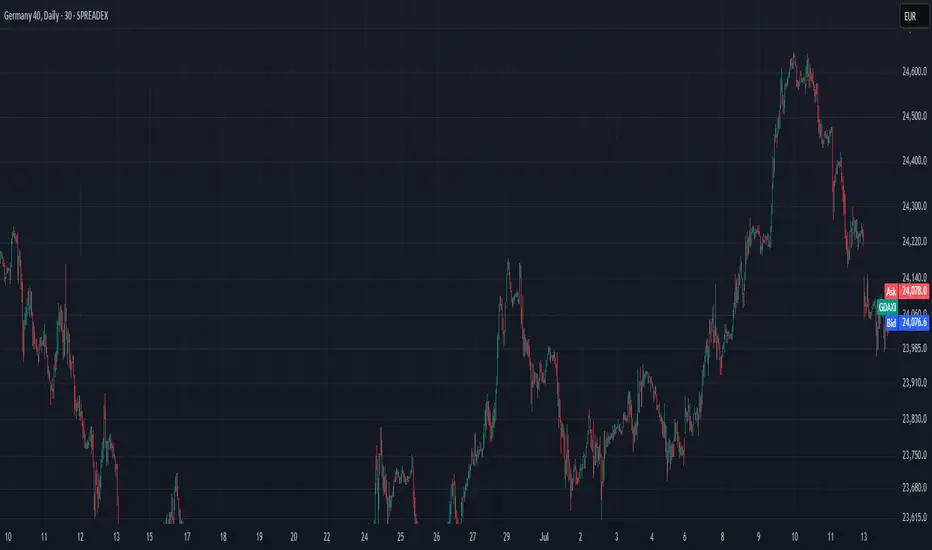
Technical Weekly AnalysisGermany 40 remains in a bullish trend but is currently undergoing a pullback phase. It is trading at 24,080, nearly matching its VWAP of 24,079. The RSI at 53 suggests moderate momentum. Support lies at 23,245, with resistance at 24,590.
The UK 100 continues its new bullish trend into all-time highs and is currently in an impulsive phase. With price at 8,962 above the VWAP of 8,813, it shows strong momentum. The RSI at 63 supports this outlook. Support stands at 8,652 and resistance is at 9,000.
Wall Street remains bullish but is in a pullback phase, trading at 44,192, slightly above the VWAP of 43,871. The RSI at 58 points to sustained buying interest. Support is at 42,404 and resistance is at 45,338.
Brent Crude is in a neutral trend within a ranging phase, trading at 7,058 just above the VWAP of 6,892. The RSI at 55 reflects a balanced market. Support is at 6,402, with resistance at 7,382.
Gold is also in a neutral trend and consolidating in a range. It is priced at 3,371, near its VWAP of 3,329. The RSI at 56 indicates mild bullish interest. Support sits at 3,269 and resistance is at 3,390.
EUR/USD maintains a bullish trend but is currently in a pullback phase. Trading at 1.1683, it is nearly aligned with the VWAP of 1.1690. The RSI at 55 indicates moderate strength. Support is at 1.1542 and resistance is at 1.1853.
GBP/USD is in a bullish trend but undergoing a correction. With price at 1.3485 below the VWAP of 1.3609, momentum appears to be easing. The RSI at 39 supports this softer tone. Support is at 1.3424 and resistance at 1.3793.
USD/JPY is testing the top of its sideways range. Currently at 147.33, it is above the VWAP of 145.41. The RSI at 64 suggests a potential new bullish phase is beginning. Support is at 142.91 and resistance at 147.92.
Inverted H&S PatternThis is a standard H&S pattern. volume is yet to confirm in my view.
if R1 and R2 zone made a breakout than we expect for bullish run as chart pattern suggests.

DXY: The Market Is Looking Up! Long!
My dear friends,
Today we will analyse DXY together☺️
The in-trend continuation seems likely as the current long-term trend appears to be strong, and price is holding above a key level of 97.463 So a bullish continuation seems plausible, targeting the next high. We should enter on confirmation, and place a stop-loss beyond the recent swing level.
❤️Sending you lots of Love and Hugs❤️

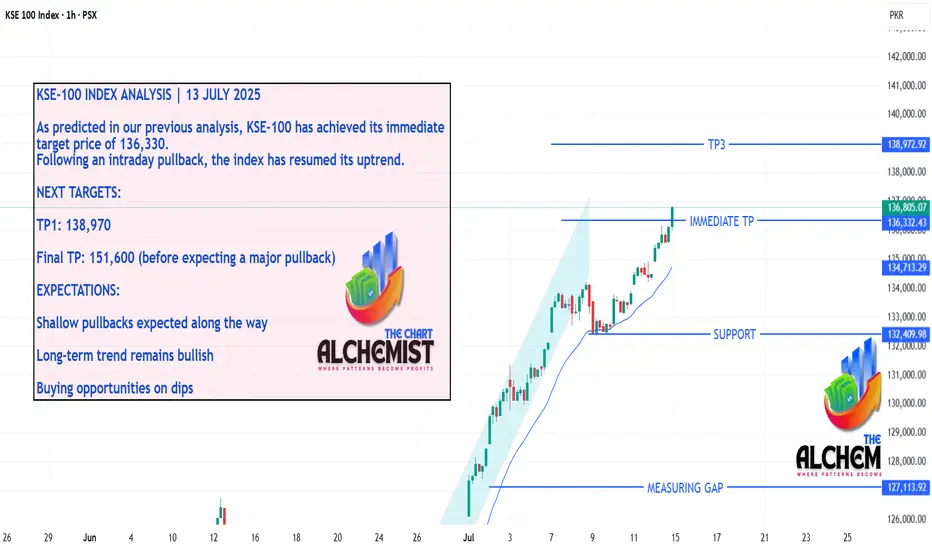
KSE-100 INDEX ANALYSIS | 13 JULY 2025KSE-100 INDEX ANALYSIS | 13 JULY 2025
As predicted in our previous analysis, KSE-100 has achieved its immediate target price of 136,330. Following an intraday pullback, the index has resumed its uptrend.
NEXT TARGETS:
TP1: 138,970
Final TP: 151,600 (before expecting a major pullback)
EXPECTATIONS:
Shallow pullbacks expected along the way
Long-term trend remains bullish
Buying opportunities on dips
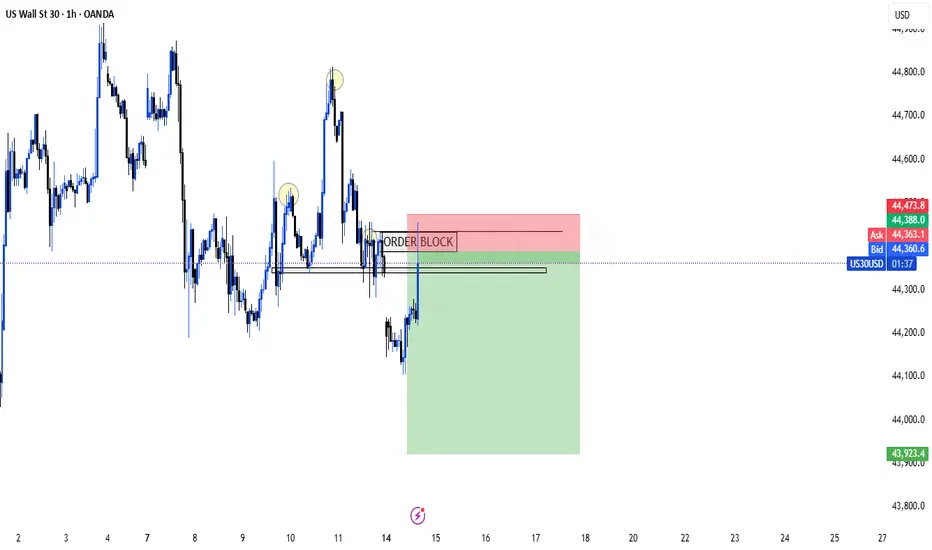
Possible Sell Entry1. CHoC
2. Order Block to be balanced
3. Sell momentum continues
4. H & S pattern also indicating sell
