KSE-100 INDEX ANALYSIS | 13 JULY 2025KSE-100 INDEX ANALYSIS | 13 JULY 2025
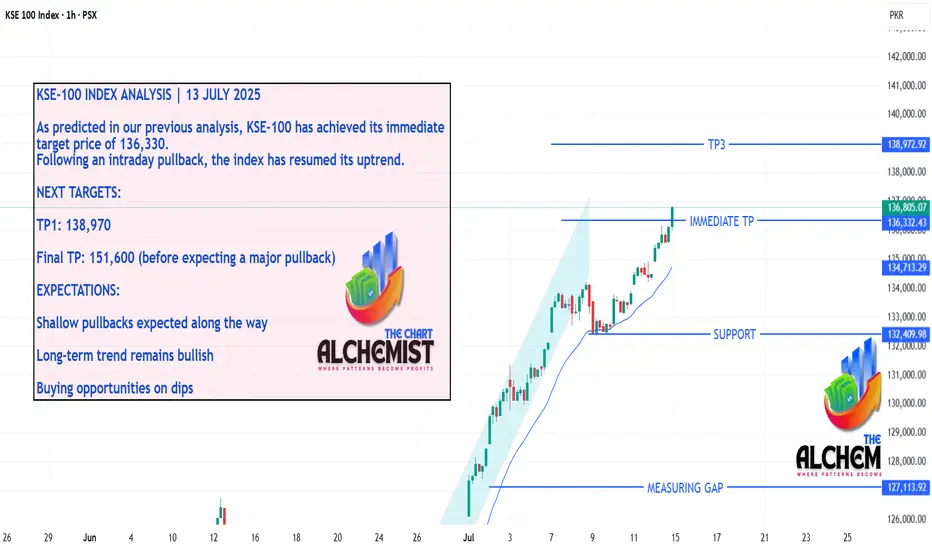
As predicted in our previous analysis, KSE-100 has achieved its immediate target price of 136,330. Following an intraday pullback, the index has resumed its uptrend.
NEXT TARGETS:
TP1: 138,970
Final TP: 151,600 (before expecting a major pullback)
EXPECTATIONS:
Shallow pullbacks expected along the way
Long-term trend remains bullish
Buying opportunities on dips
Market indices
Possible Sell Entry1. CHoC
2. Order Block to be balanced
3. Sell momentum continues
4. H & S pattern also indicating sell

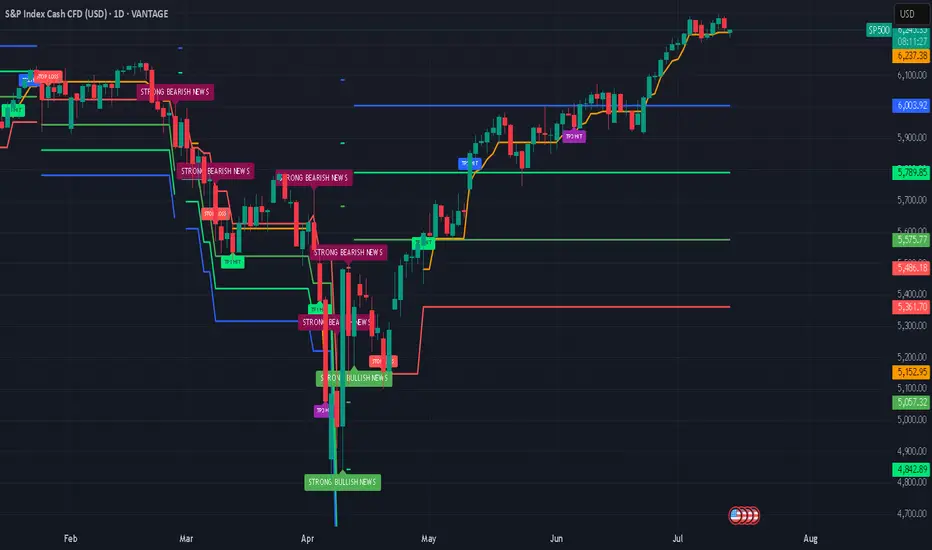
S&P 500: Defying Tariff Headwinds, Breaking RecordsThe S&P 500 has staged a remarkable rally in 2025, shattering all-time highs and capturing global attention. This surge has unfolded despite the negative economic overhang of renewed tariff threats and ongoing trade tensions, raising critical questions for investors: How did the market overcome such headwinds, and what lies ahead for both the short and long term?
The Rally Against the Odds
Tariff Turbulence: Earlier this year, President Trump announced sweeping new tariffs, sparking fears of supply chain disruptions and higher costs for American companies. Historically, such moves have triggered volatility and corrections.
Market Resilience: Despite these concerns, the S&P 500 not only recovered losses from the spring but surged to new record highs, with the index climbing over 23% since April’s lows. Major tech companies, especially those leading in AI and innovation, have been at the forefront of this advance.
Investor Sentiment: The rally has been fueled by optimism around potential Federal Reserve rate cuts, robust corporate earnings, and expectations of long-term economic growth—even as the immediate impact of tariffs remains uncertain.
Short-Term Correction: A Healthy Pause?
While the long-term outlook remains bullish, several indicators suggest the market may be due for a short-term correction:
Narrow Market Breadth: The current rally has been driven by a handful of mega-cap stocks, leaving the median S&P 500 stock well below its own 52-week high. Historically, such narrow leadership often precedes periods of consolidation or pullbacks.
Valuation Concerns: Stock valuations are at elevated levels, and some analysts warn that earnings growth could slow as companies adapt to higher input costs and shifting trade policies.
Correction Forecasts: Some strategists predict the S&P 500 could correct to around 5,250 by the third quarter of 2025, citing factors like slowing consumer spending and persistent policy uncertainty.
Long-Term Outlook: Higher Highs Ahead
Despite the potential for near-term volatility, the long-term trajectory for the S&P 500 remains positive:
Fed Policy Tailwinds: Anticipated rate cuts and lower bond yields are expected to provide further support for equities, encouraging risk-taking and higher valuations.
Corporate Adaptation: Companies are actively offsetting tariff impacts through cost savings, supply chain adjustments, and strategic pricing.
Growth Sectors: Innovation in technology, productivity gains, and deregulation are setting the stage for sustained profit growth, especially in sectors like AI, robotics, and defense.
Key Takeaways for Investors
Stay Disciplined: While a short-term correction is possible, history shows that markets often rebound strongly after periods of volatility.
Diversify Exposure: With market gains concentrated in a few names, diversification and active stock selection are more important than ever.
Focus on Fundamentals: Long-term investors should look beyond headlines and focus on companies with resilient earnings and adaptive business models.
The S&P 500’s ability to break records in the face of tariff headwinds is a testament to the underlying strength and adaptability of the U.S. economy. While short-term bumps are likely, the path ahead still points toward new highs for those with patience and perspective.
This article is for informational purposes only and does not constitute investment advice. Always consult with a financial advisor before making investment decisions.
#spx500 #stockmarket #analysis #economy #us #nasdaq #fed #bonds #rates #trading
DXY Weekly Update — July 14, 2025⌛ Timeframe:
.
📆 Analysis Date: July 14, 2025
.
🎯 Weekly Bias: Bearish-to-Neutral (Potential for retracement or reversal)
🔎 Market Overview:
⬇️ Persistent USD Weakness:
DXY has dropped nearly 10% YTD, marking the steepest half-year decline since 1986.
📉 Rate Cut Expectations:
Markets are pricing in a potential 75bps rate cut by the Fed in H2 2025, pushing yields and the dollar lower.
📦 Trade War Fears:
Renewed tariff risks (targeting EU, Japan, Mexico, South Korea) aren't boosting demand for USD — a signal of lost safe-haven appeal.
⚖️ Central Bank Diversification:
Global reserve managers are rotating into gold and away from USD, weakening long-term structural demand.
🌀 Sentiment & Risk Appetite:
💸 Liquidity Demand is Soft:
DXY is retesting a 4H fair value gap (97.10–97.30), suggesting potential short-term consolidation or correction.
🌍 Risk-On Mood Returns:
According to Goldman Sachs, the USD is trading more like a "risk asset" than a haven, aligning with rising equity appetite.
📉 Technical Landscape:
🟠 4H Structure:
If DXY breaks below 97.00, next support lies at 96.37, followed by 95.50–96.00.
Consolidation expected if price remains within the FVG.
🔻 Key Resistance:
97.70–98.20 zone. A break above this area could change the tone to bullish.
📌 Summary:
🔷 Fundamentals show long-term dollar weakening (rates, trade tension, reserve shifts)
🔷 Sentiment aligns with risk-on appetite and reduced USD demand
🔷 Technicals at critical level; break below 97.00 opens room for correction, break above 97.70 shifts bias bullish
.
.
.
.
🟠 Bias: Bearish to Neutral
Watch Levels: 97.00 support, 97.70–98.20 resistance
⚠️ Note: This analysis is for educational purposes only and is not financial advice. Always apply risk management.
✅ If you like this analysis, don't forget to like 👍, follow 🧠, and share your thoughts below 💬!

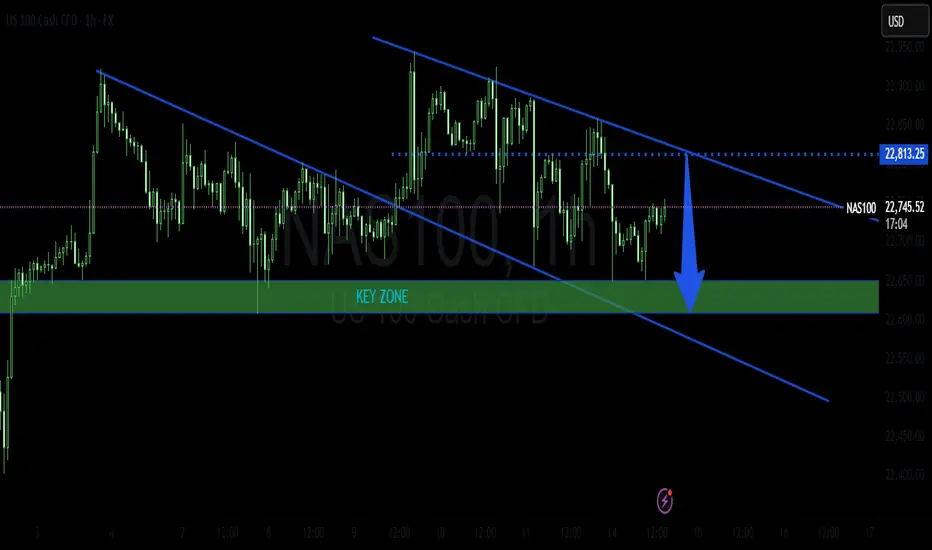
NASDAQ SHORT TRADE PLANThe instrument is trading inside a descending wedge pattern. This pattern has been respected for some time now and I believe it will continue to play.
Please do your own analysis before placing any trades.
Cheers and Happy Trading !!!!
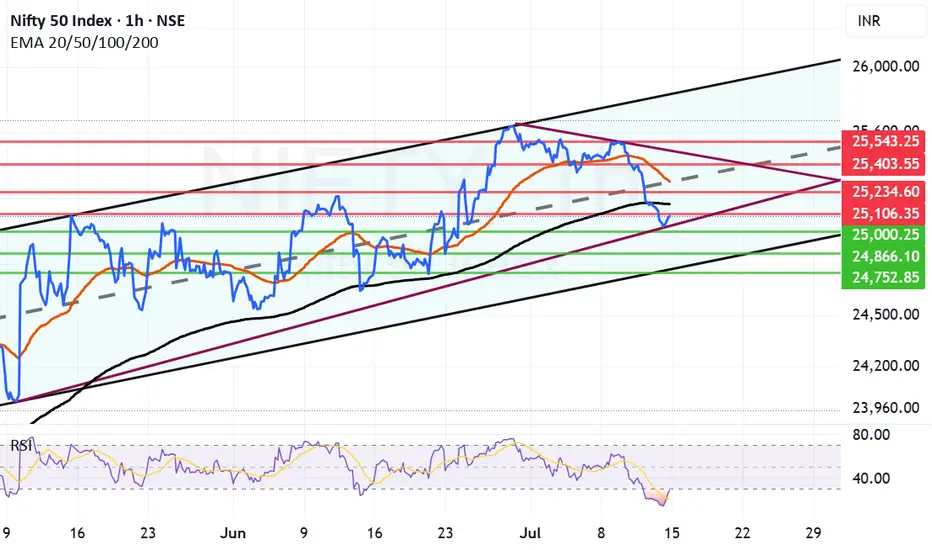
Nifty has taken support at 25K but can the support hold?Nifty today took a meaningful support at 25001 and bounced close to 25082. However ending the was in the negative by 67.55 points. RSI today went as low as 13.52 indication of oversold market. IT was a major drag after result that market did not like.
Now the resistances in front of Nifty are at 25106, Father Line Resistance at 25106, 25234, Mother Line Resistance at 25297, 25403 and finally 25543. Supports for Nifty remain at 25K, 24866 Chanel Bottom support and finally 24752. Below 24752 Bears can totally take control of the market if we reach there.
Things are in balance right now with Mid-cap, Small-cap starting to see some buying. If IT can hold the levels we will see growth from here. If IT index further caves in and other indices do not support we can see a down side. Shadow of the candle right now is neutral to negative.
Disclaimer: The above information is provided for educational purpose, analysis and paper trading only. Please don't treat this as a buy or sell recommendation for the stock or index. The Techno-Funda analysis is based on data that is more than 3 months old. Supports and Resistances are determined by historic past peaks and Valley in the chart. Many other indicators and patterns like EMA, RSI, MACD, Volumes, Fibonacci, parallel channel etc. use historic data which is 3 months or older cyclical points. There is no guarantee they will work in future as markets are highly volatile and swings in prices are also due to macro and micro factors based on actions taken by the company as well as region and global events. Equity investment is subject to risks. I or my clients or family members might have positions in the stocks that we mention in our educational posts. We will not be responsible for any Profit or loss that may occur due to any financial decision taken based on any data provided in this message. Do consult your investment advisor before taking any financial decisions. Stop losses should be an important part of any investment in equity.
NIFTY50.....Are you crazy?Hello Traders,
with an "over-night" delay (for which I apologize), here is a brand-new analysis for NIFTY50!
The N50 has dropped, 'caused by the announced Tariffs for the "BRICS" countries.
The "Orange-man" who took residential at Pennsylvania Avenue at DC announced again tariffs at a record high for the BRICS-countries! Anyway! One step forward, one step back! This is clown's business!
The chart analysis:
N50 dropped to a low @ 25001.95 this morning. Here, a buy-signal occurred that would be activated @ 25109 points. Stop-loss must be set @25100!
The multi-week target, I have announced some weeks ago, are still valid.
While price break below the rising trend-line, connecting the high @25116 and 25222 a first target would be exactly at the level of 25350 (+/-) depending on when and if it will be touched!
In fact, the wave pattern could be also a wave 2, difficult to count, but still possible.
It needs a decline below 23246 points to eliminate this count!
While markets are unpredictable, 'caused by the US tariffs politics, it is very difficult to forecast the moves.
Probably one got argument would be, to pause the trading and wait til markets get less volatile.
That's it for today.
Have a great week.....
Ruebennase
Please ask or comment as appropriate.
Trade on this analysis at your own risk.

GER40 is BullishPrice was in a downtrend, however the bullish divergence with a double bottom reversal formation hints the return of bulls. If previous lower high is broken along with the descending trendline, then we can expect a bullish reversal as per Dow theory. Targets are mentioned on the chart.
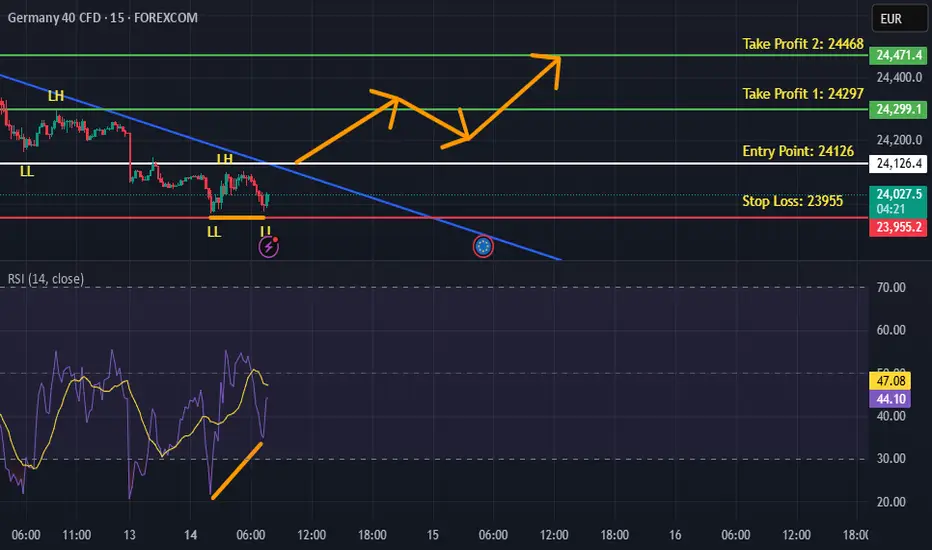
GER40 LongThere are multiple pattenrs on both H1 and M15
This is hitting target 2 of a short on H4
There is a lot of support at the level 24000
All timeframes are oversold with divergence
This is in a strong upward trend
Stop loss of 100 pips

S&P500 Slips Ahead of CPI & Earnings SeasonEquities began the week under pressure, with the S&P 500 dropping 0.5%, slipping below the 6,230-resistance area. Although the Fed minutes released last week indicate that most members are open to cutting rates this year, inflation data and second-quarter earnings could change that trajectory.
Upcoming Events to Watch:
• CPI Release (Tuesday 14:30 SAST): A cooler-than-expected print would support a breakout in risk assets. A hot reading could shift expectations toward policy tightening, weighing on equities.
• Q2 Earnings Season: Major banks including JPMorgan Chase, Wells Fargo, and Citigroup will report this week. Strong earnings may cushion the market, while any weakness could exacerbate volatility.
S&P500 Technical View:
• Immediate Resistance: 6,230
• Potential Upside: A cooler CPI could see the index rally toward 6,290.
• Support Levels: Should inflation surprise to the upside, the index may slide to 6,190, or even 6,150 in extended selling.

NASDAQ At Good Res , Is It A Chance To Sell To Get 200 Pips ?Here is my 4H Nasdaq Chart and my opinion is the price at very interesting selling area for me , this Res Area forced the prices to go down 2 times and i think this third time will be the best one , so i`m waiting the price to go up a little to retest the res one more time and then we can enter a sell trade and targeting from 100 to 200 pips . the only reason to cancel this idea if we have a clear daily closure above my res area .

Nifty holds important support zone.Nifty Analysis:
Support and Upside Targets
Market Recap
- Opening: Nifty opened flat, showing little directional bias at the start.
- Intraday Move: The index was dragged down towards the important support zone of 25,050–25,000
- Bounce: From this support zone, Nifty rebounded and managed to close above 25,080.
Technical Outlook:
Key Support Zone
- Support Range: 25,050–25,000
Significance: This zone has acted as a strong support, with buyers stepping in to defend it.
- Implication: As long as Nifty sustains above this zone, the short-term trend remains positive.
Upside Targets
If Nifty holds above the support:
- Immediate Targets: 25,200 and 25,300 are the next levels to watch for upward momentum.
- Long-Term Targets: 25,500 and 25,700 remain the key targets if the bullish momentum continues.
Summary
- Bullish View: Sustaining above 25,000–25,050 support zone keeps the index in a positive bias.
- Bearish Risk: A decisive break below 25,000 could lead to further downside.
- Strategy: Traders may consider staying long as long as Nifty holds above the support zone, watching for the mentioned targets.
Note: Always use appropriate risk management and monitor for any changes in market sentiment or global cues that may impact index movement.

US30 Bearish Below 44490 – Watching 44180 US30 Analysis
US30 remains bearish below 44490, with downside targets at 44180 and 43960.
A 1H close below 44180 would confirm continuation toward 43630.
To turn bullish, price must break above 44490.
Pivot: 44430
Resistance: 44460, 44550, 44760
Support: 44180, 43960, 43630

SPX500 Formed false breakout Bearish Bias 6,205 SP500 Short-Term Bearish Bias
The SPX500 remains under pressure as it trades below the key resistance level of 6260. Price action suggests a potential rejection from this resistance, signalling a continuation of downside momentum.
This bearish sentiment is further fuelled by recent tariff escalations by President Trump, which are weighing heavily on investor sentiment across global indices.
You can see more details in the chart Ps Support with like and comments for more analysis Thanks for supporting.

NASDAQ at Risk – Tariffs Pressure Tech IndexUSNAS100 – Market Outlook
The index is currently in a sensitive zone, heavily influenced by ongoing tariff tensions. If the current geopolitical pressure continues, it may fuel bearish momentum across the tech-heavy index.
To regain a bullish outlook, we need to see signs of negotiation or de-escalation, which could stabilize the price and lead it toward 23010 and 23170.
However, as of today, the market appears to be setting up for a correction, potentially dipping to 22815, followed by a deeper bearish move targeting 22420.
Support Levels: 22615 – 22420
Resistance Levels: 22905 – 23010

NAS100 - Stock market awaits inflation!The index is located between EMA200 and EMA50 on the one-hour timeframe and is trading in its ascending channel. Maintaining the ascending channel and confirming it after breaking the downtrend line will lead to the continuation of the Nasdaq's upward path to higher targets (23000), but in case of no increase and channel failure, one can look for selling positions up to the target of 22500.
Last week, the U.S.dollar demonstrated strong performance against major global currencies, despite having experienced some weakness since April 2, when President Donald Trump announced retaliatory tariffs against key U.S. trading partners. However, these tariffs were ultimately postponed, and only a baseline 10% tariff was maintained.
The 90-day deadline for implementing these tariffs, originally set to expire on Wednesday, has now been extended to August 1. Nevertheless, Trump surprised the markets this week by announcing a 25% tariff on imports from Japan and South Korea, threatening a 50% tariff on Brazilian goods, and implementing lower tariffs for other partners. These developments triggered a shift of capital toward the U.S. dollar as a safe-haven asset, boosting its strength.
This marks a notable shift in how the dollar is reacting to tariff tensions. In April, fears of an economic slowdown weighed on the greenback, but now it is gaining traction as a refuge in times of uncertainty, particularly as inflation risks mount—contributing to choppy moves in U.S. equity markets.
As is customary, the earnings season will kick off with reports from major banks and financial institutions. On Tuesday, JPMorgan is set to release its financial results, opening the floodgates for a wave of earnings reports. The image referenced lists several other companies, many of which are market heavyweights.
Following a relatively quiet week due to Independence Day holidays and a lack of major economic data, markets are now gearing up for a steady stream of reports in the coming days. Tuesday will bring the Consumer Price Index (CPI) for June along with the Empire State manufacturing survey. On Wednesday, the spotlight will shift to the Producer Price Index (PPI) for the same month. Then, on Thursday, traders will focus on June’s retail sales report, the Philadelphia Fed’s manufacturing survey, and the weekly jobless claims figures.
The week will conclude with two additional reports on Friday: the June housing starts data and the preliminary reading of the University of Michigan’s Consumer Sentiment Index.
June’s CPI report is expected to reflect an uptick in inflation, potentially driven by Trump’s tariff policies. Some analysts believe the tariffs will have an “undeniable” impact on prices, though others remain uncertain.
Despite concerns from both experts and consumers that businesses might pass tariff costs on to buyers, inflation has so far remained relatively moderate this year. The effects of Trump’s aggressive tariff campaign on hard economic data have not yet been clearly reflected—but that may be about to change.
According to Bloomberg’s consensus forecasts, as cited by Wells Fargo Securities, the CPI is expected to show a 2.7% year-over-year increase in June—up from 2.4% the previous month. Meanwhile, core CPI, which excludes volatile food and energy prices, is projected to have risen 3% over the same period, compared to a prior gain of 2.8%.
If these numbers come in as expected, it could support the forecasts of analysts who have warned that the costs of Trump’s heavy import tariffs would eventually show up on price tags, as manufacturers, importers, and retailers pass along the burden through the supply chain. Since taking office, Trump has imposed a wide array of tariffs, including a 10% levy on most imports, a 25% duty on foreign automobiles, and tariffs exceeding 50% on Chinese products.

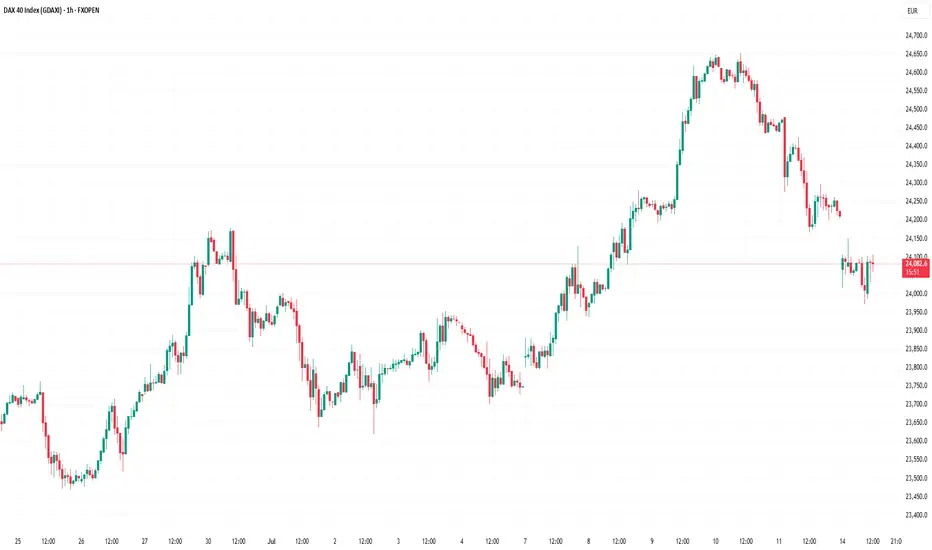
DAX Stock Index Declines Amid Trump Tariff ThreatDAX Stock Index Declines Amid Trump Tariff Threat
The German stock index DAX 40 (Germany 40 mini at FXOpen) is showing bearish momentum at the start of the week. This may be driven by a combination of factors, the most significant of which is the threat of tariffs on Europe from the United States.
According to Reuters, US President Donald Trump has announced a 30% tariff on most goods from the EU, set to come into effect next month. However, the decision is not yet final. Analysts caution against premature panic, suggesting that negotiations could still result in a trade agreement — nonetheless, the chart reflects a sense of unease among investors.
Technical Analysis of the DAX 40 Chart
The price surge in July above the previous all-time high near the 24,500 level appears to be a false bullish breakout — a sign of market weakness.
Buyers may hope that the market will find support at the former resistance line (marked in red), drawn through the local highs of June.
However, if news surrounding the US–EU negotiations turns negative, the DAX 40 index could fall towards the 23,650–23,750 support area, which is reinforced by the lower boundary of the medium-term ascending channel.
This article represents the opinion of the Companies operating under the FXOpen brand only. It is not to be construed as an offer, solicitation, or recommendation with respect to products and services provided by the Companies operating under the FXOpen brand, nor is it to be considered financial advice.
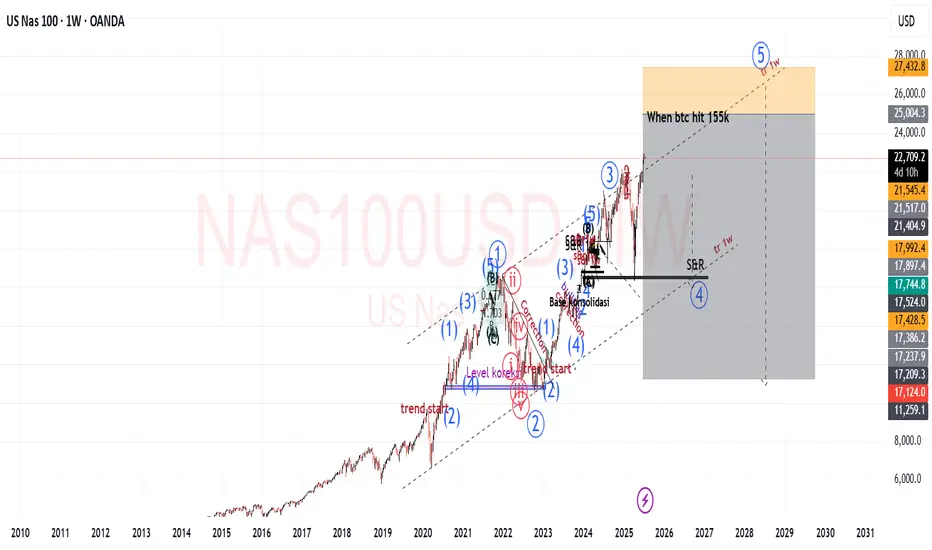
US100 (Nasdaq 100) - Future Outlook (as of mid-July 2025)The US100, which is heavily concentrated in technology and growth companies, has been a significant driver of overall market performance in recent times. Its future trajectory is intricately linked to a combination of macroeconomic trends, corporate earnings, and evolving technological narratives.
Key Factors Shaping the Outlook:
Monetary Policy and Inflation Dynamics:
Cooling Inflation: If inflation continues to moderate (as indicated by CPI, PCE, and other economic data), central banks, particularly the U.S. Federal Reserve, will have more flexibility to consider easing monetary policy.
Interest Rate Expectations: Lower interest rates are generally a boon for growth stocks. They reduce the cost of borrowing for companies and increase the present value of their future earnings, which makes their (often higher) valuations more palatable. Conversely, any resurgence in inflation that forces a "higher for longer" interest rate stance could put significant downward pressure on the US100. As of mid-2025, the market has largely priced in the expectation of potential rate cuts later in 2025 or early 2026, but this remains highly data-dependent and subject to change with each new economic report.
C orporate Earnings and AI Enthusiasm:
Tech Earnings Season: The performance of the major tech titans within the Nasdaq 100 (e.g., Apple, Microsoft, Amazon, Google, Nvidia, Meta, Tesla) during their quarterly earnings reports will be critical. Continued strong earnings beats, particularly from companies that are leading the charge in Artificial Intelligence (AI), will reinforce investor confidence and support higher valuations.
Artificial Intelligence (AI) Narrative: The intense excitement and significant investment surrounding AI remain a powerful tailwind for the US100. Companies demonstrating clear pathways to monetize AI, or those establishing dominant positions in AI infrastructure and applications, are likely to continue seeing robust performance. However, any signs of the AI narrative losing steam, or a perception of an AI "bubble," could trigger profit-taking or a broader market correction.
Economic Growth and Consumer Behavior:
U.S. Economic Health: A resilient U.S. economy, characterized by healthy GDP growth and a strong labor market, provides a conducive environment for corporate revenues. A "soft landing" scenario (where inflation is tamed without triggering a recession) is the most favorable outcome for the US100.
Consumer Spending: Strong consumer confidence and sustained spending directly benefit sectors like e-commerce, software services, and consumer electronics, which are heavily represented in the Nasdaq 100.
Valuation Considerations:
While many Nasdaq 100 companies have delivered impressive earnings growth, their valuations (e.g., P/E ratios) are, for some, elevated compared to historical averages. This implies that there might be less margin for error in future earnings reports or unexpected shifts in the economic landscape. A "valuation reset" could occur if growth projections fail to materialize or if interest rates remain higher than currently anticipated.
Geopolitical and Global Factors:
Global Trade & Geopolitics: Ongoing global trade dynamics, geopolitical tensions (e.g., US-China relations, regional conflicts), and potential supply chain disruptions can introduce unforeseen volatility and impact global economic growth, which, in turn, affects the predominantly international-facing tech sector.
Overall Future Outlook (from a mid-July 2025 perspective):
The US100's future outlook appears cautiously optimistic, primarily driven by the enduring strength of underlying technology trends and the transformative potential of AI. The index has demonstrated remarkable resilience and continues to be favored by growth-oriented investors.
Upside Potential: Could be fueled by sustained strong earnings from its tech giants, especially those leading in AI, coupled with clear indications of forthcoming interest rate cuts.
Downside Risks: The index remains highly susceptible to shifts in interest rate expectations (e.g., if inflation proves stickier than anticipated), any disappointments in high-profile tech earnings, or a broader economic downturn. Given its concentration in high-growth, high-beta stocks, the US100 is prone to more significant fluctuations in both upward and downward market moves compared to broader, more diversified indices.
Investors and traders will be closely monitoring key economic data (inflation, employment), central bank communications, and the performance of bellwether tech companies for crucial clues about the index's direction.
⚠️ Disclaimer: This post is educational content and does not constitute investment advice, financial advice, or trading recommendations. The views expressed here are based on technical analysis and are shared solely for informational purposes. The stock market is subject to risks, including capital loss, and readers should exercise due diligence before investing. We do not take responsibility for decisions made based on this content. Consult a certified financial advisor for personalized guidance
For those interested in further developing their trading skills based on these types of analyses, consider exploring the mentoring program offered by Shunya Trade.
I welcome your feedback on this analysis, as it will inform and enhance my future work

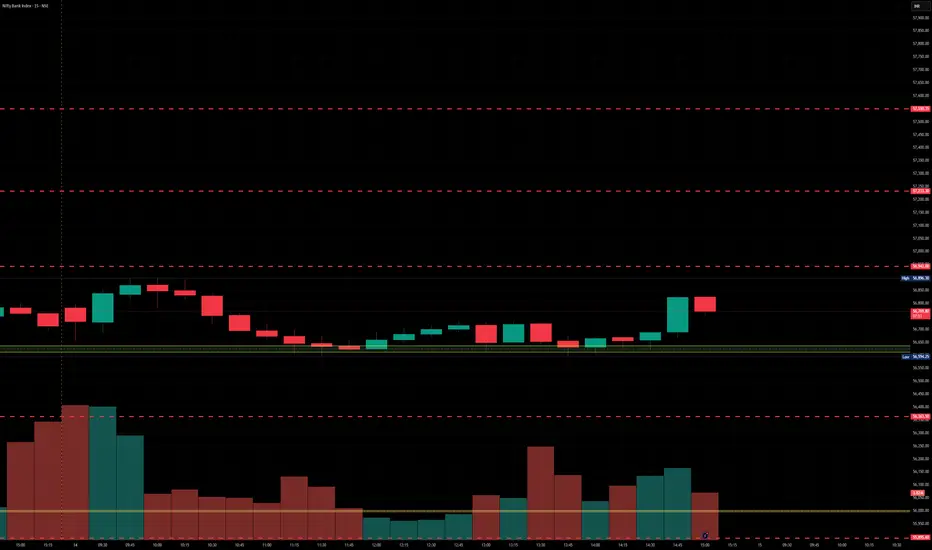
BankNifty levels - Jul 15, 2025Utilizing the support and resistance levels of BankNifty, along with the 5-minute timeframe candlesticks and VWAP, can enhance the precision of trade entries and exits on or near these levels. It is crucial to recognize that these levels are not static, and they undergo alterations as market dynamics evolve.
The dashed lines on the chart indicate the reaction levels, serving as additional points of significance. Furthermore, take note of the response at the levels of the High, Low, and Close values from the day prior.
We trust that this information proves valuable to you.
* If you found the idea appealing, kindly tap the Boost icon located below the chart. We encourage you to share your thoughts and comments regarding it.
Wishing you successful trading endeavors!
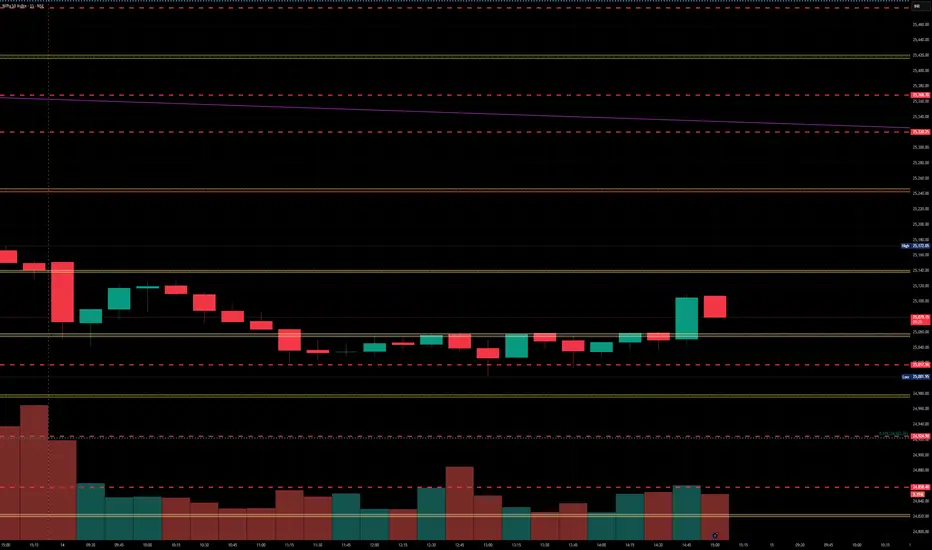
Nifty levels - Jul 15, 2025Nifty support and resistance levels are valuable tools for making informed trading decisions, specifically when combined with the analysis of 5-minute timeframe candlesticks and VWAP. By closely monitoring these levels and observing the price movements within this timeframe, traders can enhance the accuracy of their entry and exit points. It is important to bear in mind that support and resistance levels are not fixed, and they can change over time as market conditions evolve.
The dashed lines on the chart indicate the reaction levels, serving as additional points of significance to consider. Furthermore, take note of the response at the levels of the High, Low, and Close values from the day prior.
We hope you find this information beneficial in your trading endeavors.
* If you found the idea appealing, kindly tap the Boost icon located below the chart. We encourage you to share your thoughts and comments regarding it.
Wishing you success in your trading activities!
NAS100 Nasdaq Range-Bound: What Traders Should Watch Next US100I'm currently keeping a close eye on the Nasdaq 🧠📊, which is trading within a range-bound structure 📉📈. While we’re seeing some bullish momentum on the NAS100 4-hour chart today ⏱️📈, it’s nothing particularly strong or decisive just yet. I’m waiting for a clear break 🔓 either above or below this current range before considering any trading opportunities 🎯.
In this US100 chart 🖼️, I’ve highlighted key components such as price action, market structure, the prevailing trend, and other important elements of technical analysis 🧩📐.
⚠️ Please remember: this is a market analysis and reflects my personal opinion — not a trade recommendation. Always do your own due diligence 🕵️♂️ before making any trading decisions. This is not financial advice.

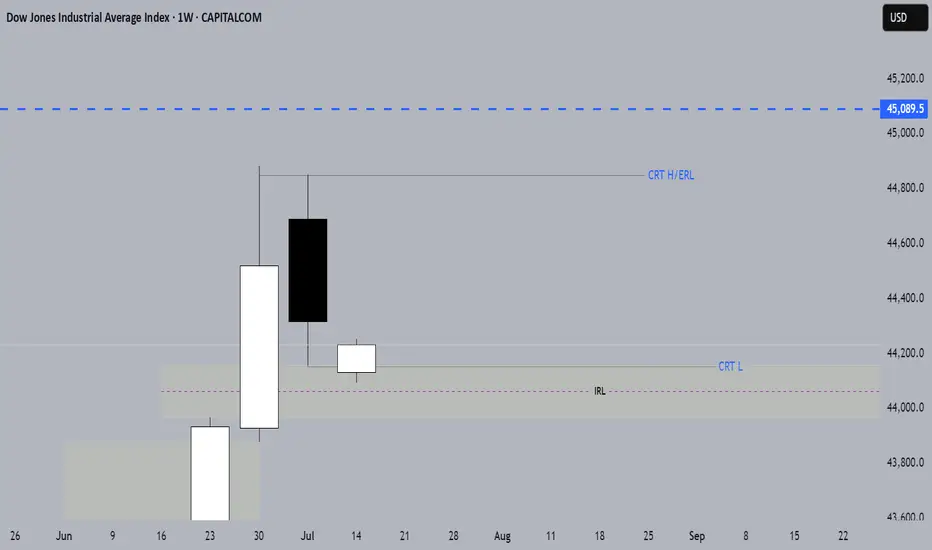
US30 BULLISH/ CRT, ERL&IRL CONFIRMATIONUS30 TO 45089.5
July is historically one of the Dow’s best-performing months.
WEEKLY CRT
IRL TO ERL