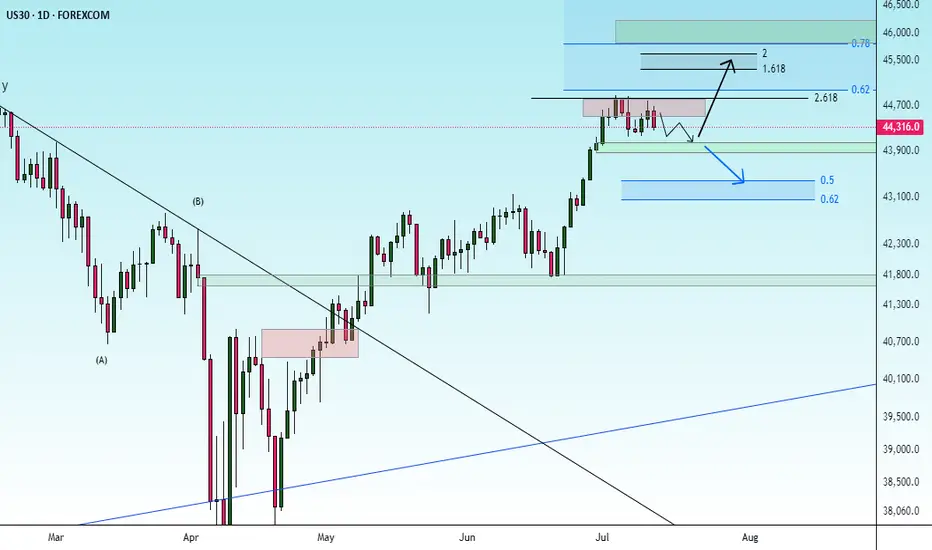
SP500, above the GAP bullish, below the GAP…As simple as it can be. Below the GAP, very bearish.
Ideally, a sharp move down would confirm
My bias.
Market indices

Dollar Index Seems BullishFrom the previous week candle we see that Dollar Index has closed bullish. And in this scenario we can expect Dxy to go further higher. It has hit the previous week high and touched supply zone residing above. The two possibilities have shown in the chart are
1: After touching supply zone we expect to have deeper pullback.
2: It will have short retracement and then continues hgiher.

Crystal ball market Crystal ball market ..market insights are invaluable! Their team provides actionable advice and their customer service is top-notch. A trusted broker in this industry!

DXY Previous weeks analysis and July 13 week ahead ideasDXY
July 13
July 7 to 11 DELIVERY NOTES
I suspected that price would gravitate for higher prices in last Sundays analysis, celebrate on
*up closed candle on the weekly, rebalancing SIBI from June 23 week
*Price retraced to close on equilibrium on the current range
*Monday delivered an expansion
*Tuesday retraced to Monday CE of the daily candle
*Wednesday consolidation
*Thursday retraced to a discount then reversed to take Mondays buy stops
*Friday expansion to make the high of the week closing on the CE of the FVG from Wed June 25
July 14 to 18 Ideas
Bear bias
*Since July 2 Price has been seeking higher prices, further example of trending market
*Price reaching equilibrium on the HTF range and buy side taken last week
*I suspect that price will retrace for sell side liquidity this week
*I anticipate for Price to gravitate towards the EV at 97.430 for the low target this week, possibly the noted equal lows from Monday July 7
*Friday's delivery was a in consolidation pattern
*Sundays delivery could gravitate to the noted equal highs and noted FVG
*I suspect that Price will expand to seek lower Prices for Mondays delivery
*Price expand higher in Sundays delivery, we could see Price retrace Fridays in FVG
No News Monday and Friday

DXY HEAD & SHOULDER TARGET INSIGHT? The dollar index has printed a head & shoulder pattern on the hourly chart and while it's in resistance zone of initial target, there is momentum building up to push through to next target of 97.912. This is supported by a golden cross on the 1H timeframe. The target at 97.912 also closes a window that was left open on June 24th, 2025. This trade has a low risk to high reward ratio. Cheers and Best of trading to everyone

$SPXSP:SPX Update:
Rumors of Powell possibly resigning as Fed Chair have created uncertainty among buyers.
But if inflation stays low even with tariffs we might see longer holds.
If Powell does step down, markets could actually rally on hopes of upcoming rate cuts.
📉📈
Now we wait for the inflation report…
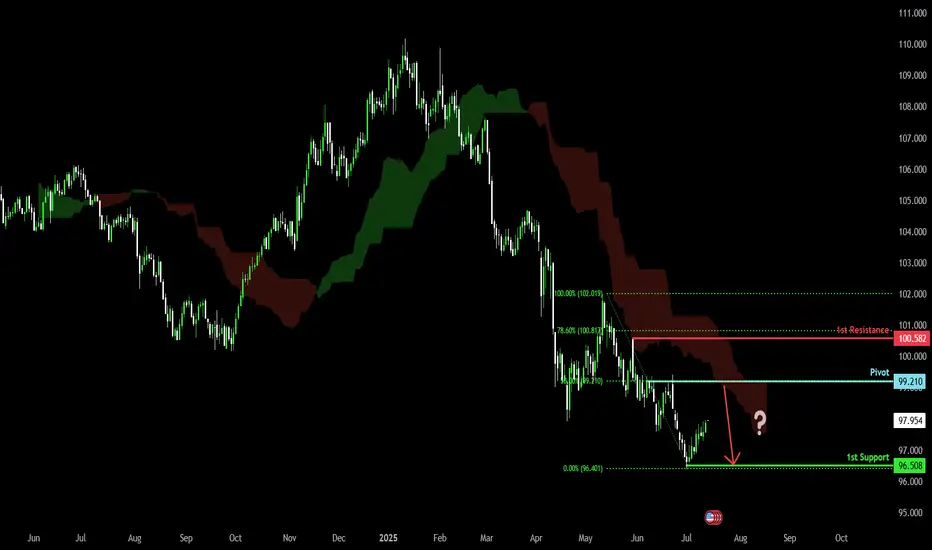
Bearish continuation?US Dollar Index (DXY) is risng towards the pivot which is a pullback resistance and could drop to the 1st support.
Pivot: 99.21
1st Support: 96.50
1st Resistance: 100.58
Risk Warning:
Trading Forex and CFDs carries a high level of risk to your capital and you should only trade with money you can afford to lose. Trading Forex and CFDs may not be suitable for all investors, so please ensure that you fully understand the risks involved and seek independent advice if necessary.
Disclaimer:
The above opinions given constitute general market commentary, and do not constitute the opinion or advice of IC Markets or any form of personal or investment advice.
Any opinions, news, research, analyses, prices, other information, or links to third-party sites contained on this website are provided on an "as-is" basis, are intended only to be informative, is not an advice nor a recommendation, nor research, or a record of our trading prices, or an offer of, or solicitation for a transaction in any financial instrument and thus should not be treated as such. The information provided does not involve any specific investment objectives, financial situation and needs of any specific person who may receive it. Please be aware, that past performance is not a reliable indicator of future performance and/or results. Past Performance or Forward-looking scenarios based upon the reasonable beliefs of the third-party provider are not a guarantee of future performance. Actual results may differ materially from those anticipated in forward-looking or past performance statements. IC Markets makes no representation or warranty and assumes no liability as to the accuracy or completeness of the information provided, nor any loss arising from any investment based on a recommendation, forecast or any information supplied by any third-party.
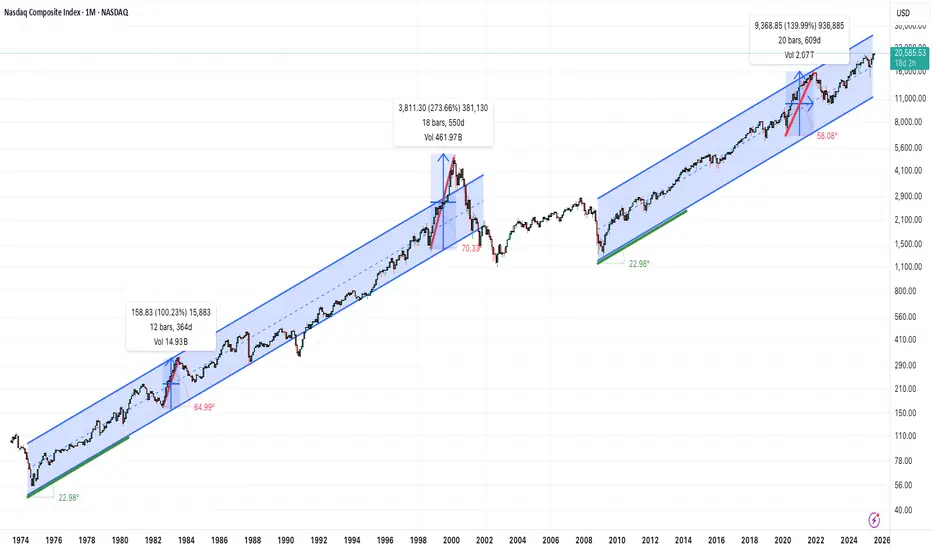
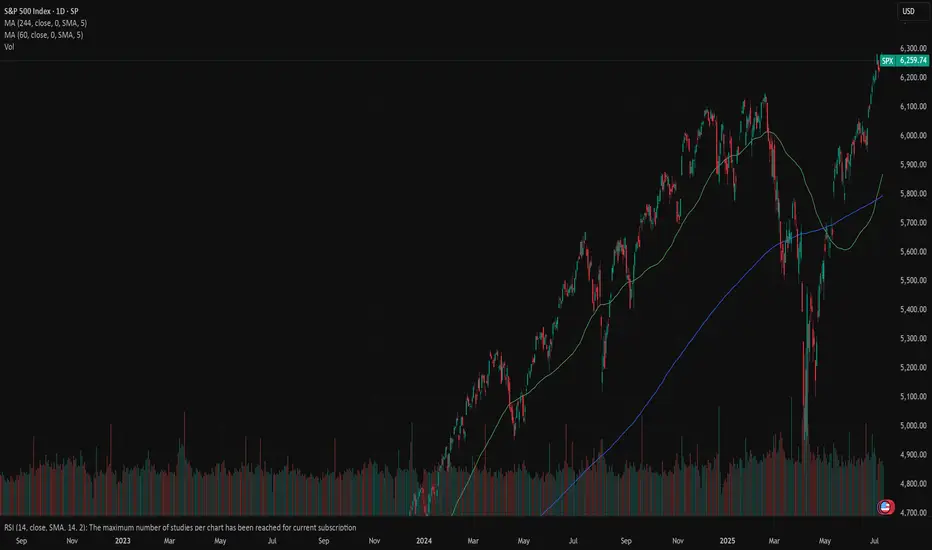
Is the Nasdaq in a bubble?On the monthly timeframe, there are no signs of an over-extended, parabolic condition for the Nasdaq Composite(IXIC).
It's interesting to note that for a 25 year period from 1974 to 1999 the overall trend was roughly a positive 23 degree angled climb. We see that again in the current 16 year trend that started in 2009.
Much steeper parabolic periods can be seen in shorter time frames like the 1998-2000 move, where the angle reached 70 degrees. That didn't end well. It's also worth noting that in 1982 and 2020 we saw similar behavior, though slightly less frothy. Both of those periods were also followed by significant retracements.
Maybe we are at the beginning of one of those multi-month, over-extended runs. But not seeing it today. If we are trading at 45,000 or more in 2026, that's a different story...
possibility of downtrendIt is expected that the upward trend will advance to the specified resistance range and then we will see a change in trend and the beginning of the downtrend.
If the index crosses the resistance range and consolidates above this range, the continuation of the upward trend will be likely.

trade with the trend The daily is going up, so we clearly should look for longs for better probabilities in our favor, and when the price approaches this level, I will buy
correctionIt is expected to fluctuate within the current support level and then continue the upward trend.
If the index breaks through the green support level, the correction to the next support level is possible.
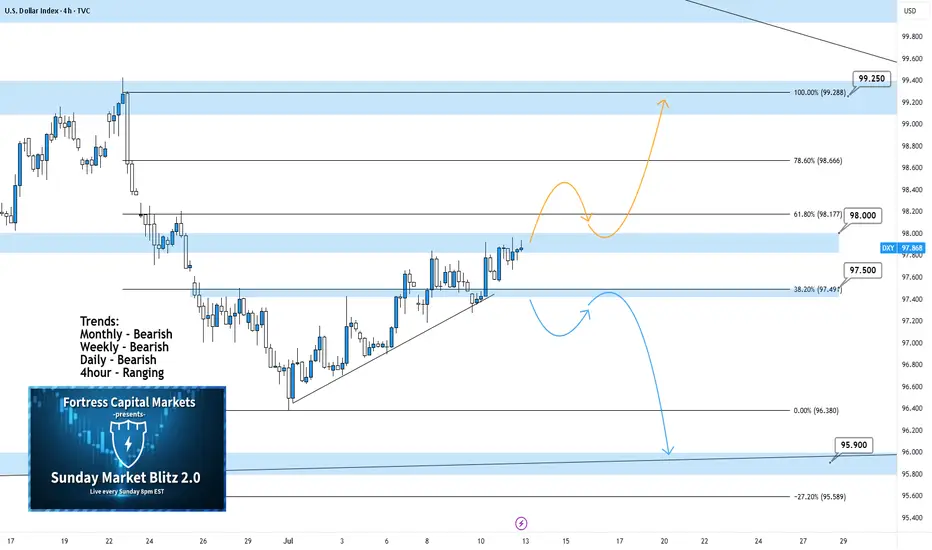
DXY 4Hour TF - July 13th, 2025DXY 7/13/2025
DXY 4hour Neutral Idea
Monthly - Bearish
Weekly - Bearish
Dailly - Bearish
4hour - Ranging
Keep in mind, we analyze and follow DXY more so as an indicator. The USD makes up for a large portion of trade so it makes sense to analyze it.
Going into this week we can see DXY made an attempt to push higher. Where it closed on Friday is a major zone around 98.000. We’re still majorly bearish on higher time frames so we will keep that in mind throughout this week.
As always, we will mark up two potential paths for this week, they are as follows:
Bullish Breakout - The two main zones we want to bring out attention to are 98.000 resistance and 97.500 support. We will have to wait until price action leaves this area to spot a high quality setup. Look for a convincing push above 98.000 resistance followed by a retest of 98.000 but as support. Look for a higher low to form with bullish confirmation to long on.
Bearish Continuation- Going bearish is still very possible we just need to clear 97.500 support first. Look for a break below 97.500 with a confirmed lower high and convincing bearish setups to short on.

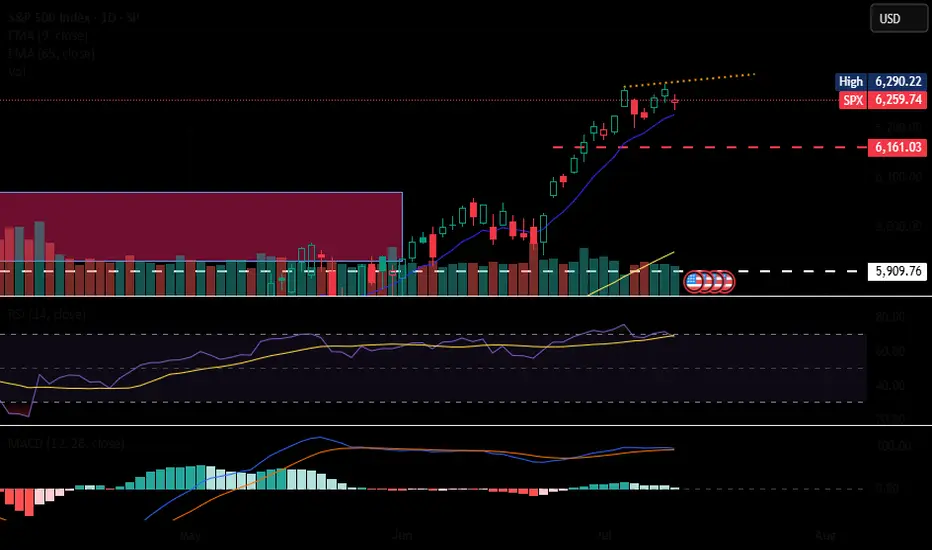
SPX: earnings sentiment aheadPrevious week was another optimistic week on financial markets. Regarding the approaching deadline for a delay in the application of trade tariffs set by the US Administration, which came due on July 9th, the market did not show much of a concern. The green trend line of the S&P 500 continued during the week, where the index managed to reach another new all time highest level on Thursday, at 6.290. During the previous week there has not been any currently important US macro data posted, in which sense, the market sentiment remained optimistic. However, Friday's news regarding trade tariffs spoiled a bit of an up-trend, so the index ended the week, just a bit lower from its ATH level, at 6.259.
Weekly tariffs news include a 35% imposed tariffs on imports from Canada, and 50% on goods imported from Brazil in the U.S. There are also some comments on a potential increased universal 10% tariff on the majority of other nations, noting 15% and 20%, as well as a 50% tariff on copper. Analysts are noting that the market is already adjusted to the comments regarding trade tariffs, in which sense, there are no more strong market reactions on any incoming news.
The week ahead brings some important US macro data, as well as gearing up for the earnings season, starting with major banks like JPMorgan. The June inflation data as well as PPI will be posted in the week ahead, closing with University of Michigan Consumer Sentiment. This data might bring back some volatility to the S&P 500, however, the general investors sentiment remains positive at this moment.
Nifty analysis as of 13/07/2025Nifty analysis as of 13/07/2025
nifty
banknifty
niftyjr
dji
nasdaq
etc etc

US500 Bulls Assemble | Breakout Heist Strategy📈🚨 MASTER HEIST PLAN: “SPX500 ROBBERY – THIEF TRADING STYLE 🔥💸” 🚨📈
(The Ultimate Long Strategy Blueprint for Smart Day/Swing Traders)
🌍 Greetings to All Market Bandits, Bullish Burglars, and Chart Snipers!
Hola! Bonjour! Ola! Hallo! Marhaba! 🙌
🦹♂️This is your friendly chart thief checking in with the latest SPX500/US500 masterplan!
This isn’t just a trade—it’s a heist 🎯. We’re not here to participate, we’re here to dominate! Welcome to the Thief Trading Style, where we map, trap, and snatch those pips with ruthless precision. 🧠🔍💰
🚀 THIEF TRADE SETUP - SPX500/US500
A mix of technical sniper entries + fundamental black ops analysis = 💸 Maximum Extraction. 💸
🎯 ENTRY PLAN: THE BREAKOUT HEIST
📍Buy Entry Zone: Wait for the clean breakout + candle close above 6270.00.
"The vault opens once we clear that wall. Let the bullish getaway begin!" 💥🚪📈
🛠️Thief Tips for Entry:
Use Buy Stop Orders above resistance levels.
OR layer in Buy Limit Orders near recent pullbacks (15/30m swing zones) using DCA Style (Dollar Cost Average layering like a pro).
Want stealth mode? Set that alert (alarm), and strike when the breakout sings. 🔔🎯
🛑 STOP LOSS – PROTECT THE LOOT
🧨Set your SL smart—beneath the nearest swing low using the 2H timeframe for stronger structure.
💬 “Look, don’t gamble. A thief knows when to run. Set that stop where I showed ya, or risk losin’ the bag.” 💼💣
❗Your SL should reflect your risk per trade, lot size, and number of entries. It’s your getaway plan—don’t mess it up.
💥 TARGETS – WHERE WE CASH OUT
🏴☠️Primary Take Profit (TP1): 6310.00
🏴☠️Secondary Take Profit (TP2): 6370.00
💹 Scalp Traders: Stick to the Long Side Only. Ride the momentum, but use trailing SL to lock it in.
🔍 THIEF FUNDAMENTAL INTEL: WHY THIS IS OUR MOMENT
Current SPX500 bullishness driven by:
✅ Positive macro & geopolitical tailwinds
✅ Institutional positioning (COT reports)
✅ Intermarket analysis showing strong correlations
✅ Momentum building with sentiment and volume
📌 Stay sharp—check all your fundamental reports, news catalysts, and sentiment tools before executing your move. Smart thieves plan every detail. 🎓📊
⚠️ NEWS RELEASE REMINDER
📢 News = Chaos. Don’t get caught in the spray:
🔒Avoid entering trades just before big announcements.
🚀 Use Trailing SL to secure profit if you're already in.
Stay agile. Stay smart. Stay rich. 💼🚁
❤️ SUPPORT THE HEIST – HIT THAT BOOST BUTTON!
👊 Liked the plan? Hit the Boost to join the elite robbery crew.
Every boost fuels the mission. Every like sharpens the strategy. Let's build a team of smart, profitable traders. 🚀💸🔥
🧠 Remember: This is general analysis – not financial advice. Manage your risk like a true thief. Stay updated. Adapt fast. Don't get caught. 🕵️♂️
🎉See you in the next Heist Plan! Keep your tools sharp, your charts cleaner, and your profit bags fatter. 🤑🔥

JP225 Long Trap or Bull Escape? Heist in Motion.🦹♂️🎯 JP225 Ninja Heist: Breakout Loot Plan 💥💰 (Long Game Playbook)
🌟Hi! Hola! Ola! Bonjour! Hallo! Assallamu Allaikum!🌟
Dear Money Makers, Market Raiders & Silent Robbers, 🤑💰💸✈️
It’s time to gear up for the ultimate breakout heist on the JP225 / NIKKEI Index CFD Market. Based on my 🔥Thief Trading style🔥—a mix of slick technical strategy and deep fundamental recon—this operation is primed for a bullish break-in.
🧠 Plan of Attack:
Our team is targeting a long-side entry only, aiming to loot the market before it hits the Electric Trap Resistance Zone ⚡—a known danger zone where big bears lie in wait. Let’s outsmart them!
🚪 Entry Plan – The Door to Gold
📈 "The heist is on once we crack that resistance vault!"
📍Trigger: Wait for candle close above 40,100 – that's your breakout cue.
🧲Pullback Setup: Place Buy Limit near recent swing low on the 15/30 min timeframe, or stack multiple DCA-style orders to scale in silently.
🔔 Don’t forget to set alerts—you snooze, you lose.
🛡️ Stop Loss – Don’t Get Caught
🛑 "Keep your escape plan ready, always!"
📍Preferred SL: Recent swing low on 4H timeframe @ 39,500
🎯 Adjust based on your risk level and lot sizing.
🧠 Smart robbers move stop loss only after breakout confirmation—don’t let hesitation cost you your cut.
🎯 Profit Target – Secure the Bag
🏴☠️ Escape Plan: Aim for 41,200 or bail early if the scene gets messy.
Use trailing SLs to protect your stash.
Scalpers, only play long side. Let the swing traders set the traps while you slice the pie.
📊 Why This Trade Works:
JP225 is currently fueled by:
🔼 Strong bullish momentum
🔍 Technical breakout setup
💹 Fundamental backdrop: macro trends, institutional flow, COT report, and global sentiment lining up like guards on break
🗞️ Want more intel? Check out the broaderr macroeconomic, sentiment, and positioning insights 🔗🔗🔗
⚠️ Risk Management Alert:
📰 During news hours, don’t act greedy.
❌ Avoid entries near big news drops.
✅ Use trailing SLs to protect profits from volatility whiplash.
❤️ Robbery Crew Boost Request
💥Hit that Boost if this plan helps you grab the market loot!
Let’s grow our Thief Trading Army together—every trader deserves a smooth escape and a fat wallet 🏆💪💸
📌 Disclaimer: This is not financial advice. Just a masterplan from a fellow market raider. Adapt your risk and strategy based on your own style. Markets can flip faster than you can say “bank run”—stay updated, stay sharp, and stay stealthy. 🕶️
🎭 See you at the next heist.

"Planning the Perfect DE40 Robbery? Here’s the Setup!"💥🔥Thief Trading Style: The Ultimate Market Heist Plan for DE40/Germany40🔥💥
"Steal the Trend, Escape the Trap, and Vanish with Profits!"
🌍🌟**Hola, Hallo, Marhaba, Bonjour, Ola, and Hey Traders!**🌟
Welcome to the Thief Trading Vault – where we don’t just trade, we plan market heists with precision and escape like professionals!
To all my fellow Profit Pirates, Smart Robbers, and Money Hunters – this one's for you. 🤑💸💼
🔐💹DE40/Germany40 Master Robbery Plan – Swing Trade Setup
Strategy Type: Swing & Scalp Friendly
Market Direction: Neutral ➜ Bullish Bias
Approach: DCA + Tactical Entry Zones + News-Conscious Trading
📍ENTRY (The Vault Is Open!)
Break in like a pro! We are eyeing a long entry setup.
Wait for price to dip near key pullback zones (within recent 15m or 30m swing highs/lows). Use buy limit orders to scale in.
🛠 Thieves love layering: DCA style entry strategy ensures lower average cost.
💡“Swipe smart, enter silently.”
📍STOP LOSS (Secure Your Exit!)
Our risk control is set at recent 4H swing low – around 23950.00.
However, your SL can vary based on risk profile, lot size, and number of entries.
Protect the stash! 💼🔒
📍TARGET (Getaway Point!)
🎯 Target: 24570.00 or exit early if resistance becomes tight.
We’re approaching a “Red Zone” – a high-risk area loaded with fake-outs, bear traps, and profit-takers.
🔁Scalpers' Goldmine Tips
Only scalp LONG SIDE ONLY.
Big accounts? Jump in anytime.
Small accounts? Tag along with swing setups.
Always use a trailing SL to secure gains and avoid traps.
🧠Technical + Fundamental Blend
This setup isn’t just chart-based.
We analyze:
🔍 Fundamentals & Macro Trends
🧾 COT Reports & Sentiment
🌐 Geopolitical Events
📊 Intermarket & Index-Specific Data
🧭 Trader Positioning & Future Price Bias
📎 Full outlook & premium research available – Klickk the Lnk🔗🧠
📢IMPORTANT REMINDERS:
⚠️ Major news releases = High risk.
Avoid fresh entries during those hours.
Use trailing SLs to lock profits during volatile sessions.
🚀Support The Thieves – Hit Boost!
Smash that 💥Boost Button💥 if this plan helped you plan your next profit heist.
More boosts = More strategies unlocked.
Join our elite robbers’ squad and conquer the market daily with the Thief Trading Style! 🏆💰❤️
📌DISCLAIMER:
This is a general swing trade strategy and not financial advice.
Always evaluate your own risk level and market understanding before entering trades.
Markets shift fast – adapt, stay sharp, and never trade blindly. 🎯
📅 Stay tuned – more robbery plans, more precision trades, and more fun ahead!
Follow & Boost if you want in on the next mission!
🕶️🐱👤 See you at the getaway spot!

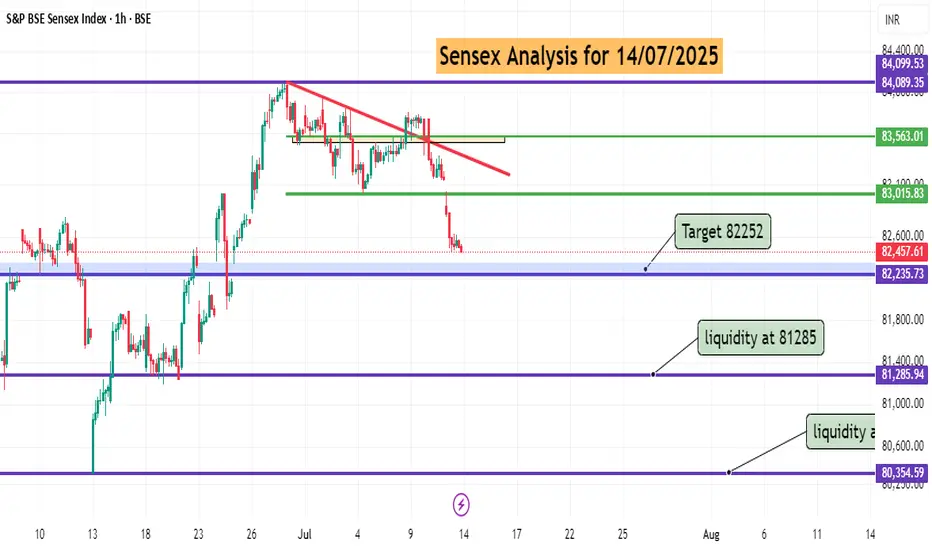
Sensex Technical Analysist for 14/07/2025Strong demand zone is seen near 82219 to 822250 levels. bull may try to enter from here. if market sustain above this level. new buyer will add fresh position at this zone. if bear breaks they will try to grab nest level liquidity at 81285.

Sensex Technical analysis for 14/07/2025Strong demand zone is seen near 82219 to 822250 levels. bull may try to enter from here. if market sustain above this level. new buyer will add fresh position at this zone. if bear breaks they will try to grab nest level liquidity at 81285.
Tariff Wars Pushing USD HigherThis is the Weekly FOREX Forecast for the week of July 14 - 18th.
In this video, we will analyze the following FX market: USD Index
The latest headlines tell the story. The tariffs are triggering a slow run to the USD safe haven, but the inflows from investors are moving the needle. The previous week closed strong, with buyers in control. There's a good chance we'll see more of the same this coming week.
Look for the strength in USD to continue to be supported by fundamental news, and outperform the other major currencies.
Buy USDxxx
Sell xxxUSD
Enjoy!
May profits be upon you.
Leave any questions or comments in the comment section.
I appreciate any feedback from my viewers!
Like and/or subscribe if you want more accurate analysis.
Thank you so much!
Disclaimer:
I do not provide personal investment advice and I am not a qualified licensed investment advisor.
All information found here, including any ideas, opinions, views, predictions, forecasts, commentaries, suggestions, expressed or implied herein, are for informational, entertainment or educational purposes only and should not be construed as personal investment advice. While the information provided is believed to be accurate, it may include errors or inaccuracies.
I will not and cannot be held liable for any actions you take as a result of anything you read here.
Conduct your own due diligence, or consult a licensed financial advisor or broker before making any and all investment decisions. Any investments, trades, speculations, or decisions made on the basis of any information found on this channel, expressed or implied herein, are committed at your own risk, financial or otherwise.

SP500 weekly balance?JUst some ideas while looking at weekly charts. We've put in a doji on the week - indecision. A pullback to 6100 would start raising flags about a possible false breakout from balance.

SPX500USD | Retesting All-Time HighsThe index has extended its bullish rally, printing a new local high at 6,286.5 before showing signs of slight hesitation with consecutive small-bodied candles.
Support at: 6,134.5 / 6,026.0 / 5,926.2 🔽
Resistance at: 6,286.5 🔼
🔎 Bias:
🔼 Bullish: Sustains above 6,134.5 and breaks 6,286.5 for new highs.
🔽 Bearish: Break below 6,134.5 could trigger a retracement toward 6,026.0.
📛 Disclaimer: This is not financial advice. Trade at your own risk.
