US30"Given the downward trend line formed on the one-hour chart, I expect the price to react in the area I’ve marked in blue and then move downward."
Market indices

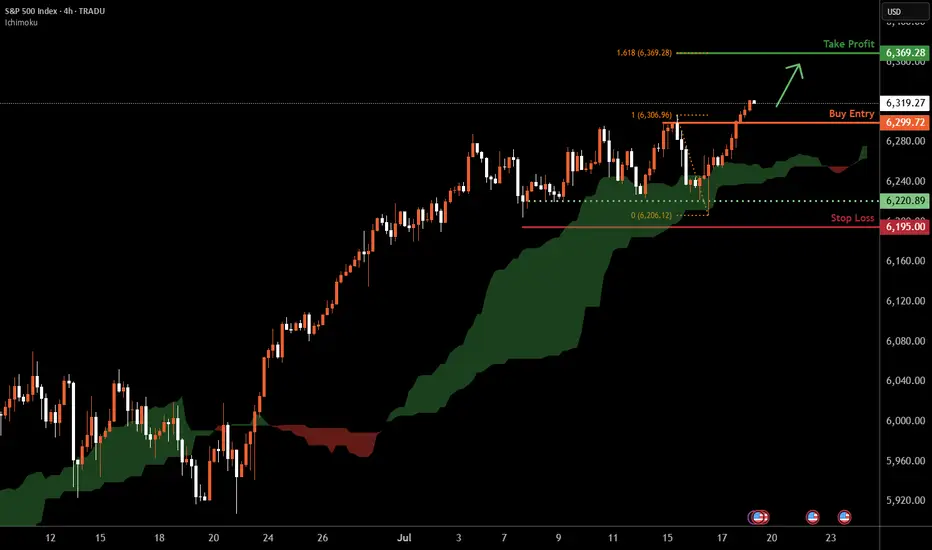
S&P 500 H4 | Making a run towards a new ATH?The S&P 500 (SPX500) is falling towards a pullback support and could potentially bounce off this level to climb higher.
Buy entry is at 6,299.72 which is a pullback support.
Stop loss is at 6,195.00 which is a level that lies underneath a multi-swing-low support.
Take profit is at 6,369.28 which is a resistance that aligns with the 161.8% Fibonacci extension.
High Risk Investment Warning
Trading Forex/CFDs on margin carries a high level of risk and may not be suitable for all investors. Leverage can work against you.
Stratos Markets Limited (tradu.com ):
CFDs are complex instruments and come with a high risk of losing money rapidly due to leverage. 66% of retail investor accounts lose money when trading CFDs with this provider. You should consider whether you understand how CFDs work and whether you can afford to take the high risk of losing your money.
Stratos Europe Ltd (tradu.com ):
CFDs are complex instruments and come with a high risk of losing money rapidly due to leverage. 66% of retail investor accounts lose money when trading CFDs with this provider. You should consider whether you understand how CFDs work and whether you can afford to take the high risk of losing your money.
Stratos Global LLC (tradu.com ):
Losses can exceed deposits.
Please be advised that the information presented on TradingView is provided to Tradu (‘Company’, ‘we’) by a third-party provider (‘TFA Global Pte Ltd’). Please be reminded that you are solely responsible for the trading decisions on your account. There is a very high degree of risk involved in trading. Any information and/or content is intended entirely for research, educational and informational purposes only and does not constitute investment or consultation advice or investment strategy. The information is not tailored to the investment needs of any specific person and therefore does not involve a consideration of any of the investment objectives, financial situation or needs of any viewer that may receive it. Kindly also note that past performance is not a reliable indicator of future results. Actual results may differ materially from those anticipated in forward-looking or past performance statements. We assume no liability as to the accuracy or completeness of any of the information and/or content provided herein and the Company cannot be held responsible for any omission, mistake nor for any loss or damage including without limitation to any loss of profit which may arise from reliance on any information supplied by TFA Global Pte Ltd.
The speaker(s) is neither an employee, agent nor representative of Tradu and is therefore acting independently. The opinions given are their own, constitute general market commentary, and do not constitute the opinion or advice of Tradu or any form of personal or investment advice. Tradu neither endorses nor guarantees offerings of third-party speakers, nor is Tradu responsible for the content, veracity or opinions of third-party speakers, presenters or participants.
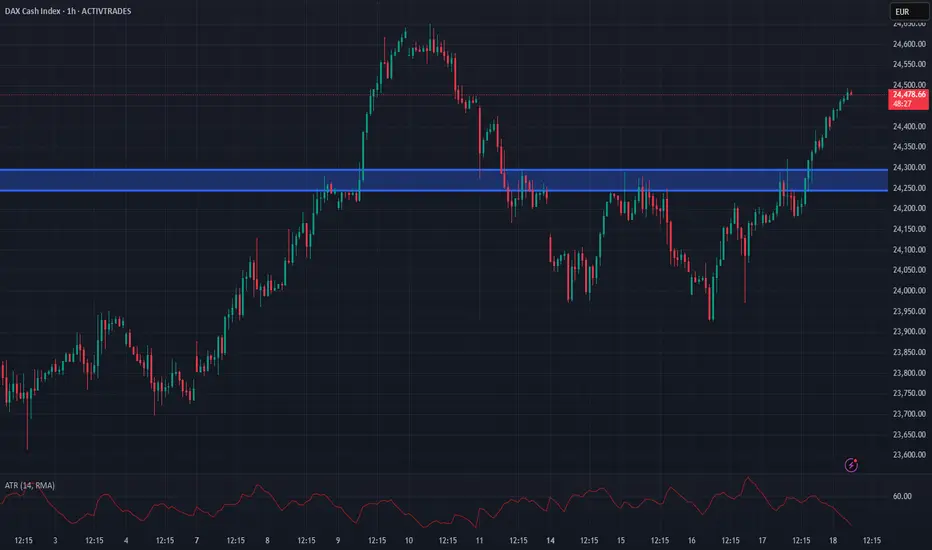
Dax Breaks Higher to keep the bullish toneDax has moved back above the 24245-24295 zone impulsively and we retain the overall bullish tone
Retests of this area can provide an opportunity to get long
Stops need to be below 24170
Targets can be back towards 24400 and even hold a runner back to the All time highs
Dow Eyes 45000 After Bullish BreakoutThe U.S. 30 contract has broken topside from a short-term bull flag, reinforcing the broader uptrend and putting 45000 resistance back in focus.
Traders looking to play a continuation can consider longs with a tight stop beneath for protection. A break of 45000 may trigger a fresh burst of upside momentum, putting big figures above in play.
Bullish price momentum is also building again, adding to the case for upside.
Good luck!
DS

UK100 short - head and shoulders H4Risk/ reward = 4.6
Entry = 8 998.5
Stop loss = 9 034.2
Take profit level 1 = 8 859.8
Take profit level 2 = 8 794
Still need confirmation,
Waiting for H4 candle to close at 23.00 and will need to validate volume.

NAS100 (CASH100) SHORT - Double Top H8Risk/reward = 4.6
Entry price = 23 063
Stop loss price = 23 190
Take profit level 1 (50%) = 22 635
Take profit level 2 (50%) = 22 303
Still waiting for confirmation on some variables.
For example, need H8 candle to close in range and volume to validate, amongst other variables.
5 Proven Tricks to Trade Without FOMO After Missing Your TriggerYo traders! In this video, I’m breaking down what to do if you miss a trading trigger , so you can stay calm , avoid FOMO , and still catch the next move. We’re diving into five solid strategies to re-enter the market without losing your cool:
Buy on the pullback zone.
Buy with an engulfing candle after a pullback.
Buy after breaking the resistance formed by the pullback.
Buy after the second wave with an indecision candle.
Buy after breaking a major resistance post-second wave, confirmed by RSI or momentum oscillators.
These tips are all about keeping your trades smart and your head in the game. For more on indecision candles, check out this lesson . Wanna master breakout trading? Here’s the breakout trading guide . Drop your thoughts in the comments, boost if you vibe with it, and let’s grow together! 😎

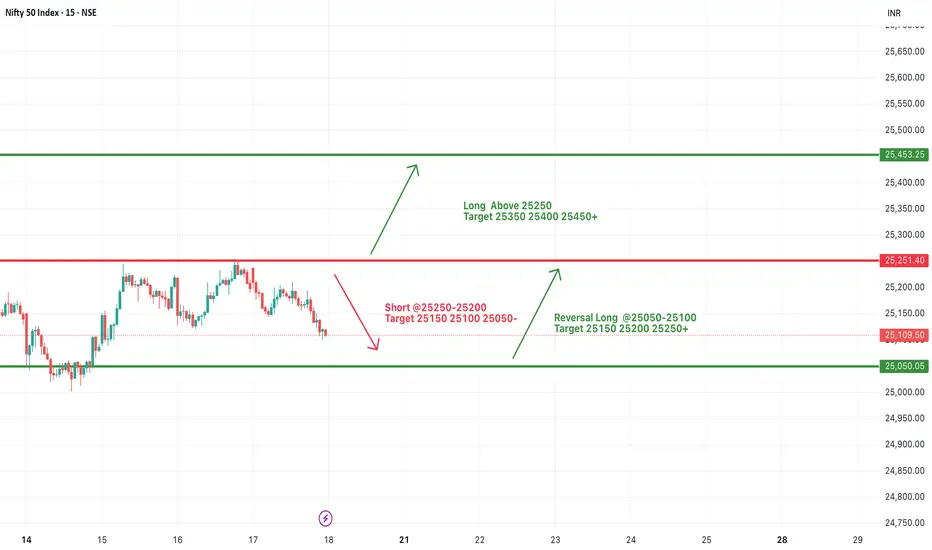
#NIFTY Intraday Support and Resistance Levels - 18/07/2025Nifty is likely to open slightly gap-up today near the 25100–25150 zone. There are no major changes from yesterday’s levels, so the same trading levels remain in focus for today’s session. If Nifty sustains above the 25250 level, we can expect an upside move toward 25350, 25400, and even 25450+ levels. This area remains a crucial resistance zone for potential bullish continuation.
On the downside, if Nifty fails to cross and sustain above 25250 and breaks below the 25200–25250 zone, we may witness a downward move with possible targets at 25150, 25100, and 25050.
A reversal long opportunity may arise in the 25050–25100 support zone if the market finds buying interest after a dip. From this level, we can expect targets around 25150, 25200, and 25250+.
The index is trading in a tight range with no fresh cues. Avoid aggressive entries and stick to level-based trades with strict stop-loss and partial profit booking.
[INTRADAY] #BANKNIFTY PE & CE Levels(18/07/2025)Bank Nifty is expected to open flat around the 56800 zone, suggesting indecision in the early session. If it manages to move upward and sustain above the 57050–57100 resistance range, it could invite bullish momentum targeting 57250, 57350, and even 57450+. A breakout above this level can trigger a continuation of upward movement, but volume and price confirmation are essential.
On the downside, if the index stays weak and slips below the 56950–56900 zone, we may see fresh bearish pressure pulling it toward 56750, 56650, and 56550 support levels. This zone remains a crucial intraday pivot for traders to watch.
A reversal opportunity may also emerge if the index drops further near 56550–56600 and then shows a sharp recovery. In such a case, targets of 56750, 56850, and 56950+ are possible, making it a good support-based bounce trade. Overall, the market might remain sideways with both opportunities for quick scalps and reversals—focus on key levels and act with strict stop losses.

Has the DXY got you confused? Well, check out this analysis.Welcome back, traders, it’s Skeptic from Skeptic Lab! 😎 , the DXY has entered a corrective phase over the past weeks. In this analysis, I’ve broken down the technicals and chart with a skeptical eye, outlined long and short triggers on the 4h timeframe , and tried to give you a solid multi-timeframe view of the setup. At the end, I’ve shared a key educational tip that can seriously boost your win rate and R/R , so make sure you check out the full analysis.
💬If you’ve got a specific symbol in mind for analysis, drop it in the comments. Have a profitable Friday, fam <3

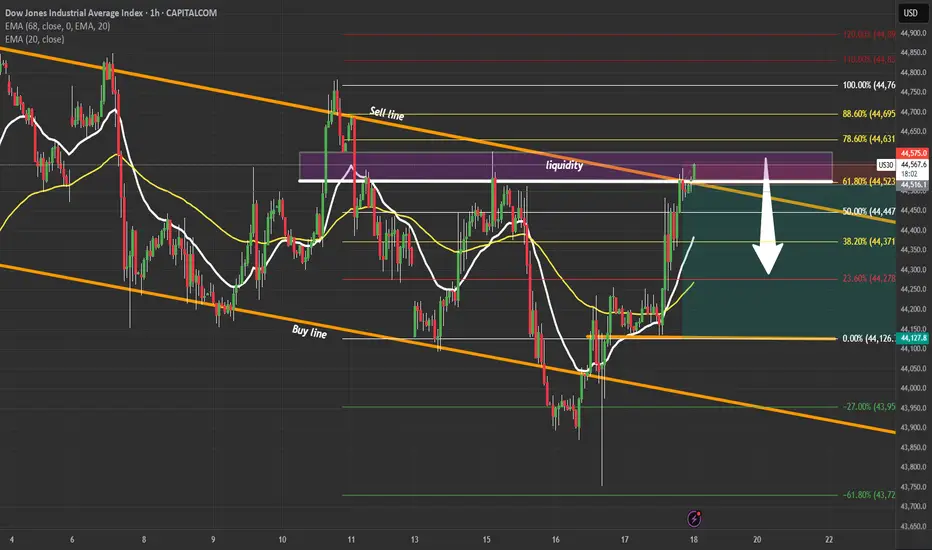
US30 High-Probability Short SetupUS30 | Liquidity Grab at 61.8% Fib 🔍
Price tapped a major liquidity zone inside the descending channel near the 61.8% Fibonacci level.
Plan: Waiting for confirmation to short toward 44,150.
Breakout or rejection? Drop your thoughts below!
Risk environment to remain positive? S&P continuation?Despite all the recent tariff concerns, inflation concerns and Middle East worries. The S&P continues to push all tine highs. And 'risk surprises' not withstanding, is likely to do so. Backed up by a solid start to ratings season, especially from Netflix.
In the currency space, that should mean the JPY remains weak. And I'm cutoutting recent JPY strength due to profit taking ahead of weekend elections. But moving into the new week, i'll be looking for JPY short opportunities.
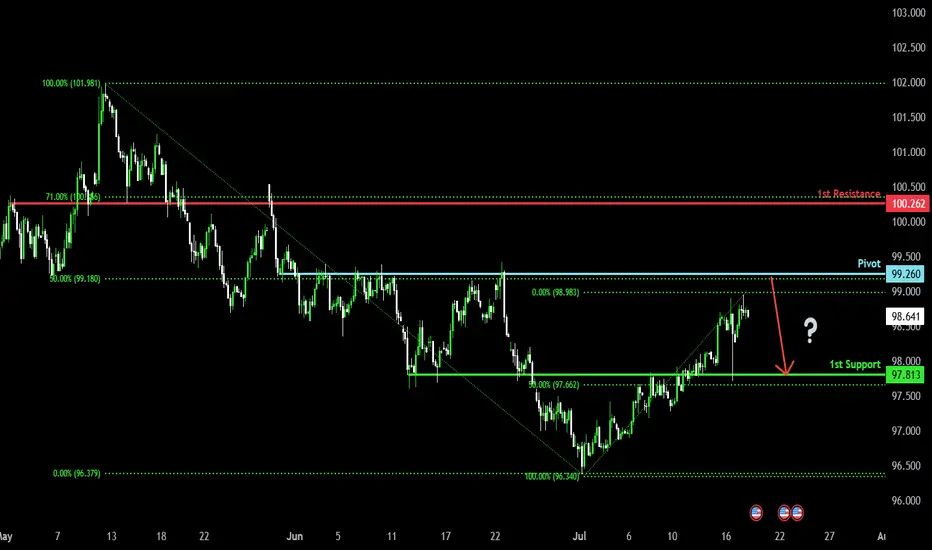
Bearish reversal?US Dollar Index (DXY) is rising towards the pivot and could reverse to the 1st support which acts as an overlap support.
Pivot: 99.26
1st Support: 97.81
1st Resistance: 100.26
Risk Warning:
Trading Forex and CFDs carries a high level of risk to your capital and you should only trade with money you can afford to lose. Trading Forex and CFDs may not be suitable for all investors, so please ensure that you fully understand the risks involved and seek independent advice if necessary.
Disclaimer:
The above opinions given constitute general market commentary, and do not constitute the opinion or advice of IC Markets or any form of personal or investment advice.
Any opinions, news, research, analyses, prices, other information, or links to third-party sites contained on this website are provided on an "as-is" basis, are intended only to be informative, is not an advice nor a recommendation, nor research, or a record of our trading prices, or an offer of, or solicitation for a transaction in any financial instrument and thus should not be treated as such. The information provided does not involve any specific investment objectives, financial situation and needs of any specific person who may receive it. Please be aware, that past performance is not a reliable indicator of future performance and/or results. Past Performance or Forward-looking scenarios based upon the reasonable beliefs of the third-party provider are not a guarantee of future performance. Actual results may differ materially from those anticipated in forward-looking or past performance statements. IC Markets makes no representation or warranty and assumes no liability as to the accuracy or completeness of the information provided, nor any loss arising from any investment based on a recommendation, forecast or any information supplied by any third-party.
Nikkei 225 Wave Analysis – 17 July 2025
- Nikkei 225 reversed from support area
- Likely to rise to resistance level 40550.00
Nikkei 225 index recently reversed up with the daily Doji from the support area located between the key support level 39000.00 (former resistance from May) and the support trendline of the daily up channel from May.
This support area was further strengthened by the 38.2% Fibonacci correction of the sharp upward impulse i from May.
Given the strong daily uptrend and the improved sentiment across global equity markets, Nikkei 225 index can be expected to rise to the next resistance level 40550.00 (former multi-month high from January).

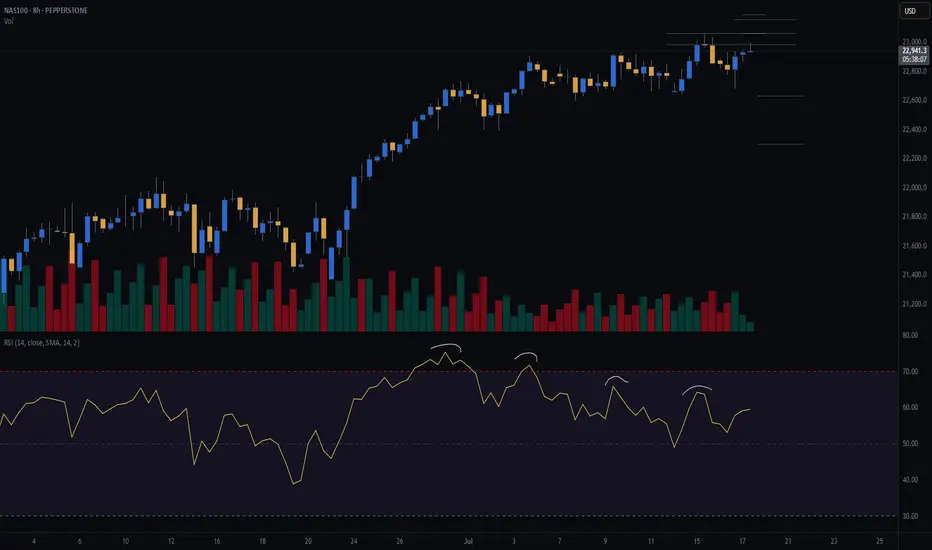
US100 Strong Bullish Breakout!
HI,Traders !
#US100 is trading in a
Strong uptrend and the
made a bullish breakout
Of the key horizontal level
Of 22879.1 so we are
Bullish biased and we will
Be expecting a further
Bullish move up !
Comment and subscribe to help us grow !

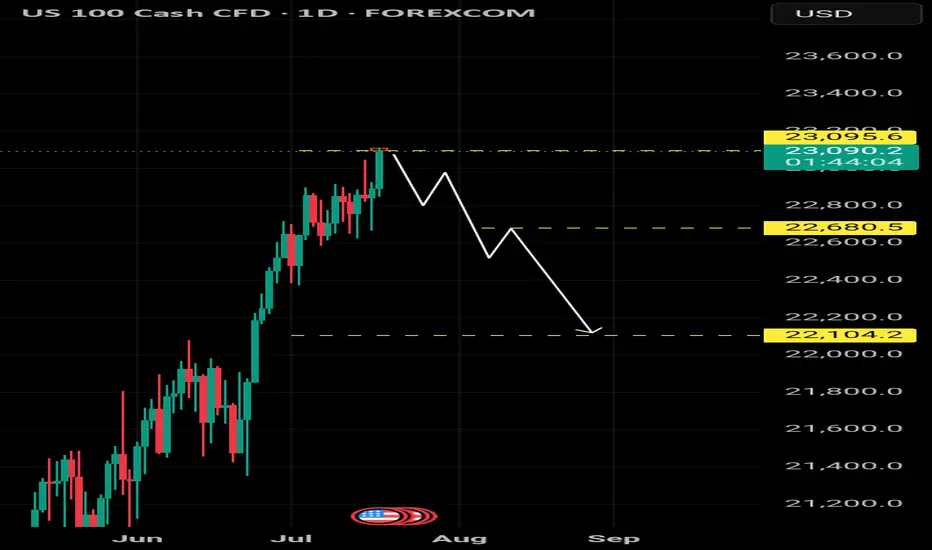
NASDAQ Outlook – Coming WeeksIn the coming weeks, we may see a potential downward move in the NASDAQ, provided that it fails to hold above the current level at 23,100.
If the index remains unstable below this level, a sharp decline toward the 22,800 zone is likely.
SPX: Long-Term Strength and Opportunity
SPX: Long-Term Strength and Opportunity
The S&P 500 (SPX) on this monthly timeframe clearly illustrates a powerful long-term uptrend, where each significant pullback has consistently presented a valuable buying opportunity. Most recently, the market effectively retested and bounced off the established long-term trendline, even amidst geopolitical concerns such as the April low experienced when tariffs were announced, underscoring the underlying bullish resilience. This sustained trajectory suggests continued upward momentum, reaffirming the 'buy the dip' strategy within this robust market environment.
Disclaimer:
The information provided in this chart is for educational and informational purposes only and should not be considered as investment advice. Trading and investing involve substantial risk and are not suitable for every investor. You should carefully consider your financial situation and consult with a financial advisor before making any investment decisions. The creator of this chart does not guarantee any specific outcome or profit and is not responsible for any losses incurred as a result of using this information. Past performance is not indicative of future results. Use this information at your own risk. This chart has been created for my own improvement in Trading and Investment Analysis. Please do your own analysis before any investments.

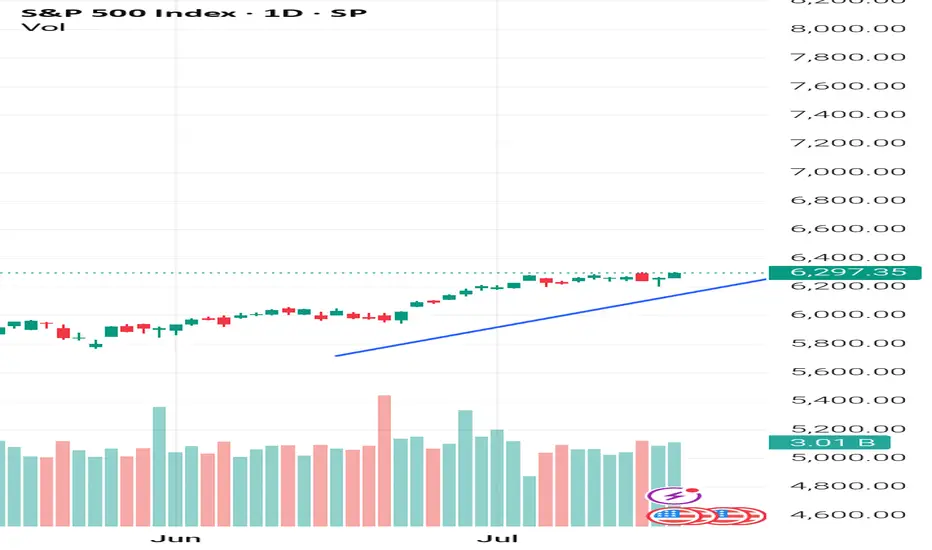
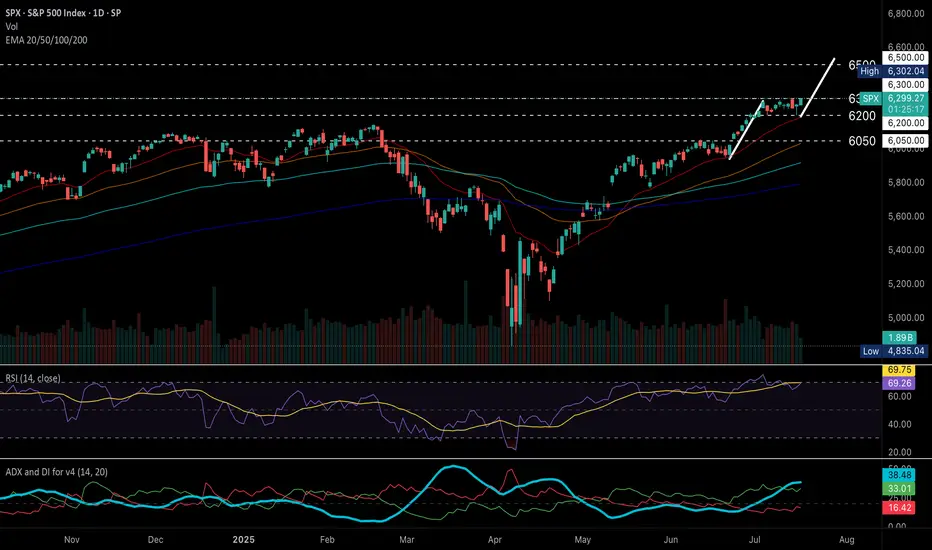
S&P 500 (US500) maintains strong bullish momentum.S&P 500 (US500) maintains strong bullish momentum.
Technical Outlook
S&P 500 (US500) holds a strong bullish structure, continuing to print higher highs and higher lows above diverging EMAs, signaling sustained upward momentum.
RSI has eased from overbought levels, now hovering below 70, while price consolidates sideways near recent highs, a typical pause before potential continuation.
ADX remains elevated above DI+ and DI-, with DI+ above DI–, confirming trend strength and ongoing bullish momentum.
A breakout above the 6300 all-time high would confirm a bullish continuation, with the next upside target near 6500 based on the flagpole projection.
Conversely, a drop below 6200 may trigger a deeper pullback toward the 6050 support zone.
Fundamental Outlook
Corporate earnings, particularly in the tech sector, continue to exceed expectations, providing significant support to the index. Analysts project continued earnings growth for S&P 500 companies, with profits expected to grow by approximately 9% year-over-year in 2025, reinforcing confidence in the index’s rising fundamental valuation.
Markets are now pricing in earlier Fed rate cuts, driven by evolving economic data and political pressure.
Economic data such as stronger-than-expected retail sales and unemployment claims, though the latter could reduce the likelihood of imminent rate cuts, signal robust consumer demand, which should continue to support economic growth.
by Terence Hove, Senior Financial Markets Strategist at Exness
Part 2 Overview of Market Week 13-19Thanks for tuning in guys, giving my knowledge to you guys free cause. AU,UJ,EU market overview mixing in a lot of fundamental confirmation.

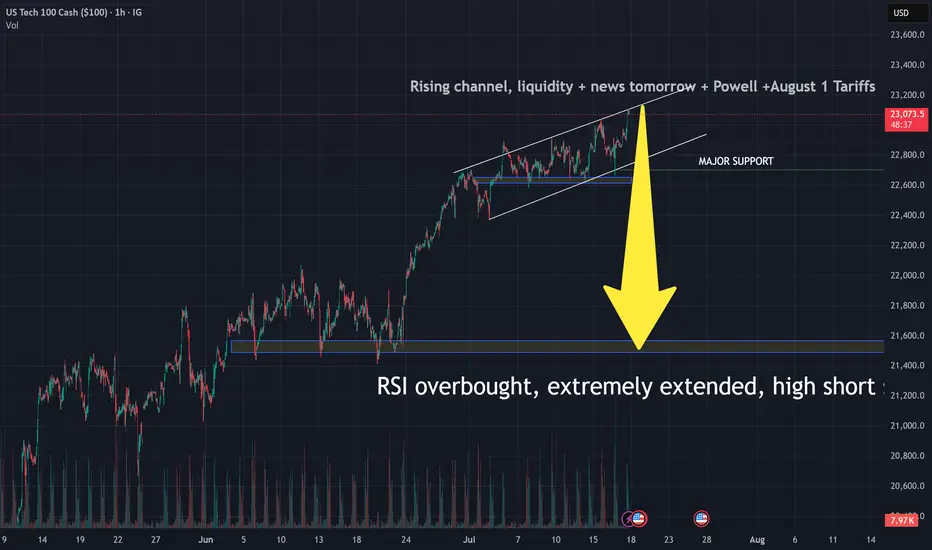
NASDAQ will fall to 21500 until August 1Nearly all Indicators, Geopolitics, uncertainties, Trade Tariffs, Powell vs Trump- tell us to sell, marking a bearish perception on Stock Market. Although your right analysis to sell is still bougt by super fast algorithms, there are facts that neither investors nor programms can ignore, and they are about to come. If housing market stambles tomorrow, which, probably, will be the fact, it will be the first step towards this deep dive. Wish us all profitable trading. Remember, it is not about being right or wrong, it is about making money, so even if you are wrong-dont compete with your own money against you, stay focused falks. See ya.
Nifty Analysis EOD – July 17, 2025 – Thursday🟢 Nifty Analysis EOD – July 17, 2025 – Thursday 🔴
📉 Sellers Grip Expiry Day — Big Move Loading?
Nifty started again with an OH (Open = High) formation and slipped down 94 points before 10:30 AM, marking the day’s low at 25,144. During this fall, it broke the support zone of 25,212 ~ 25,180. Although a retracement followed, it couldn’t sustain above the mean and eventually broke below the previous day’s low (PDL), closing at 25,111.45.
The weekly expiry was wild and volatile — especially from 12:30 to 2:30 PM. Interestingly, if we consider the total range of the last three sessions, it is just 166 points — well below average. This suggests a phase of consolidation. A significant move may emerge once Nifty decisively breaks the broader zone of 25,000 to 25,255.
🕯 5 Min Time Frame Chart with Intraday Levels
🕯 Daily Time Frame Chart with Intraday Levels
📊 Daily Candle Breakdown
Open: 25,230.75
High: 25,238.35
Low: 25,101.00
Close: 25,111.45
Change: −100.60 (−0.40%)
Candle structure breakdown:
Real body:
Red candle (Close < Open): 25,230.75 − 25,111.45 = 119.30 points → Decent-sized bearish body
Upper wick:
25,238.35 − 25,230.75 = 7.60 points → Very small
Lower wick:
25,111.45 − 25,101.00 = 10.45 points → Small
Interpretation:
Nifty opened slightly lower, made a weak attempt upward, then saw consistent selling throughout the day, closing near the session’s low. The negligible wicks indicate that sellers were in full control, and buyers had little room to fight back.
Candle Type:
A strong bearish candle (almost Marubozu) with very small wicks → Clear dominance by sellers.
Key Insight:
The test of the 25,100 zone again shows weakening bullish strength.
If the next session breaks below 25,100, the fall may extend toward 25,000–25,050.
For bulls to regain short-term momentum, a close above 25,200–25,220 is necessary.
🛡 5 Min Intraday Chart
⚔️ Gladiator Strategy Update
ATR: 176.62
IB Range: 60.85 → Medium IB
Market Structure: Balanced
Trades Triggered:
🕒 10:53 AM – Long Trade → Trailed SL Hit Profit (R:R = 1:0.42)
🧭 What’s Next? / Bias Direction
The market is coiling within a narrow range across multiple sessions, hinting at a potential breakout move.
📌 Watch Zone: 25,000 to 25,255
🔻 A break below 25,000 may open 24,950–24,900
🔺 A close above 25,260 could drive price toward 25,350+
Bias remains neutral-to-bearish unless bulls reclaim 25,220 decisively.
🧱 Support & Resistance Levels
Resistance Levels
25,168
25,180 ~ 25,212
25,260
25,295 ~ 25,315
Support Levels
25,125
25,080 ~ 25,060
25,000 ~ 24,980
24,965
🧠 Final Thoughts
"Structure is key. When levels work, respect them. When they break, adapt."
Three sessions of compression hint at expansion soon — stay alert and trade level-to-level with discipline.
✏️ Disclaimer
This is just my personal viewpoint. Always consult your financial advisor before taking any action.

SellRejection Level
Daily Volume
Market Structure Shift
London Session
Trend Line Break
Untapped Order Point

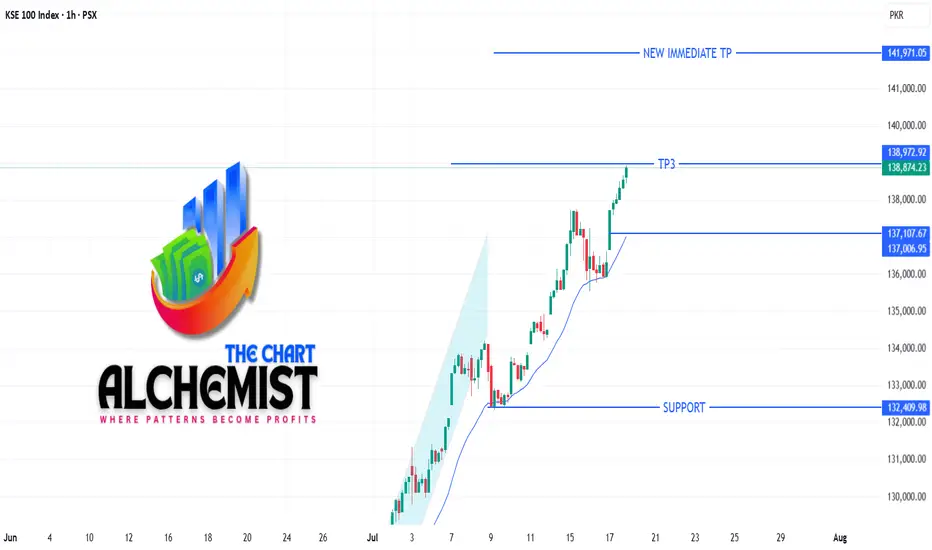
KSE-100 INDEX UPDATE | 17 JULY 2025KSE-100 INDEX UPDATE | 17 JULY 2025
The KSE-100 continues its strong uptrend, hitting a high of 140,931 today—just shy of the immediate target at 141,970.
As expected, the index is showing signs of deeper pullbacks within the channel structure, which remain healthy and present strong buying opportunities. The final upside target stays at 151,600, with the trend firmly intact.