US100 Short From Resistance!
HI,Traders !
US100 is weaker than we
Expected and failed to break
The key horizontal level
Around 22868.6 and we are
Now seeing a bearish rejection
So we are locally bearish biased
And we will be expecting a
Further bearish move down !
Comment and subscribe to help us grow !
Market indices

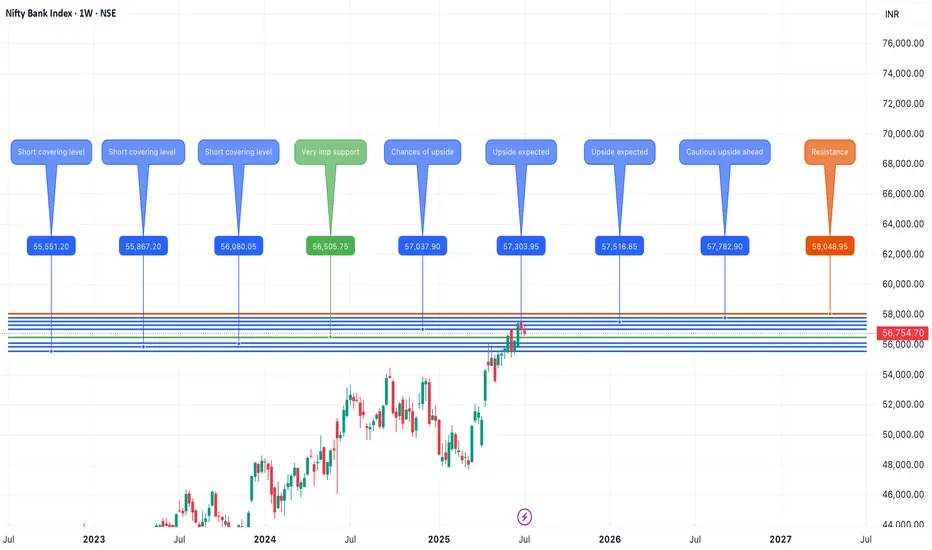
BankNifty July 3rd Week Analysis Banknifty closing isn't looking bearish until now , but if it breaches 56500-400 on the downside, then we can expect a retracement upto 55800-500+ . On the upside, if Banknifty successfully crosses and sustains above 57250-300, then we can expect it to continue the upside upto new highs of 57800-58000+ .
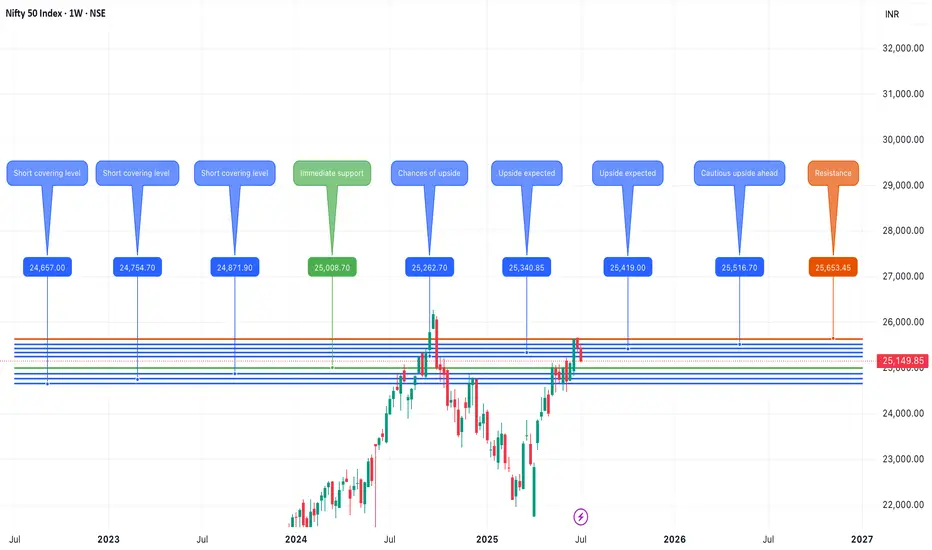
Nifty July 3rd Week Analysis Nifty is looking uncertain at the moment , and we can expect a highly volatile week ahead for Nifty. Upside momentum can be trusted only if Nifty crosses and sustains above 25320, and it can continue upside momentum upto 25600-650. On the downside, if Nifty breaches 25050-24950, then we can expect a downtrend upto levels of 24750-650.
ASCENDING WEDGE ON WATCH - ELLIOTT WAVE 3 NEARLY COMPLETEThe WAVE 3 extension can go further but it seems likely that coinciding with earnings this month we will have the potential for the start of WAVE 4 retracement.
The possible resignation of Jerome Powell could further intensify the charts.
AlphaTrend is an advanced trading indicator that leverages proprietary tools, real-time data, and custom metrics to give traders a competitive edge. Designed for all experience levels, it works instantly—no advanced charting skills required.
ADVANCED and PRO versions are available. (See below)
🔍 How It Works
At the core of AlphaTrend is Dynamic Reversion Bands — a sophisticated real-time system that adapts to price action by automatically adjusting to evolving market conditions.
These bands act like a roadmap, helping traders identify:
Mean reversion trade opportunities
Trend strength
Emotion-driven market conditions (like FOMO)
The system is rooted in Mean Reversion Theory:
If an asset's price deviates significantly from its historical average, it tends to “revert” back to that average over time. Traders can use this behavior to spot potential buying or selling opportunities:
Overbought Conditions: If the price moves too far above the mean, it may signal a pullback—traders might sell or short.
Oversold Conditions: If the price drops well below the mean, it may be undervalued—traders might buy in anticipation of a bounce.
⚪🟡🔴🟡⚪ Dynamic DOTS
AlphaTrend visualizes market overextension through dynamic DOTS:
White DOTS = Average conditions
Yellow DOTS = Above average conditions
Red DOTS = Extreme conditions
The DOTS update in real time as the candle is forming—appearing, disappearing, and shifting color based on current intensity levels. Once the candle closes, however, the DOTS do not repaint. This ensures clarity and confidence in every signal.
This is crucial, as many indicators repaint and revise data after the fact, undermining traders’ trust. With AlphaTrend, once a candle closes, the data remains permanently fixed.
📊 Adaptability and Market Insight
AlphaTrend adapts to any timeframe, but performs best on longer-duration candles, where signals are fewer but more reliable. Multi-interval displays (e.g., 1hr, 4hr, Daily) are highly recommended. That being said it does tend to give strong signals on all time frames even down to 1 min candles.

SPX Breakdown or Another Push Higher?Hi y'all thanks for tuning in! Here are a few written notes to sum up the video.
Indecision at New Highs
After breaking out to new all-time highs, SPX printed a doji on the weekly chart, signaling indecision. This hesitation could mark the start of digestion.
Still Structurally Bullish, but Extended
The weekly chart shows SPX is still holding trend structure, but price is notably extended from the 10EMA. Historically, when price moves too far from key short-term EMAs, it tends to reset either via time (sideways chop) or price (pullback).
Daily Chart Shows a Shelf Forming
On the daily chart, price has been consolidating just under the prior high with small-bodied candles. This is forming a “shelf” around the 6,260–6,280 zone. It’s acting like a pause, not a breakdown. Holding above this zone keeps the trend intact.
Pullback Risk Increases Below 6,232
If price loses 6,232 (last week's breakout area and short-term shelf), it increases the likelihood of a pullback toward the 6160 or even deeper toward the 5970. That lower zone also marks the bottom of the prior consolidation box from earlier this year.
Seasonality Reminder
Historically, July is strong in the first half, with weakness (if it shows up) arriving mid-to-late month. So far, price has tracked that seasonal strength. Any weakness from here would align with that typical timing.

NASDAQ 100 | BearishNASDAQ has formed divergence on RSI.And NASDAQ plays divergence almost all the times.Considering it will honor the divergence then NASDAQ is going to enter into a strong correction phase and it may test its support zones.

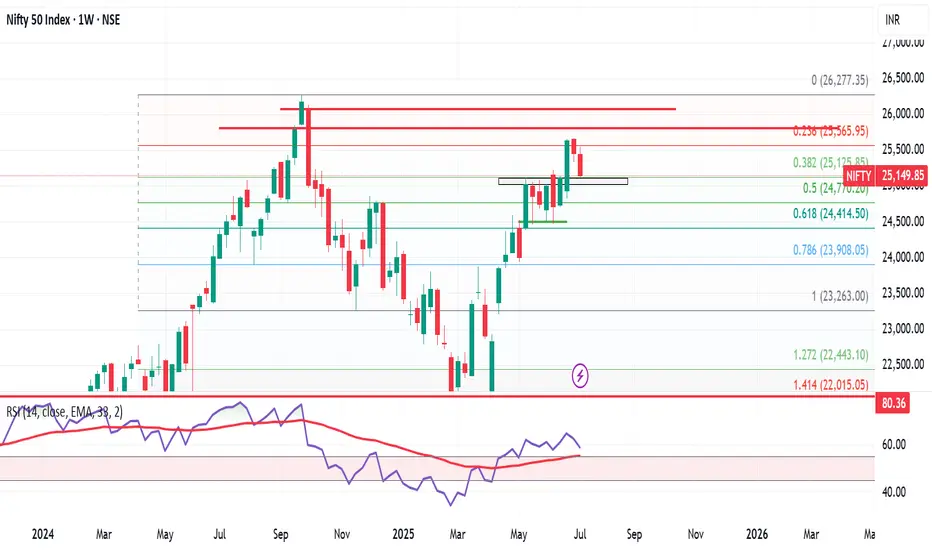
Nifty at Make-or-Break Zone: What to Expect Next Week Markets eMarkets ended the week under pressure, with the Nifty 50 closing at 25,149, down 312 points from the previous week. The index traded within a tight band, hitting a high of 25,548 and a low of 25,129 — perfectly respecting the 25,900–25,000 range mentioned in last week’s analysis.
Now, Nifty finds itself at a crucial support level near 25,000. A rebound from this zone could trigger a short-term rally towards 25,500–25,600, which will act as immediate resistance. However, traders should proceed with caution, as the monthly chart remains neutral to bearish, indicating that this could just be a temporary bounce rather than a sustained uptrend.
Looking ahead, expect Nifty to trade within a range of 24,700 to 25,600. A breakdown below 24,700 could open the gates for deeper cuts, while a breakout above 25,600 needs to be backed by strong volume and participation to confirm a trend reversal.
Sector Watch: Reliance Shines Amidst Caution
Among the large caps, Reliance Industries stands out as the only stock showing strength on the monthly chart, while other heavyweights and key sectors continue to lack momentum. This narrow leadership is a red flag for broader market sustainability.
Global Markets: S&P 500 at a Crossroads
Globally, the S&P 500 closed at 6,259, down slightly from last week. What’s more important is the formation of a Doji candle — a classic sign of indecision. A move above 6,300 could lead to upside targets of 6,376 / 6,454 / 6,500, which would likely boost sentiment in global and Indian equities.
However, if the index slips below 6,150, it would mark a failed breakout, potentially triggering a global correction — a risk that Indian markets can't ignore.
Final Word
We’re at a critical juncture. While technicals suggest a potential bounce in Nifty from 25,000, the lack of confirmation on higher timeframes and uncertain global cues call for prudence over aggression.
👉 I’ll be staying out of the market this week. The setup doesn’t offer a favorable risk-reward, and in trading, patience is often the best position.
Let the charts speak. We’ll act accordingly.
S&P 500 - Medium Timeframe AnalysisAs illustrated, we appear to be in the final wave to the upside. At this stage, I’m treating Wave 5 as a standard impulse. However, given that Wave 4 retraced deeply, nearly to the termination point of Wave 1, there remains a modest possibility that this higher-degree Wave 5 in gray, which began in 2020, could ultimately unfold as an ending diagonal. That said, this scenario remains highly unlikely, as the internal structure of the preceding waves does not exhibit the characteristics of corrective price action.

How I Manage Risk (When Buying Options) If you’ve read my previous post — “How Much Risk Are You Really Taking?” — you already know my view on risk:
Treat every trade like watching your cash burn in front of you.
Ask yourself:
💭 “Would I be OK watching this much money disappear right now?”
If your answer is yes, take the trade and move on.
If it’s no, don’t do it — resize it.
🚫 What Not to Do:
Many traders fall into the trap of:
“I’ll think about it later”
“I’ll set a mental stop and cut if it hits my level…”
That approach has two fatal flaws:
#### ❗ 1. Execution failure
You might not react fast enough when the market hits your level — or worse, you’ll forget to act at all.
#### ❗ 2. Emotional resistance
Even if your stop level is hit, will you actually cut?
Probably not.
Human nature avoids pain and chases pleasure.
Cutting a loss — even a planned one — is painful. That’s why mental stops often fail.
Mental stops:
Add more burden to monitor
Add more emotion to your decision-making
That’s why I keep it simple.
---
✅ My Risk Rule for Buying Options:
Every dollar of premium I spend is 100% acceptable to lose.
This way:
I don’t need a mental stop.
I don’t need to watch it every second.
I sleep well, regardless of outcome.
---
📊 How Much Do I Risk?
It depends on account size and account type:
#### 📌 Main Account:
Risk 1–2% per trade
Never more than 5% on a single trade
Rarely hold more than 3 trades at once
Targeting 6–10% total exposure, only if trades are uncorrelated
⚠️ SPY & QQQ are NOT uncorrelated — don’t fool yourself.
#### 📌 Small Account:
Can risk 5–10% per trade, but only on A+ setups(See: “What’s Your Catalyst?” for what qualifies as A+ in my book)
The goal of a small account is different: it’s about growth — but still must be strategic.
---
💰 “But How Can I Make Big Money Risking So Little?”
This is the common pushback I get:
“Shouldn’t we take big risks to get big rewards?”
Sure — high risk = high reward.
But high risk also = high chance of blowing up.
Even if you hit a few big winners, you’ve compromised your long-term survival.
That’s not trading. That’s gambling.
---
🧠 What I Actually Look For:
Low Risk / High Reward.
Yes, they’re rare.
Yes, they’re like lotto tickets.
But you don’t need to win often if you only risk a little and win big when it counts.
What’s not rare is:
Traders risking big on uncertain setups
Going all in on gut feelings
Wiping out in one or two bad trades
That’s not strategy — that’s self-destruction.
---
🧾 The 2 Core Rules of Risk:
Protect capital at all costs
Only take trades where potential reward outsizes the risk
Don’t flip the logic.
Too many traders hear “high risk = high reward” and assume high risk is required.
It’s not.
That mindset is built for Vegas, not for Wall Street.
---
🧠 If You Want to Be a Trader — Not a Gambler:
You must believe in:
Small risk, big reward
Patience
Discipline
Letting time and luck compound your edge
No other way.
🎯 If you truly get this… congrats.
You’ve crossed the line from gambling to trading.

More upside after correction for SPX500USDHi traders,
Last week SPX500USD went a little more up (diagonal) just as I've said in my outlook.
Next week we could see the start of a bigger correction down (grey wave 4) and a break of the dotted trendline. Or the diagonal is a leading diagonal wave 1 and grey wave 3 extends more.
Let's see what the market does and react.
Trade idea: Wait to see if price breaks the dotted trend line (for shorts) or not (for longs).
If you want to learn more about trading FVG's & liquidity sweeps with Wave analysis, then please make sure to follow me.
This shared post is only my point of view on what could be the next move in this pair based on my technical analysis.
Don't be emotional, just trade your plan!
Eduwave

NI225: Will Go Up! Long!
My dear friends,
Today we will analyse NI225 together☺️
The recent price action suggests a shift in mid-term momentum. A break above the current local range around 39,581.12 will confirm the new direction upwards with the target being the next key level of 39,719.48 and a reconvened placement of a stop-loss beyond the range.
❤️Sending you lots of Love and Hugs❤️

Wedge Cracks + Tariff Heat = Bearish Setup On US100The US100 is showing signs of potential reversal after completing a harmonic ABCD pattern near the wedge resistance. The price has broken below the rising wedge support, indicating bearish momentum.
Bearish Confluences:
1) Completed the ABCD pattern
2) Rsisng Wedge Breakdown
3) Clear Bearish RSI Divergence, showing weakening momentum at highs.
Targets:
TP1: 22180
TP2: 22050
TP3: If the price breaks below 22050, then TP3 will be 21650

SPX GEO+ Cycle Update: "SPX: April Low Called, Target 8000+"SPX GEO+ Cycle Update: April Low Called Precisely (Next Target: 8000)
On January 5th, 2025, when SPX was trading at 5942, I published an analysis in Italian using my GEO+ Cycle methodology that made two specific projections:
📉 A low around 5000 in April 2025
📈 Then an advance targeting 8000 by 2026
Update: April delivered exactly as projected.
The geometric patterns suggested April would mark a significant turning point, and the market found strong support right in the anticipated zone and timeframe.
About GEO+ Cycles:
After 15 years studying market geometry, I've developed a framework that identifies multi-decade structural patterns. These aren't traditional technical indicators—they're mathematical relationships that help project major turning points with remarkable precision.
Current Phase:
We're now in the advancing phase of this cycle. Based on geometric projections, the target window for 8000 remains January 2026.
Important Context:
This represents cycle analysis for educational purposes, not trading advice. The methodology focuses on identifying major structural turning points rather than short-term movements.
What's Next:
I'll continue tracking this cycle's development and provide updates as we approach key geometric levels.
For those interested in learning more about geometric market analysis, feel free to follow for updates on this and other cycle progressions.
The mathematics of market geometry continue to unfold...
Note: Originally published in Italian, now sharing these insights with the global TradingView community.

Macroeconomic analysis of the American marketHello investor friends,
today I bring an update on the macro economic state of the American economy which generally moves markets around the world.
From the graph we can see the S&P 500 index on which 4 lines have been superimposed which coincide with:
- FED interest rate
- FED balance sheet
- US inflation rate
- US unemployment rate
The vertical line on the graph coincides with the date of the last update I made 5 months ago.
The central bank decides interest rates and the injection of money with the aim of keeping inflation low and avoiding too much unemployment.
At the moment we have:
- Unemployment rate at 4% (remained unchanged)
- Inflation at 2.4% (decreased compared to 5 months ago)
- The balance / release of printed money (continues to fall)
- The interest rate remained unchanged (current 4.33%)
Compared to 5 months ago the situation seems to have improved and is quite stable. The FED has decided to keep rates unchanged due to political issues as it would like to see clearly before making cuts.
In general we can say that the situation seems quite good as, unemployment is low, inflation is at optimal levels, we see that the budget/money injection is decreasing and therefore leads to maintaining regular inflation and finally the interest rates being stable maintain a low level of unemployment.
Given these factors we see that since the last update 5 months ago (i.e. in February), in the following weeks there was a collapse due to Trump's policies but that it was certainly an excellent opportunity to increase positions given that the macroeconomic situation was positive as it currently is.
From today we could certainly expect further declines due to other monetary policies or other news, but as long as the macro situation is positive we have no reason to worry.
👍 Like if you want more macro updates in the future
🙋♂️ Follow me so you don't miss my future analyses
⚠️ Disclaimer: This post is for informational purposes only and does not constitute financial advice. Always do your research before making investment decisions.
SP:SPX FRED:SP500 VANTAGE:SP500 AMEX:SPY VANTAGE:DJ30 AMEX:DIA CME_MINI:NQ1! FX:NAS100 NASDAQ:QQQ FX:EUSTX50 FOREXCOM:GER40 FX:AUS200

$VIX Volatility Extremes, Narratives, Booms & Busts!TVC:VIX volatility index extremes have always been an important factor when assessing the cyclical nature of financial markets.
I demonstrate in this chart what values and narratives to look out for at these extremes. This can help ignore the noise when buying during low social mood / fearful events when everyone else is panic selling, and, selling during exuberance and booms when everyone else is FOMO buying.
This is the cyclical nature and intertwined relationship between media, events and financial markets that traders and Investors want to take advantage of.
Good times create positive social mood, exasperating over leveraging and booms with extreme positive news / silly price targets 'New Golden Age / Paradigm shift' style reporting.
This unwinds aggressively creating negative social mood which the media exasperate with 'fear and doom' reporting.
VIX is a useful tool to hedge against market uncertainty.
Safe trading

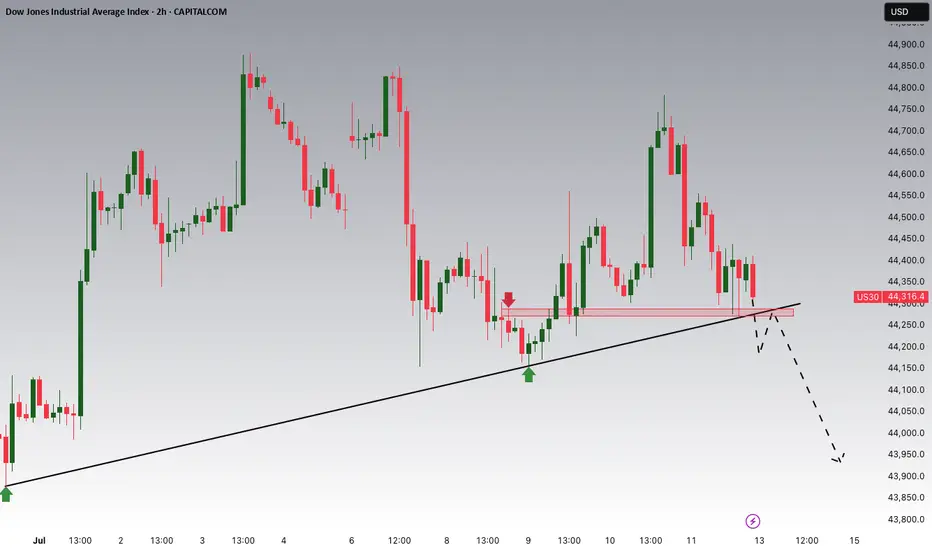
Dow Jones Potential DownsidesHey Traders, in the coming week we are monitoring US30 for a selling opportunity around 44,270 zone, US30 is trading in an uptrend and currently seems to be attempting to break it down, if we get dips below the trend we will be looking for a potential retrace towards further downsides.
Trade safe, Joe.
NASDAQ - BUYS📉➡️📈 USTEC 15min – Precision Long After Panic Drop
🎯 Reversal Detected | No Hesitation | Immediate Follow-Through
Markets don’t always give second chances. But when they do — you want to be ready.
This sharp drop on USTEC (NASDAQ 100) looked brutal to most...
But the ELFIEDT RSI + Reversion indicator calmly printed a double UP signal at the exact low.
🟢 The Signal: Two “UP” Prints at the Bottom
After a fast and aggressive drop, the system triggered two stacked UP signals right into the final selloff candle — giving clear guidance for a high-probability reversal.
🔹 Hypothetical Trade Setup:
Entry: On confirmation of the second UP signal
Stop-loss: Below the signal wick (minimal drawdown)
Reward: Price surged immediately, offering a strong rally of over 100 points in minutes
⏱️ No delay. No doubt.
✅ Traders were positioned before the herd caught on.
🧠 What Makes ELFIEDT Different?
This isn’t about standard indicators.
This is exhaustion logic fused with a proprietary RSI-based reversion model that works across indices, FX, metals, and more.
📌 Non-repainting
📌 Context-aware
📌 Built for real entries, not just “nice charts”
🔐 This is the public build.
The private builds include even more firepower:
Multi-timeframe confluence
Smart volatility filters
Divergence overlays
Breakout-retest logic
Institutional grade scalping layers
📩 DM to request access — limited spots, serious traders only.
#NASDAQ #USTEC #ReversalTrading #SmartSignals #ELFIEDT #RSIBounce #15MinStrategy #TradingView #Indices #Tech100

Canadian Venture index --- Inverse head & shouldersGold has reached unprecedented heights, approaching the $3000 mark—a prediction we made with precision. Now is the moment to turn our attention to silver and the mining sector.
To start, let's examine the Canadian venture index, which is displaying a promising inverse head and shoulders pattern. I am confident that the logarithmic projection will be achieved without much difficulty.

NQ: Upcoming Weekly analysis!FA Analysis:
1- Tariff On/Off: The noise will continue this week as well. Europe will be the target this week.
Uncertainty OR Eternity pause? Market might tend towards Eternity pause which is positive for stocks and equities.
2- New Earnings season: This will be on the driver seat for the next few weeks. Positive earnings for major stocks will impact positively NQ and vice-versa.
3- Macroeconomic data:
CPI and PPI will be relevant for July rate cut. Lower and inline inflation will be very good for July Rate cut; hence very good for Equities. Higher inflation data will be bad.
Also, Consumer sentiment and Inflation expectations, later in the week, will be very relevant.
So from FA Analysis, US equities might go either direction based on data outcomes.
TA Analysis:
Weekly TF: Direction is Buy!
The weekly close was irrelevant; it was inside the bullish green candle. Price must break and close below or above the master weekly candle to establish clear direction.
So nothing to trade from weekly perspective.
Daily TF: Direction is Neutral!
Same as weekly TF, we got an irrelevant daily close, inside the previous daily green candle (red dotted lines).
Price must break and close either below or above the dotted red lines for a clear direction.
Hourly TF: Direction is Neutral!
Based on the Weekly and Daily TF, clearly price is consolidating and looking for FA data to make decision on the next move.
Price is making LL-LH-HL-HH... and switching from one side to another reinforcing the consolidation.
Here are two scenarios:
Scenario 1: Good earnings, macroeconomic data and lower inflation will trigger a new ATH.
Scenario 2: Bad earnings, macroeconomic data and higher inflation will trigger a retrace.
Happy green week!

S&P 500 Daily Chart Analysis For Week of July 11, 2025Technical Analysis and Outlook:
During this trading week, the S&P 500 Index has shown a predominantly downward/upward course of action and created a new Key Resistance at 6280. Currently, the index exhibits a bullish bias, with the Outer Index Rally objective set at 6420. However, it is crucial to note that the current price action may cause prices to see in a new light from their current fluctuation to push toward the Mean Support at 6200 before resuming their upward movement.

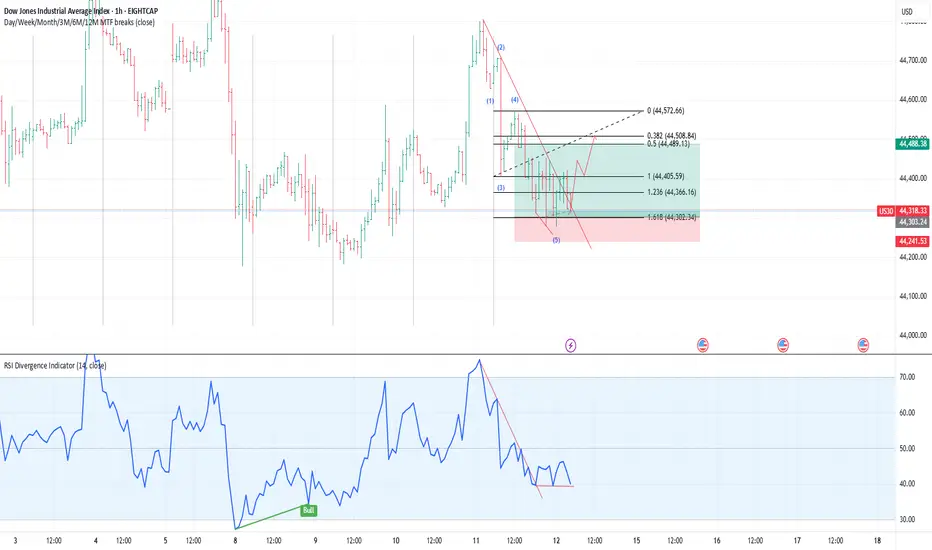
US30SIGNAL: BUY
A) SETUP: B (h1 wave5 to Correction)
B) CONFIRMATION:
1) SBT: done
2) RSI DIVERGENCE: done
3) MOMENTUM CANDLE: done
C) RR = 1:3
Possible Wyckoff top on US500I'll be looking for this wyckoff formation on US500.
Of a new ATH is forming in the next few days and we have a stong sell off, I'll be taking the short on the Test of the Spring.

Sector Rotation Strategy🌐 Sector Rotation Strategy: A Smart Way to Stay Ahead in the Stock Market
What Is Sector Rotation?
Imagine you're playing cricket. Some players shine in certain conditions — like a fast bowler on a bouncy pitch or a spinner on a turning track. The same idea applies to stock market sectors.
Sector Rotation is the process of shifting your money from one sector to another based on the market cycle, economic trends, or changing investor sentiment.
In simple words:
"You’re moving your money where the action is."
First, What Are Sectors?
The stock market is divided into different sectors, like:
Banking/Financials – HDFC Bank, Kotak Bank, SBI
IT– Infosys, TCS, Wipro
FMCG – HUL, Nestle, Dabur
Auto – Maruti, Tata Motors
Pharma – Sun Pharma, Cipla
Capital Goods/Infra – L&T, Siemens
PSU – BEL, BHEL, HAL
Real Estate, Metals, Energy, Telecom, etc.
Each sector behaves differently at various stages of the economy.
Why Is Sector Rotation Important?
Because all sectors don’t perform well all the time.
For example:
In a bull market, sectors like Auto, Capital Goods, and Infra usually lead.
During slowdowns, investors run to safe havens like FMCG and Pharma.
When inflation or crude oil rises, energy stocks tend to do better.
When interest rates drop, banking and real estate might shine.
So, instead of holding poor-performing sectors, smart investors rotate into the hot ones.
How Does Sector Rotation Work?
Let’s say you are an investor or trader.
Step-by-step guide:
Track the economy and markets
Is GDP growing fast? = Economy expanding
Are interest rates high? = Tight liquidity
Is inflation cooling down? = Growth opportunity
Observe sectoral indices
Check Nifty IT, Nifty Bank, Nifty FMCG, Nifty Pharma, etc.
See which are outperforming or lagging.
Watch for news flow
Budget announcements, RBI policy, global cues, crude oil prices, etc.
E.g., Defence orders boost PSU stocks like BEL or HAL.
Move your capital accordingly
If Infra and Capital Goods are breaking out, reduce exposure in IT or FMCG and rotate into Infra-heavy stocks.
Real Example (India, 2024–2025)
Example: Rotation from IT to PSU & Infra
In late 2023, IT stocks underperformed due to global slowdown and US recession fears.
Meanwhile, PSU and Infra stocks rallied big time because:
Government increased capital expenditure.
Defence contracts awarded.
Railway budget saw record allocations.
So, many smart investors rotated out of IT and into:
PSU Stocks: RVNL, BEL, HAL, BHEL
Capital Goods/Infra: L&T, Siemens, ABB
Railway Stocks: IRFC, IRCTC, Titagarh Wagons
This sector rotation gave 30%–100% returns in a few months for many stocks.
Tools You Can Use
Sectoral Charts on TradingView / Chartink / NSE
Use indicators like RSI, MACD, EMA crossover.
Compare sectors using “Relative Strength” vs Nifty.
Economic Calendar
Track RBI policy, inflation data, IIP, GDP, etc.
News Portals
Moneycontrol, Bloomberg, ET Markets, CNBC.
FIIs/DII Activity
Where the big money is going – this matters!
Sector Rotation Heatmaps
Some platforms show weekly/monthly performance of sectors.
📈 Sector Rotation Strategy for Traders
For short-term traders (swing/intraday):
Rotate into sectors showing strength in volumes, price action, breakouts.
Use tools like Open Interest (OI) for sector-based option strategies.
Example:
On expiry weeks, if Bank Nifty is showing strength with rising OI and volume, rotate capital into banking-related trades (Axis, ICICI, SBI).
Sector Rotation for Long-Term Investors
For investors, sector rotation can be used:
To reduce drawdowns.
To book profits and re-enter at better levels.
To ride economic trends.
Example:
If you had exited IT in late 2022 after a rally, and entered PSU stocks in early 2023, your portfolio would’ve seen better growth.
Pros of Sector Rotation
Better returns compared to static investing
Helps avoid underperforming sectors
Takes advantage of macro trends
Works in both bull and bear markets
Cons or Risks
Requires monitoring and active management
Timing the rotation is difficult
Wrong rotation = underperformance
May incur tax if frequent buying/selling (for investors)
Pro Tips
Don't rotate too fast; let the trend confirm.
Use SIPs or staggered entry in new sectors.
Avoid “hot tips”; follow actual price and volume.
Blend sector rotation with strong stock selection (don’t just chase sector).
Conclusion
The Sector Rotation Strategy is one of the smartest, most practical tools used by both traders and investors. You don’t need to be a pro to use it — just stay alert to the market mood, economic cycles, and where the money is moving.
Think of it as dancing with the market:
“When the music changes, you change your steps.”
Keep rotating. Keep growing.