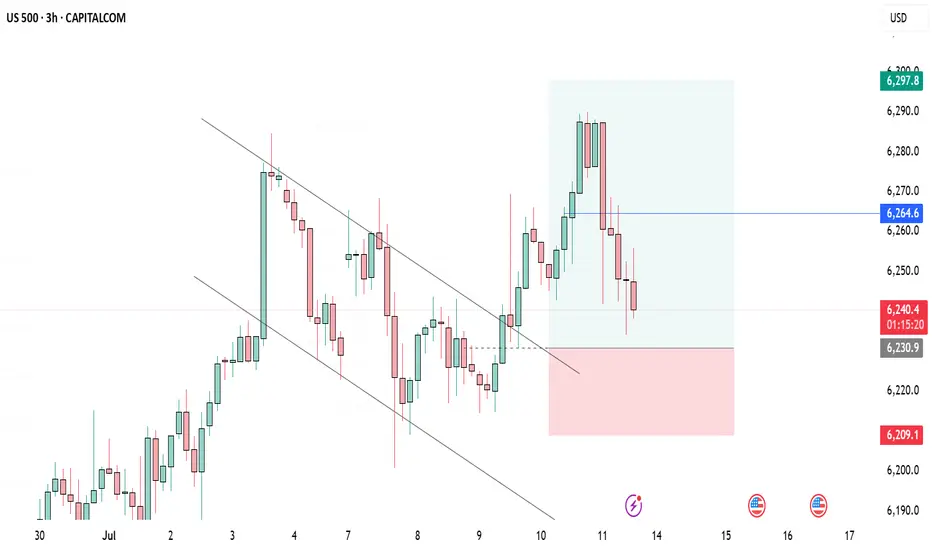
Short Term Risk On S&PMomentum is slowing on the S&P 500.
HT still looking nice.
Short term chance of a correction to around 6140 - conservative, potentially to 6070 if we see a deeper sell off.
Wouldn't want to be a buyer until we see a pullback like this or some strength.
Market indices

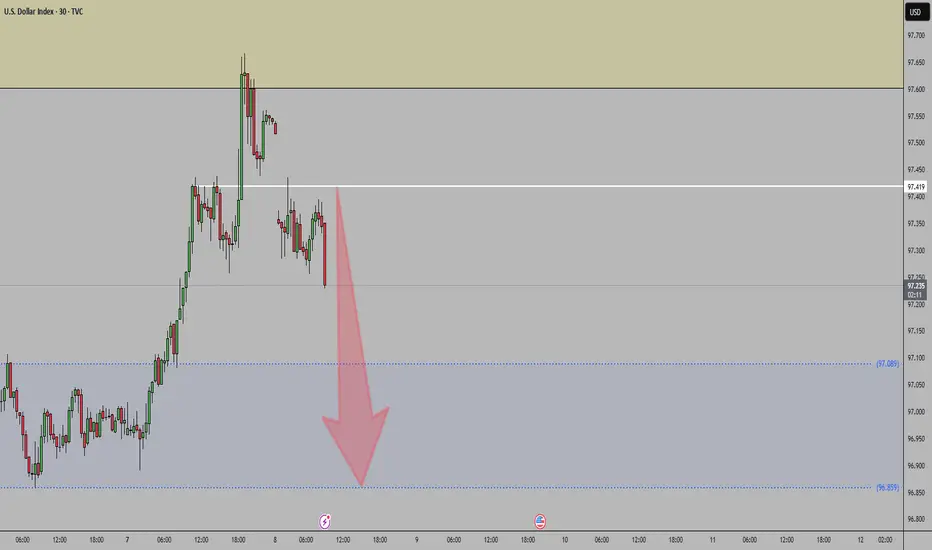
DXY Targeting Liquidity Zones & Gap Fill Before Potential ReversThe U.S. Dollar Index (DXY) is showing a strong bullish push, climbing steadily along an ascending trendline. Price appears to be heading toward key liquidity levels and a visible Fair Value Gap (FVG) near the previous New York high. The chart also highlights an unfilled gap above, which aligns with a potential liquidity sweep scenario.
Once these upper zones are tapped — including the liquidity and imbalance areas — a significant rejection could follow, especially considering ongoing strength in the Euro (EUR). This setup suggests a high-probability reversal opportunity after the liquidity grab

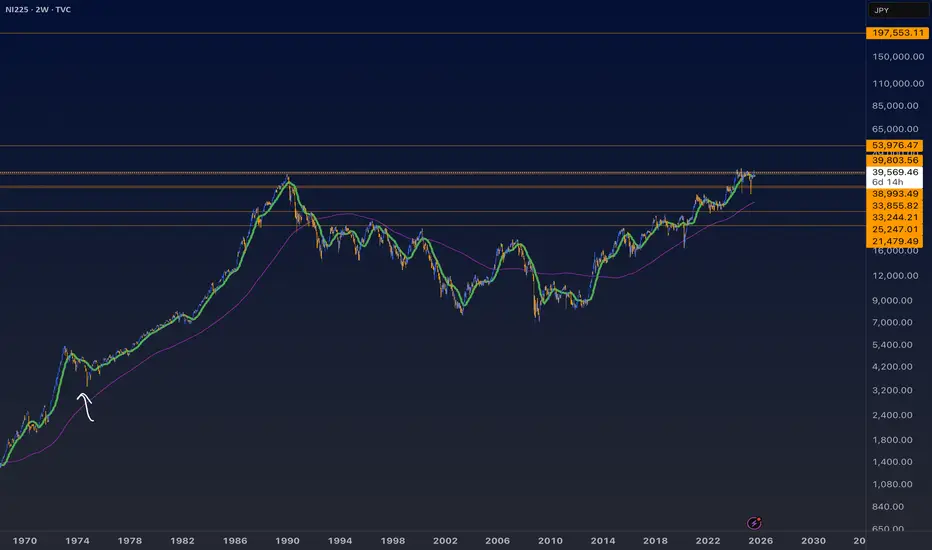
NI225 NIKKEI 225 25-7-11Japan stocks remind me the most of this time in 1975, which marked a bottom. It’s not identical at all. Just the closest I could compare it to. It’s at all time highs and after a year or so of consolidation. The thing is now looks even better for a textbook W reversal up now. It’s a striking pattern really you can clearly see it. I wouldn’t be surprised if it makes more spikes back down though also before resuming an upward trend.
NIFTY S/R for 14/7/25Support and Resistance Levels:
Support Levels: These are price points (green line/shade) where a downward trend may be halted due to a concentration of buying interest. Imagine them as a safety net where buyers step in, preventing further decline.
Resistance Levels: Conversely, resistance levels (red line/shade) are where upward trends might stall due to increased selling interest. They act like a ceiling where sellers come in to push prices down.
Breakouts:
Bullish Breakout: When the price moves above resistance, it often indicates strong buying interest and the potential for a continued uptrend. Traders may view this as a signal to buy or hold.
Bearish Breakout: When the price falls below support, it can signal strong selling interest and the potential for a continued downtrend. Traders might see this as a cue to sell or avoid buying.
MA Ribbon (EMA 20, EMA 50, EMA 100, EMA 200) :
Above EMA: If the stock price is above the EMA, it suggests a potential uptrend or bullish momentum.
Below EMA: If the stock price is below the EMA, it indicates a potential downtrend or bearish momentum.
Trendline: A trendline is a straight line drawn on a chart to represent the general direction of a data point set.
Uptrend Line: Drawn by connecting the lows in an upward trend. Indicates that the price is moving higher over time. Acts as a support level, where prices tend to bounce upward.
Downtrend Line: Drawn by connecting the highs in a downward trend. Indicates that the price is moving lower over time. It acts as a resistance level, where prices tend to drop.
Disclaimer:
I am not a SEBI registered. The information provided here is for learning purposes only and should not be interpreted as financial advice. Consider the broader market context and consult with a qualified financial advisor before making investment decisions.

DXY: The Market Is Looking Down! Short!
My dear friends,
Today we will analyse DXY together☺️
The in-trend continuation seems likely as the current long-term trend appears to be strong, and price is holding above a key level of 97.370 So a bullish continuation seems plausible, targeting the next high. We should enter on confirmation, and place a stop-loss beyond the recent swing level.
❤️Sending you lots of Love and Hugs❤️

Gap down is likely a bear trap - SPYSo the gap down looked bearish but the technicals are not confirming it. One more high is likely today or Monday. Gold is at resistance here. OIl found support and looks like a long. BTC rallied and can go higher but it's putting in daily bearish divergences. Natural Gas looks like it will bounce.

SellTrend Line Break
Previous Day Volume
Weekly Rejection Point
Untapped Order Point
London - US Session
Three Tap High Structure/ Double Top

$SPX Today’s Trading Range and everything in it /// 7.11.25
Beautiful start here right at the bottom of the expected move. 6245/6230 bull put spreads right at open filled. Just look at the chart to see how I came up with that.

DXY strengthens but can it break THIS key level?The US dollar has gained ground this week, with the Dollar Index rising to retest the previously broken April low near the 97.92 level—an important technical zone. The short-term bias would flip to being bullish if this area breaks.
The greenback’s strength has been underpinned in part by unexpectedly strong economic data. For instance, Thursday’s weekly jobless claims came in at 227,000, below the forecast of 235,000. This marks the fourth consecutive weekly decline and the lowest reading in seven weeks, reinforcing the view that the US labour market remains tighter than anticipated.
Adding to this backdrop are President Trump’s threats of higher tariffs and expansive fiscal plans—described as “big, beautiful” spending and tax initiatives. These factors increase the risk of more persistent inflation.
While the Federal Reserve is still widely expected to initiate rate cuts in September, the rising inflationary pressures could slow the pace of easing thereafter. This shift would likely provide support for the dollar so long as investors don't lose trust in US monetary policy.
By Fawad Razaqzada, market analyst with FOREX.com

Quick take on the S&P500From the very short-term perspective, the SP:SPX is currently stuck in a tight range. Waiting for a little breakout.
Let us know what you think in the comments below.
Thank you.
75.2% of retail investor accounts lose money when trading CFDs with this provider. You should consider whether you understand how CFDs work and whether you can afford to take the high risk of losing your money. Past performance is not necessarily indicative of future results. The value of investments may fall as well as rise and the investor may not get back the amount initially invested. This content is not intended for nor applicable to residents of the UK. Cryptocurrency CFDs and spread bets are restricted in the UK for all retail clients.

DXY Speculators are still net short on the U.S. Dollar Index.
But the short bias has decreased → sentiment is less bearish than before.
This shift could suggest a potential dollar rebound or profit-taking on bearish positions.
NasdaqNon-commercials (hedge funds, asset managers, etc.) are adding significant long exposure.
This usually reflects confidence in continued upside, often in line with strong tech earnings, soft landing narratives, or a dovish Fed.
Bias: Bullish
Large speculators significantly increased long exposure on Nasdaq futures, showing strong confidence in continued upside momentum. This aligns with recent tech-led rallies and soft-landing expectations.

DowJones bullish breakout retest?Key Support and Resistance Levels
Resistance Level 1: 45000
Resistance Level 2: 45445
Resistance Level 3: 46000
Support Level 1: 44000
Support Level 2: 43700
Support Level 3: 43430
This communication is for informational purposes only and should not be viewed as any form of recommendation as to a particular course of action or as investment advice. It is not intended as an offer or solicitation for the purchase or sale of any financial instrument or as an official confirmation of any transaction. Opinions, estimates and assumptions expressed herein are made as of the date of this communication and are subject to change without notice. This communication has been prepared based upon information, including market prices, data and other information, believed to be reliable; however, Trade Nation does not warrant its completeness or accuracy. All market prices and market data contained in or attached to this communication are indicative and subject to change without notice.

DXY Bearish Bias
Institutions are currently holding a net short position on the Dollar, indicating bearish sentiment. With a net position of -4,282, we may expect continued weakness in the DXY, especially if price reacts from key supply zones. Swing traders should remain cautious with long setups and prioritize opportunities aligned with USD weakness across major pairs.

NSDQ100 Bullish breakout retest?Donald Trump escalated trade tensions again, threatening a 35% tariff on Canadian goods shortly after reopening trade talks, and floated doubling global tariffs to 20%. This reinforces his aggressive protectionist stance and puts renewed pressure on allies like Canada and Vietnam, the latter blindsided by a 20% levy. Meanwhile, US-China relations may be entering a critical phase, with a possible Trump-Xi summit hinted at by Marco Rubio during talks in Malaysia.
On the geopolitical front, Trump is signaling a harder line on Russia, previewing a “major statement” and backing expanded sanctions as the US sends more weapons to Ukraine. This raises global uncertainty, especially for energy and defense sectors.
Conclusion for NSDQ100 trading:
Rising trade tensions and geopolitical risks may dampen market sentiment and lead to volatility in tech-heavy Nasdaq stocks, particularly those reliant on global supply chains. While traders have grown numb to tariff talk, the cumulative pressure suggests a downside risk is building. In the short term, maintain a cautious stance—watch for potential pullbacks and heightened intraday volatility as policy clarity remains elusive.
Key Support and Resistance Levels
Resistance Level 1: 22940
Resistance Level 2: 23060
Resistance Level 3: 23180
Support Level 1: 22410
Support Level 2: 22300
Support Level 3: 22130
This communication is for informational purposes only and should not be viewed as any form of recommendation as to a particular course of action or as investment advice. It is not intended as an offer or solicitation for the purchase or sale of any financial instrument or as an official confirmation of any transaction. Opinions, estimates and assumptions expressed herein are made as of the date of this communication and are subject to change without notice. This communication has been prepared based upon information, including market prices, data and other information, believed to be reliable; however, Trade Nation does not warrant its completeness or accuracy. All market prices and market data contained in or attached to this communication are indicative and subject to change without notice.

Do you agree with a big profit in US30?
Hello friend
Do you think the orange line will break?
What if it breaks?
Just wait and collect the money.
If you liked my analysis, please support me by liking, commenting and subscribing. Thanks friend

are we going ath? let us now~~indices looks green, so we rally?
no trump tariffs?
🐉We value full transparency. All wins and fails fully publicized, zero edit, zero delete, zero fakes.🐉
🐉Check out our socials for some nice insights.🐉
information created and published doesn't constitute investment advice!
NOT financial advice

SPX500 Bearish Below 6246 – Eyes 6223 and 6195SPX500 Analysis
SPX500 stays under bearish pressure below 6246, targeting 6223 and possibly 6195 if the decline continues.
Recent tariff escalation by President Trump is adding weight to downside momentum across indices.
Pivot: 6246
Support: 6223, 6195, 6143
Resistance: 6268, 6291

Institutional Trading Process 1. Investment Idea Generation
This is where it all begins.
Institutions generate trading ideas based on:
Fundamental research (company earnings, macroeconomic data)
Quantitative models (statistical or algorithmic strategies)
Technical analysis (price action, trends, volume)
Sentiment analysis (news flow, social media, market psychology)
Often, the research team, quant team, or portfolio managers work together to develop high-conviction trade ideas backed by data and analysis.
2. Pre-Trade Analysis and Risk Assessment
Before placing a trade, institutions perform:
Risk/reward analysis
Scenario testing (How does the trade perform in different market conditions?)
Volatility analysis
Position sizing based on portfolio risk budget

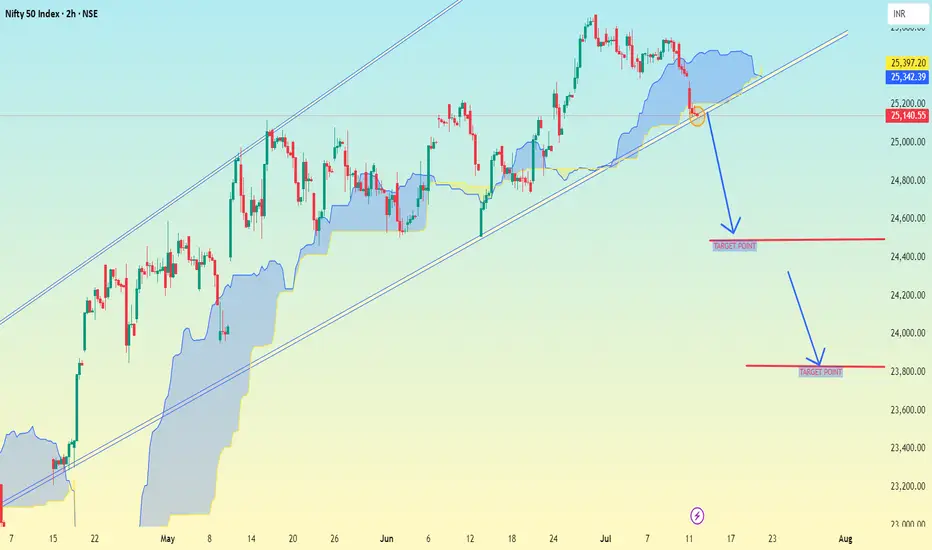
Nifty 50 Index (2h time frame)Nifty 50 Index (2h time frame), here is the analysis and potential target levels:
🔍 Technical Breakdown:
Trendline Break: The chart shows a rising trendline which has been broken to the downside.
Ichimoku Cloud: Price has moved below the cloud, indicating bearish momentum.
Arrows & Levels: Two downward arrows suggest potential drop zones.
🎯 Target Levels (as marked on chart):
1. First Target Zone:
📍 Around 24,400
Likely first support zone / take-profit level after breakdown.
2. Second Target Zone:
📍 Around 23,800
Deeper correction zone based on prior support and structure.
✅ Summary:
If the breakdown sustains below the trendline and cloud:
Immediate target: 24,400
Extended target: 23,800
Let me know if you want stop-loss ideas or a risk/reward plan for this trade.
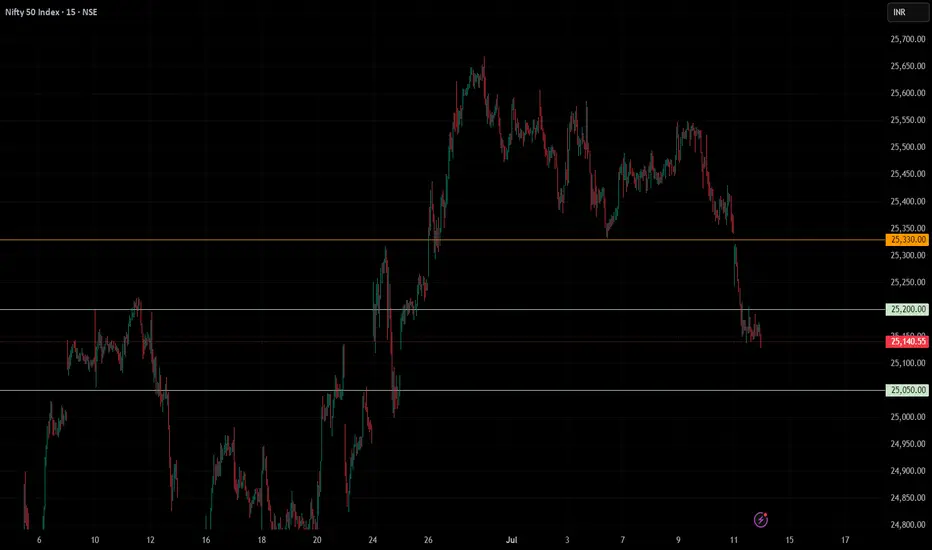
NIFTY BROKE DOWN SUPPORT LEVEL,BUT SOME BOUNCE BACK IS EXPECTEDNIFTY Analysis Update
Recent Price Action
- The **25330** level acted as a significant support zone, as discussed previously.
- The market opened with a gap down below 25330, confirming bearish pressure.
- The next anticipated support at **25200** was also breached, and the session closed below this level.
- With these supports broken, the **25050–25000** range is now identified as the next key support zone.
Technical Indicators
- The **Relative Strength Index (RSI)** is showing extreme oversold conditions across smaller timeframes.
- Such oversold readings typically suggest the potential for a technical bounce or reversal, as selling momentum may be exhausted.
Outlook for Monday
- Given the oversold RSI, there is a heightened probability of a **reversal or bounce** on Monday.
- A rebound towards the **25500-25700** zone is possible, which could serve as a near-term resistance or top before the next directional move.
- If the market manages to close in green, it would confirm the short-term reversal thesis.
Key Levels to Watch
25330: Previous major support (broken)
25200: Next support (broken)
25050–25000: Current support zone
25500-25700: Potential bounce/reversal target
Summary
- **Immediate trend:** Bearish pressure persists after key supports were broken.
- **Short-term outlook:** Oversold conditions suggest a potential bounce; watch for a move toward 25700.
- **Risk:** Failure to hold 25000 could trigger further downside.
Monitor price action closely around the support and resistance zones, and watch for confirmation of reversal signals on Monday.
Bearish Momentum Builds Below pivot zone USNAS100 Analysis
Price has reversed from its ATH and now shows bearish momentum.
Below 22705, downside targets are 22615 and 22420.
Bullish scenario only valid if price breaks and holds above 22815.
Pivot: 22710
Support: 22615, 22420
Resistance: 22815, 22910
