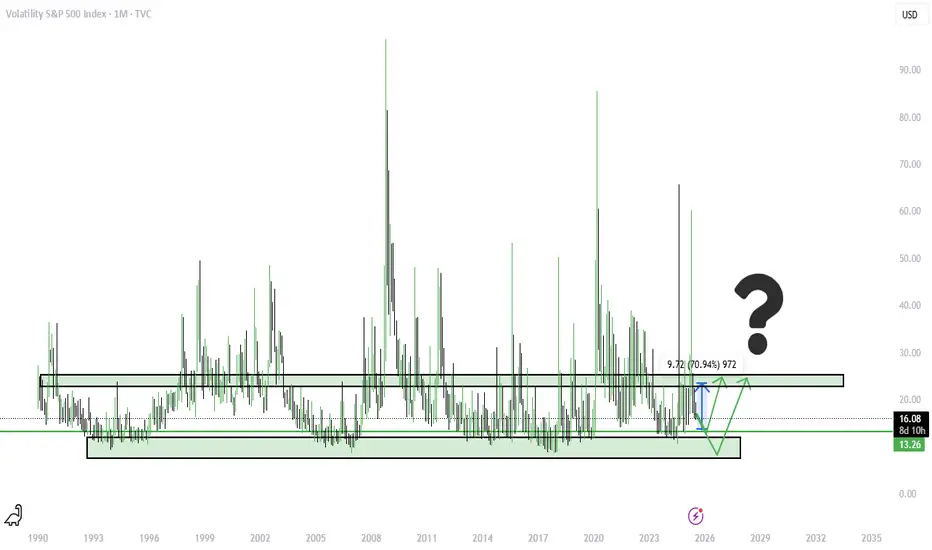
VIX possible long?As equity markets continue to approach all-time highs and expectations of interest rate cuts increase, market sentiment remains highly optimistic. This environment of "good news" characterized by strong performance in equities and the anticipated easing of monetary policy is likely to suppress volatility in the short term, potentially pushing the VIX down into the 12–15 range.
However, this period of euphoria may mask underlying risks. Stock valuations appear stretched, and the crypto market is exhibiting signs of overheating. If corporate earnings begin to miss expectations or if signs of economic slowdown emerge particularly if the economy shows signs of overheating before stabilizing market sentiment could shift rapidly. In such a scenario, volatility may spike again, with the VIX potentially rising back into the 20–25 range as uncertainty returns and risk appetite diminishes.
-Disclaimer: This analysis is for informational and educational purposes only and does not constitute financial advice, investment recommendation, or an offer to buy or sell any securities. Stock prices, valuations, and performance metrics are subject to change and may be outdated. Always conduct your own due diligence and consult with a licensed financial advisor before making investment decisions. The information presented may contain inaccuracies and should not be solely relied upon for financial decisions. I am not personally liable for your own losses, this is not financial advise.
Market indices
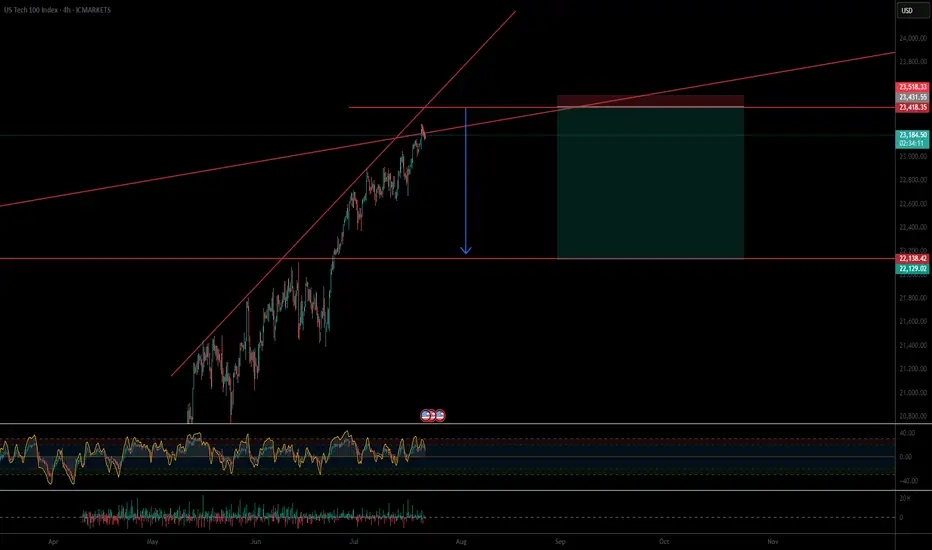
Powell speech inspired SHORT for NAS100If the price reaches my set zone, i believe it will dump to collect liquidity before making new ATHs.
Tiny SL, huge TP.
good luck
NAS100 Bullish Setup: Clean Structure & Entry Zone Pending📊 NASDAQ 100 (NAS100) remains bullish, showing a clean, well-structured uptrend—higher highs and higher lows 🔼📈.
Price has now pulled back into my optimal entry zone 🎯. At this stage, I’m waiting for a bullish break in market structure before considering an entry 🟢🔓.
Patience is key—let the structure confirm first.
Not financial advice ❌💼

DAX / DE30 Long Day TradeXETR:DAX / ICMARKETS:DE30 taking a pullback towards up, catching this pullback.
These are good levels if you trade nicely.
Use proper risk management
Looks like good trade.
Lets monitor.
Use proper risk management.
Disclaimer: only idea, not advice

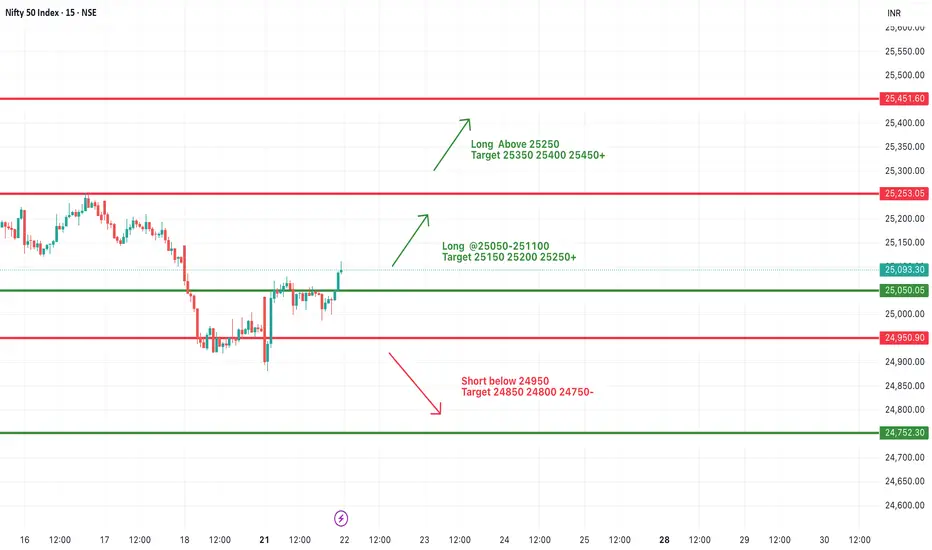
#NIFTY Intraday Support and Resistance Levels - 22/07/2025Today, Nifty is expected to open slightly gap-up, indicating positive early sentiment. After breaking out from the previous day’s consolidation zone, the index has shown strength around the 25,050 level, which will now act as an important intraday support. If this level is held during the early session, we can expect further upside continuation.
A move above the 25,050–25,100 zone can trigger upward momentum with potential targets at 25,150, 25,200, and 25,250+. Sustained strength above 25,250 will open the door for further bullish moves toward 25,350, 25,400, and 25,450+, making it a favorable long scenario for trending market conditions.
However, if the index fails to hold above the 25,050 level and starts trading back below 24,950, it may again enter a bearish territory. In such a case, downside targets of 24,850, 24,800, and 24,750- are possible, indicating weakness and reversal from resistance.
NASDAQ Rebounding on its 1H MA50.Nasdaq (NDX) rebounded today on its 1H MA50 (blue trend-line), third time since Friday's and Thursday's bounce. A Channel Up is emerging and based on the 4H RSI it is a medium-term bullish reversal off the Pivot trend-line, similar to June 20 - 30.
As you can see, that Channel Up targeted the 2.618 Fibonacci extension before breaking below the 1H MA50 to start a lengthy consolidation. Based on that, we are targeting 23650 (Fib 2.618 ext) on the short-term.
-------------------------------------------------------------------------------
** Please LIKE 👍, FOLLOW ✅, SHARE 🙌 and COMMENT ✍ if you enjoy this idea! Also share your ideas and charts in the comments section below! This is best way to keep it relevant, support us, keep the content here free and allow the idea to reach as many people as possible. **
-------------------------------------------------------------------------------
Disclosure: I am part of Trade Nation's Influencer program and receive a monthly fee for using their TradingView charts in my analysis.
💸💸💸💸💸💸
👇 👇 👇 👇 👇 👇

KOG - US30US30
Looking at this we have a clean reversal in play suggesting we’re going to get lower order regions before a potential RIP. The red boxes have been added and may give us opportunities to capture the tap and bounces on the smaller TFs.
If we can support lower, we could very well see this push up into the ideal target level we have illustrated.
Please do support us by hitting the like button, leaving a comment, and giving us a follow. We’ve been doing this for a long time now providing traders with in-depth free analysis on Gold, so your likes and comments are very much appreciated.
As always, trade safe.
KOG

US30 Robbery Blueprint: Breakout, Pullback, Escape Setup💎 Dow Jones Robbery Blueprint: The US30 Vault Crack Plan 💎
(Maximized for reach — within TradingView title limit)
🌟Hi! Hola! Ola! Bonjour! Hallo! Marhaba!🌟
Dear Market Robbers & Money Movers 🕵️♂️💰🚨
This ain't your average analysis — it’s a Thief Trader-style 🔥tactical mission🔥 aimed at the mighty "US30/DJI" (Dow Jones Industrial Average). We're talkin' about a precision heist with a full blueprint: entry zones, trap setups, and escape exits. Read carefully — this ain’t for the faint-hearted traders! 🧠🦾
🧠 Entry Zones (The Break-In) 📈
🛠 ENTRY 1: Crack the wall near 44700.00 – that’s the resistance gate. Wait for confirmation.
🎯 ENTRY 2: Sneak in at the Market Makers’ Trap around 43500.00 – a dirty zone where retailers get baited. Perfect time to strike long!
🧱 DCA/Layering strategy recommended. Stack those buy orders like a thief layering explosives on a safe. 💣💸
🛑 Risk Levels (Escape Routes/Stop Loss)
🔊 "Listen up, vault raiders! Never drop your SL until breakout is confirmed. If you jump early, you might land in a bear trap! 🪤"
🔐 Stop Zones (Based on Strategy):
📌 Swing Buy SL (2H TF): Place at 44100.00 for the stealth buy.
🏦 Institutional SL (Swing Zone): Drop it around 43000.00
🔐 Max Risk SL (3H TF): If you're deep, your last stand is at 39200.00
☝️ SL depends on your position sizing, number of entries, and risk appetite. Trade like a thief, not a gambler.
🎯 Heist Target (Profit Exit)
🏁 Escape Point: 46200.00 — or exit before heat rises! Don’t be greedy. Rob and vanish. 💨💰
🔥 Market Mood: Why the Heist Is On
"US30/DJI" is bullish AF — thanks to:
📊 Macro-Economic Wind at Our Back
📈 Institutional momentum
📰 Strong sentiment and intermarket flows
Check your chart radar: Fundamentals + technicals aligning = green light for robbery! 🟢
⚠️ Tactical Reminder: News Can Jam the Plan
📵 Avoid new entries during major economic releases
🛡 Use trailing SLs to protect running trades
Stay alert, stay alive. 💡
❤️ Support the Robbery Crew
Hit that 💥BOOST💥 — your love fuels our next mission.
Join us and ride daily heist plans with Thief Trading Style 🏴☠️🚀💰

I am 100 % short spy and qqq I am BULLISH DXY the chart posted is now setup for the cycle top On several cycles and we have just popped the Shiller p/e above 3866 second highest reading ever . Cycle are into a peak that was due 7/5 to 7/14 So why are we now turning down .? wait the energy from one of the largest solar storms is the time for the transition it is also a new moon . my spirals have called for the top as it did in 12/5 and 2/17 . I see a min drop of over 8 and could see well over 11.8 within the next 90 days . best of trades WAVETIMER

US30 continues to exhibit bullish momentumThe US30 index continues to exhibit bullish momentum, driven by strong earnings reports and robust U.S. economic data. The key support zone around 44,300 has held firm, reinforcing confidence among buyers.
As long as the price remains above 44,300, the uptrend is expected to persist Upside target: 45,000 remains in focus. a focus on the 1H Candle close above 44,000 we could expect price could push more upside.
You may find more details in the chart Trade wisely best of luck buddies
Ps: Support with like and comments for better analysis Thanks for Supporting.

Nifty levels - Jul 23, 2025Nifty support and resistance levels are valuable tools for making informed trading decisions, specifically when combined with the analysis of 5-minute timeframe candlesticks and VWAP. By closely monitoring these levels and observing the price movements within this timeframe, traders can enhance the accuracy of their entry and exit points. It is important to bear in mind that support and resistance levels are not fixed, and they can change over time as market conditions evolve.
The dashed lines on the chart indicate the reaction levels, serving as additional points of significance to consider. Furthermore, take note of the response at the levels of the High, Low, and Close values from the day prior.
We hope you find this information beneficial in your trading endeavors.
* If you found the idea appealing, kindly tap the Boost icon located below the chart. We encourage you to share your thoughts and comments regarding it.
Wishing you success in your trading activities!

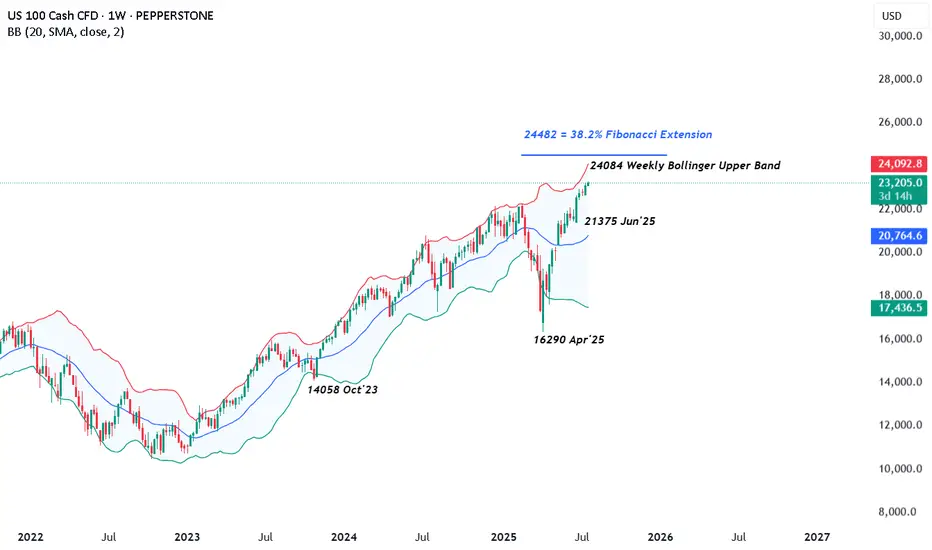
US 100 – All Eyes on Tariffs, Trade Deals and Tech EarningsRenewed demand for US assets has been evident throughout July so far and this has helped to lift the US 100 index to new heights with gains of over 2.5% across the month. The technology heavy index has risen from opening levels around 22650 on July 1st, then recorded several all time highs, before eventually finding some selling interest after printing the most recent record peak at 23282 yesterday afternoon.
This upside has been supported by fresh trader hopes of interest rate cuts, after Federal Reserve (Fed) policymaker Waller suggested last Thursday that he would consider a 25bps (0.25%) reduction at their next meeting on July 30th, despite Fed Chairman Powell maintaining the view that the US central bank are currently pursuing a wait and see approach, as they look for more information on inflation and growth trends to assist them to determine the on-going impact of tariffs.
Part of the reason for the Fed’s reluctance to cut rates has also been the resilience of US economic data. With US consumers still spending and employment yet to feel the negative impact of President Trump’s tariff policies, leading to a potential positive knock-on impact for growth and corporate earnings, when considered against prior downbeat market expectations.
This all leads nicely onto what could be a key sentiment driver for the direction of the US 100 this week, the start of earnings updates from the ‘Magnificent Seven’ tech companies, two of which, Alphabet and Tesla, report their earnings after the market close tomorrow. These are then followed by Microsoft and Meta on Wednesday July 30th, then Amazon and Apple on Thursday July 31st.
Traders will be keen to judge actual earnings against market expectations, alongside updates on AI spending and investment, forward guidance on the impact of tariffs and more specifically for Tesla, the time Elon Musk may dedicate to the company, rather than the distractions of politics.
The technical outlook could also be important.
Technical Update: Can The Positive Trend Extend Further?
There appears to be no clear-cut signs of a negative sentiment shift in the US 100 index yet, as fresh buying has continued to develop above support provided by the rising daily Bollinger mid-average, currently at 22785 (see chart below).
Of course, there is no guarantee this positive pattern of higher price highs and higher price lows will continue, especially given the on-going trade discussion between the US and its allies, as well as the earnings announcements from Alphabet and Tesla.
However, it can be useful for traders to prepare for any future volatility by assessing potential support and resistance levels that could impact the direction of the US 100 moving forward.
Potential Support Levels:
It is possible the rising Bollinger mid-average, currently at 22785, represents a first support focus for traders, and as such, closing breaks below this level might lead to a more extended phase of price weakness.
Such moves could see a deeper sell-off towards 22533, which is equal to the 38.2% Fibonacci retracement of June 23rd to July 18th 2025 price strength.
Potential Resistance Levels:
With fresh price strength emerging with the US 100 index above the rising Bollinger mid-average, a positive price pattern of higher highs and higher lows, may still be evident. This reflects buyers are currently willing to pay higher prices, each time a setback materialises.
However, to maintain this uptrend pattern in price, the focus could now be on resistance provided by the July high at 23282 (July 21st). Closing breaks above this level might be required to suggest further strength, towards the next potential resistance level at 24084, which is the weekly Bollinger upper band, even 24482, which is equal to the 38.2% Fibonacci extension.
The material provided here has not been prepared in accordance with legal requirements designed to promote the independence of investment research and as such is considered to be a marketing communication. Whilst it is not subject to any prohibition on dealing ahead of the dissemination of investment research, we will not seek to take any advantage before providing it to our clients.
Pepperstone doesn’t represent that the material provided here is accurate, current or complete, and therefore shouldn’t be relied upon as such. The information, whether from a third party or not, isn’t to be considered as a recommendation; or an offer to buy or sell; or the solicitation of an offer to buy or sell any security, financial product or instrument; or to participate in any particular trading strategy. It does not take into account readers’ financial situation or investment objectives. We advise any readers of this content to seek their own advice. Without the approval of Pepperstone, reproduction or redistribution of this information isn’t permitted.
BankNifty levels - Jul 23, 2025Utilizing the support and resistance levels of BankNifty, along with the 5-minute timeframe candlesticks and VWAP, can enhance the precision of trade entries and exits on or near these levels. It is crucial to recognize that these levels are not static, and they undergo alterations as market dynamics evolve.
The dashed lines on the chart indicate the reaction levels, serving as additional points of significance. Furthermore, take note of the response at the levels of the High, Low, and Close values from the day prior.
We trust that this information proves valuable to you.
* If you found the idea appealing, kindly tap the Boost icon located below the chart. We encourage you to share your thoughts and comments regarding it.
Wishing you successful trading endeavors!

US30Given the current COT data, technical indicators, and economic factors, the bias for the US30 is bearish. Traders should monitor upcoming economic reports and Federal Reserve announcements for potential shifts in market sentiment.

S&P's "hugely overbought" towards 6375!1). Position Volume dropping! 2). Big institutions (Banks & Insurance) have backed off on higher Risk positions! 3). Huge resistance at .728 fib & trend! 4). Trump tariff talk is likely adding to a fall as well! 5). We're looking for a "SELL" trade @ 6375, since buying is too risky at the moment...Good Luck!

Bearish drop?DAX40 (DE40) has rejected off the pivot and could drop to the 1st support.
Pivot: 24,312.44
1st Support: 24,094.70
1st Resistance: 24,490.38
Risk Warning:
Trading Forex and CFDs carries a high level of risk to your capital and you should only trade with money you can afford to lose. Trading Forex and CFDs may not be suitable for all investors, so please ensure that you fully understand the risks involved and seek independent advice if necessary.
Disclaimer:
The above opinions given constitute general market commentary, and do not constitute the opinion or advice of IC Markets or any form of personal or investment advice.
Any opinions, news, research, analyses, prices, other information, or links to third-party sites contained on this website are provided on an "as-is" basis, are intended only to be informative, is not an advice nor a recommendation, nor research, or a record of our trading prices, or an offer of, or solicitation for a transaction in any financial instrument and thus should not be treated as such. The information provided does not involve any specific investment objectives, financial situation and needs of any specific person who may receive it. Please be aware, that past performance is not a reliable indicator of future performance and/or results. Past Performance or Forward-looking scenarios based upon the reasonable beliefs of the third-party provider are not a guarantee of future performance. Actual results may differ materially from those anticipated in forward-looking or past performance statements. IC Markets makes no representation or warranty and assumes no liability as to the accuracy or completeness of the information provided, nor any loss arising from any investment based on a recommendation, forecast or any information supplied by any third-party.

#NDQ - Monthly Targets: 23721.73 or 21387.86?Date: 03-07-2025
#NDQ - Current Price: 22641.89
Pivot Point: 22554.80 Support: 22276.15 Resistance: 22835.11
Upside Targets:
Target 1: 23028.36
Target 2: 23221.62
Target 3: 23471.67
Target 4: 23721.73
Downside Targets:
Target 1: 22082.06
Target 2: 21887.98
Target 3: 21637.92
Target 4: 21387.86

US30Recent COT data shows rising net short positions on U.S. equity indices, reflecting bearish sentiment from institutional traders toward the Dow (US30). This indicates growing caution or expectations of downside pressure.

Intraday Pullback Understanding the higher timeframe is going to make a run for liquidity,
Intraday it will need to try to take out the shorters of last week.
Expecting a long on the 5m and the 15m towards Poi
Trade the plan & Plan the trade!
Trojan Trading Academy

Waiting for a Clear Signal: Too Early to Short the IndexNothing interesting is forming on the index so far.
My outlook remains neutral.
I previously attempted to short it, but those attempts were unsuccessful. Now I need to wait for a more reliable entry point — the chart will show the way.
For now, I’m staying on the sidelines.
Historically, the start of the Fed’s rate-cutting cycle has always coincided with the beginning of a decline in the stock market. I believe this time won’t be an exception — but for now, it’s too early to short.
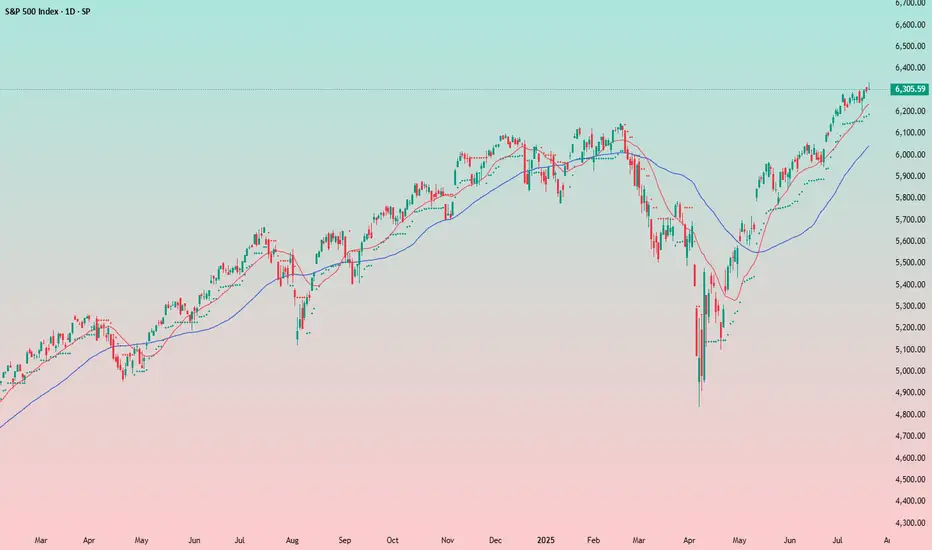
SPX - Time for a correction? To make it very simple,
Prices have been going up very nicely those last few weeks and months.
Everyone is happy but as we know that can't last.
NASDAQ:OPEN seems to be the latest pump and dump and it's just another sign of a coming correction imho.
Most stocks I've been following have reached resistance zone, levels where profit taking is very likely.
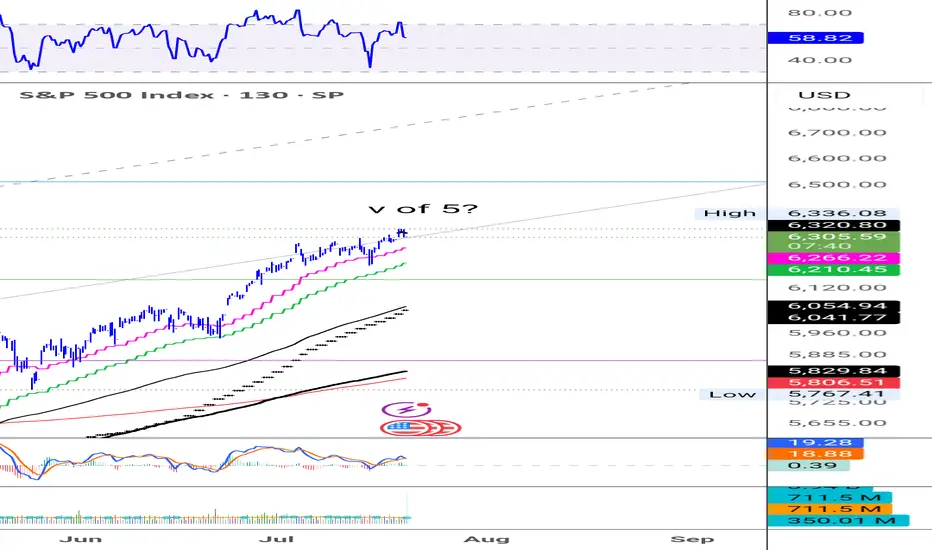
$S&P500 seems to have made a fifth wave, RSI divergence is present and confirming that.
It's difficult to pinpoint the exact top of course so I'm giving myself some leeway and use a small 1% stop loss in this case.
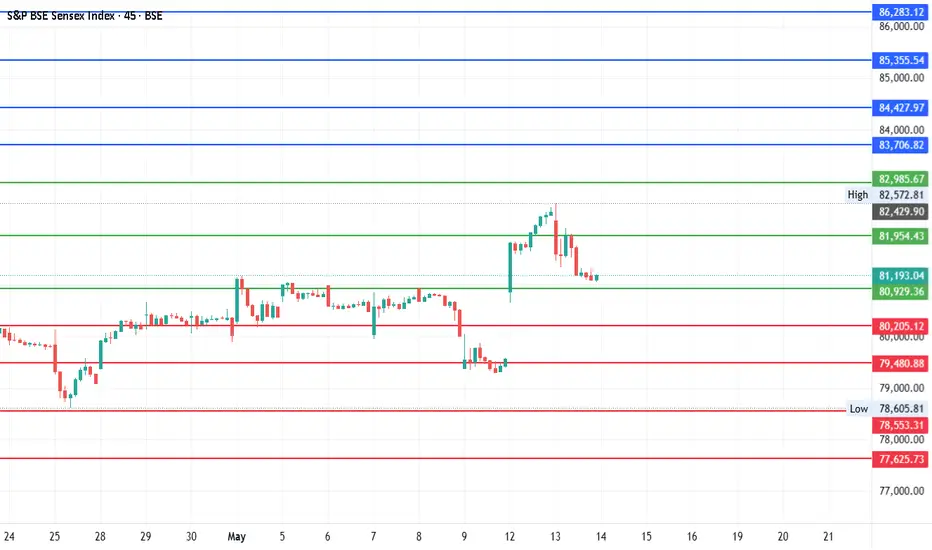
#SENSEX - Another 3500 Points Move?Date: 13-05-25
Current Price: 81148.22
Mid-Point: 81954.425
Upside Targets: 83706.82, 84427.97, 85355.54 and 86283.12
Downside Targets: 80205.12, 79480.89, 78553.31 and 77625.73
Resistance: 82985.67
Support: 80929.3598
#SENSEX