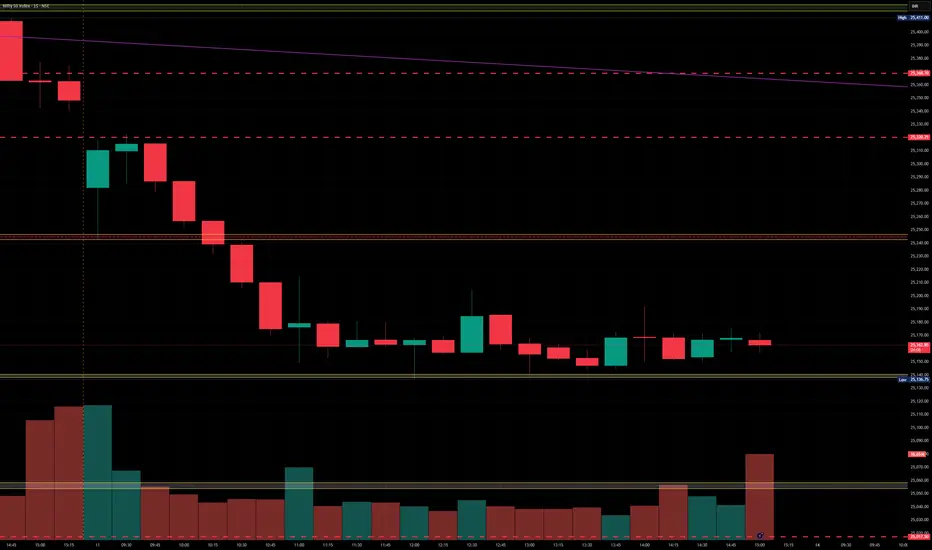
Nifty levels - Jul 14, 2025Nifty support and resistance levels are valuable tools for making informed trading decisions, specifically when combined with the analysis of 5-minute timeframe candlesticks and VWAP. By closely monitoring these levels and observing the price movements within this timeframe, traders can enhance the accuracy of their entry and exit points. It is important to bear in mind that support and resistance levels are not fixed, and they can change over time as market conditions evolve.
The dashed lines on the chart indicate the reaction levels, serving as additional points of significance to consider. Furthermore, take note of the response at the levels of the High, Low, and Close values from the day prior.
We hope you find this information beneficial in your trading endeavors.
* If you found the idea appealing, kindly tap the Boost icon located below the chart. We encourage you to share your thoughts and comments regarding it.
Wishing you success in your trading activities!
Market indices
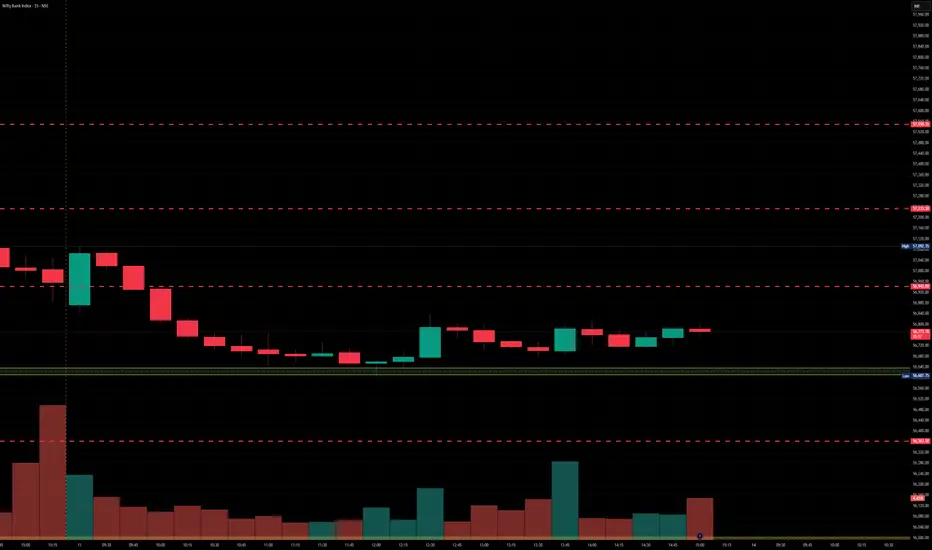
BankNifty levels - Jul 14, 2025Utilizing the support and resistance levels of BankNifty, along with the 5-minute timeframe candlesticks and VWAP, can enhance the precision of trade entries and exits on or near these levels. It is crucial to recognize that these levels are not static, and they undergo alterations as market dynamics evolve.
The dashed lines on the chart indicate the reaction levels, serving as additional points of significance. Furthermore, take note of the response at the levels of the High, Low, and Close values from the day prior.
We trust that this information proves valuable to you.
* If you found the idea appealing, kindly tap the Boost icon located below the chart. We encourage you to share your thoughts and comments regarding it.
Wishing you successful trading endeavors!
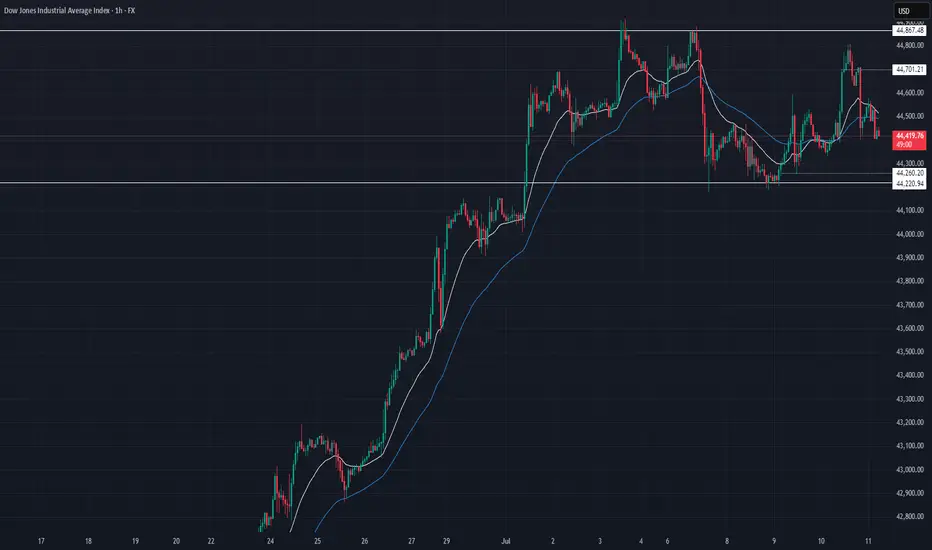
US30 Market Recap – 07/11/2025📍 US30 Market Recap – 07/11/2025
Another range-bound day on US30 as price continues to chop between key zones. Bulls pushed into 44,700, but failed to hold gains. We’re now sitting near the mid-range, and market indecision is growing 🤔
📊 Current Structure:
Range: 44,220 (support) ↔️ 44,867 (resistance)
Mid-range: 44,500 zone acting as key pivot
EMA structure still mixed: 20 EMA trying to cross back above 50 EMA
Lower highs building since last test of 44,867 = signs of seller presence
🔑 Key Levels:
🔼 Resistance: 44,701 → 44,867
🔽 Support: 44,260 → 44,220
⚠️ Mid-zone chop: 44,400–44,500 (avoid fomo entries here)
💡 Trade Setup Ideas:
🔻 Short Setup (If rejection holds below 44,500):
Entry: Rejection candle or break/retest under 44,400
TP1: 44,260
TP2: 44,100
SL: Above 44,600
🔼 Long Setup (Only above 44,700 reclaim):
Entry: Strong close + retest above 44,700
TP: 44,867 highs
SL: Below 44,500
🚫 NO-TRADE ZONE: 44,350–44,500 chop range = indecision zone ⚠️
Dollar I Daily CLS I Model 1 I KL OB I Target TRCandleYo Market Warriors ⚔️
It's risky, re-entry, but scared money makes no money.
if you’ve been riding with me, you already know:
🎯My system is 100% mechanical. No emotions. No trend lines. No subjective guessing. Just precision, structure, and sniper entries.
🧠 What’s CLS?
It’s the real smart money. The invisible hand behind $7T/day — banks, algos, central players.
📍Model 1:
HTF bias based on the daily and weekly candles closes,
Wait for CLS candle to be created and manipulated. Switch to correct LTF and spot CIOD. Enter and target 50% of the CLS candle.
For high probability include Dealing Ranges, Weekly Profiles and CLS Timing.
Trading is like a sport. If you consistently practice you can learn it.
“Adapt what is useful. Reject whats useless and add whats is specifically yours.”
David Perk aka Dave FX Hunter
💬 Don't hesitate to ask any questions or share your opinions

Levels for Nifty - 11 July 20251. Long once 25415 - 25440 is broken for target of 25541 and second target of 25610.
2. Short only after the support zone of 25336 - 25291 is broken for target of 25165 and second target of 25000.
3. No trading zone with be todays range of 25340-25410
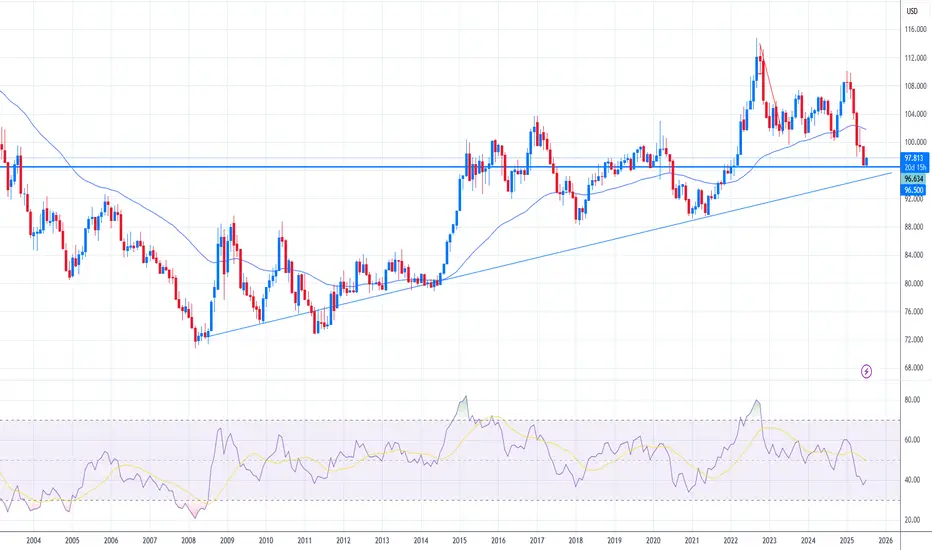
DXY Tests Key Support – What’s Next for the Dollar?
The U.S. Dollar Index (DXY), which tracks the dollar’s performance against a basket of major currencies, recently broke below its 50-month moving average based on the monthly chart —a significant technical signal. After this drop, the index is now bouncing off a key support zone near 96.50.
This area has acted as a pivot point in past cycles, and a sustained bounce could indicate the dollar regaining strength. If risk sentiment fades—due to weaker equity markets, geopolitical tensions, or stronger U.S. data—the dollar might find new momentum.
On the flip side, failure to hold 96.50 could open the door toward the 90.00 zone, a major long-term support level. Such a move would likely reflect expectations of looser U.S. monetary policy or further deterioration in economic confidence.
For now, price action near 96.50 will be decisive. A rebound could shift sentiment back in favor of the dollar, while a deeper decline may trigger broader adjustments in FX markets. Traders should closely monitor upcoming macro data and risk sentiment for cues on the next leg.
If we close above last week low, this may prove a good entry This channel is not providing individualized trading or investment advice, nor is it a banking service, brokerage service, trading service, investment service or money management service

One last squeeze and NAS100 could explode into the next rallyThe NAS100 is currently coiling within a tight consolidation range, showing signs of tension building up. After a strong push upward, price has been moving sideways in a narrowing structure. This build-up around the high, a compression of buyers and sellers in a low-volatility squeeze could be an indication that we could use. This kind of price action typically signals that buyers are gaining control, squeezing out sellers with each dip.
The lack of deep pullbacks combined with increasingly shallow sell-offs shows fading bearish momentum. Which is often typical during a buildup phase before a breakout. If buyers can push price above with a strong close, it could trigger breakout momentum and lead to a continuation of the larger bullish trend.
Ideally, if price reacts positively and forms bullish confirmation, it would set up a solid continuation entry, with upside potential toward the next target of 23.400.
Until then, bulls are watching closely for signs of commitment. The breakout is yet to be confirmed, but the squeeze is on, and the pressure is building.
What will happen next?
Just sharing my thoughts for the charts, this isn’t financial advice. Always confirm your setups and manage your risk properly.
Disclosure: I am part of Trade Nation's Influencer program and receive a monthly fee for using their TradingView charts in my analysis.

Nasdaq-100 H4 | Swing-low support at 23.6% Fibonacci retracementThe Nasdaq-100 (NAS100) is falling towards a swing-low support and could potentially bounce off this level to climb higher.
Buy entry is at 22,509.40 which is a swing-low support that aligns closely with the 23.6% Fibonacci retracement.
Stop loss is at 22,250.00 which is a level that lies underneath a pullback support and the 38.2% Fibonacci retracement.
Take profit is at 22,921.84 which is a multi-swing-high resistance.
High Risk Investment Warning
Trading Forex/CFDs on margin carries a high level of risk and may not be suitable for all investors. Leverage can work against you.
Stratos Markets Limited (tradu.com ):
CFDs are complex instruments and come with a high risk of losing money rapidly due to leverage. 63% of retail investor accounts lose money when trading CFDs with this provider. You should consider whether you understand how CFDs work and whether you can afford to take the high risk of losing your money.
Stratos Europe Ltd (tradu.com ):
CFDs are complex instruments and come with a high risk of losing money rapidly due to leverage. 63% of retail investor accounts lose money when trading CFDs with this provider. You should consider whether you understand how CFDs work and whether you can afford to take the high risk of losing your money.
Stratos Global LLC (tradu.com ):
Losses can exceed deposits.
Please be advised that the information presented on TradingView is provided to Tradu (‘Company’, ‘we’) by a third-party provider (‘TFA Global Pte Ltd’). Please be reminded that you are solely responsible for the trading decisions on your account. There is a very high degree of risk involved in trading. Any information and/or content is intended entirely for research, educational and informational purposes only and does not constitute investment or consultation advice or investment strategy. The information is not tailored to the investment needs of any specific person and therefore does not involve a consideration of any of the investment objectives, financial situation or needs of any viewer that may receive it. Kindly also note that past performance is not a reliable indicator of future results. Actual results may differ materially from those anticipated in forward-looking or past performance statements. We assume no liability as to the accuracy or completeness of any of the information and/or content provided herein and the Company cannot be held responsible for any omission, mistake nor for any loss or damage including without limitation to any loss of profit which may arise from reliance on any information supplied by TFA Global Pte Ltd.
The speaker(s) is neither an employee, agent nor representative of Tradu and is therefore acting independently. The opinions given are their own, constitute general market commentary, and do not constitute the opinion or advice of Tradu or any form of personal or investment advice. Tradu neither endorses nor guarantees offerings of third-party speakers, nor is Tradu responsible for the content, veracity or opinions of third-party speakers, presenters or participants.

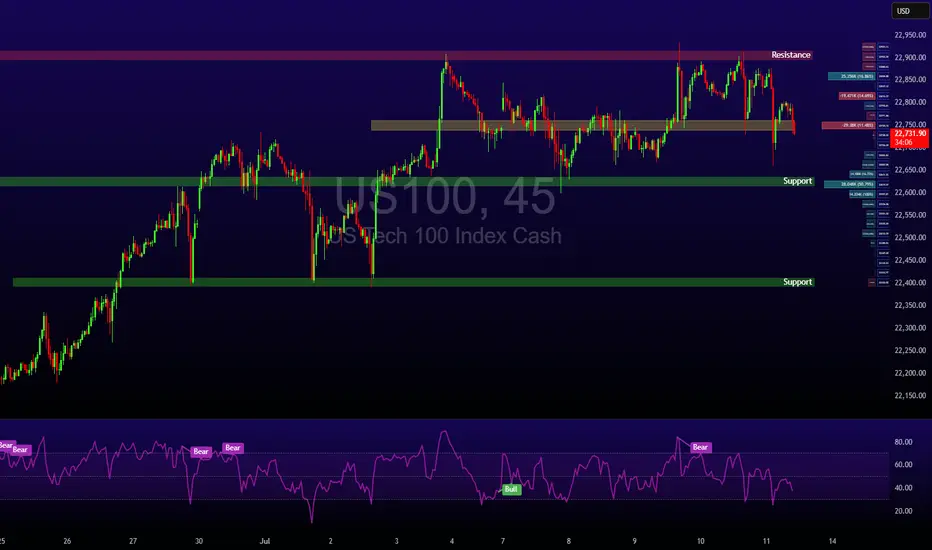
Nasdaq 100 Dips as Tariffs Spark CautionWhile crypto markets rally, U.S. equities have cooled. The Nasdaq 100 dropped by 0.6% following the announcement of new tariffs, particularly those aimed at Canadian goods. Tech stocks are reacting cautiously to these developments, although Nvidia’s record-breaking $4 trillion market cap continues to provide some support for the index.
With major financials such as JPMorgan and Wells Fargo reporting Q2 earnings next week, investors will soon get clarity on how corporate America is coping with higher input costs and global trade tensions.
Technical View (Nasdaq 100):
The index is consolidating between resistance at 22,900 and support at 22,600. A break above 22,900 could reignite the tech rally, while a drop below support may see price test 22,400 and potentially 22,000 in coming sessions.
DXY Jul. 11The information and publications are not meant to be, and do not constitute, financial, investment, trading, or other types of advice or recommendations.
Have a nice day ahead.

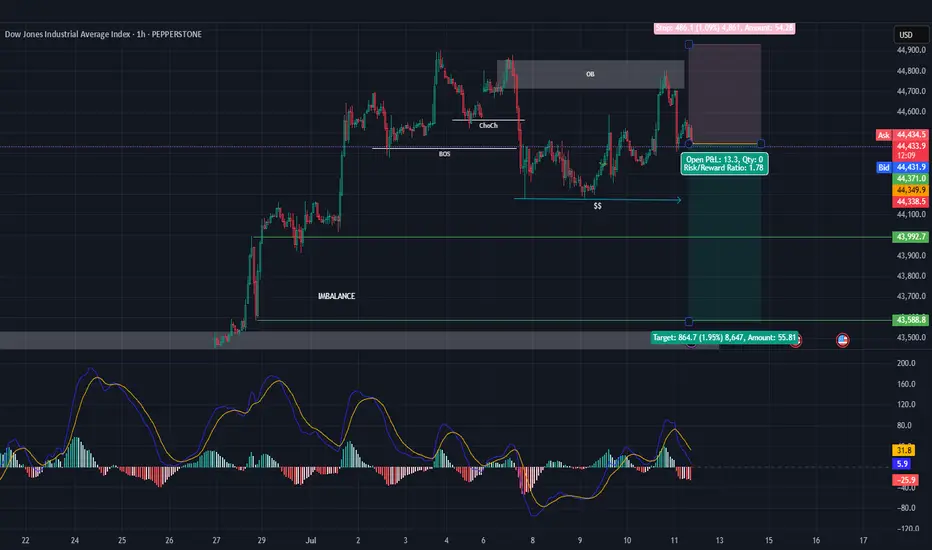
US30 - Short SellThe Dow Jones aka US30
* Overall trend is bullish
* Currently trading the retracement with the following points.
1. Valid OB
2. Liquidity to the sell side
3. Imbalance to the sell side
4. Price failed to break the previous HH activating the Bear positions, the question is How Deep The Retracement Will Be ? So we are closely monitoring the price action to adjust at any changes that the market might face.
Bold analysis for the most powerful currency in the world (DXY)Orange range: entering in several steps .
Green area: important support and exit point .
Important note: The gray line is the liquidity range
Watch the dance around this line carefully (bank positions are settled around this line)
And in my opinion, by increasing the price, they are emptying it on the buyers, so buy cautiously, but sell boldly.
GL

NAS100 - Follow Progress 2Dear Friends in Trading,
How I see it,
I have summarized the progress and indicated all key levels
Keynotes:
1) I am starting to see strong quality red candles.
2) 22867 is a VERY strong Internal resistance level at this time.
3) 22725 is a VERY strong Internal support level at this time.
I'll keep you posted...please ask if anything is unclear.
I sincerely hope my point of view offers a valued insight.
Thank you for taking the time to study my analysis.

US30 - medium to long term opportunity setting upHello,
The US30 futures are forming a bullish pattern, signaling potential upside. The MACD and moving averages align, presenting a compelling opportunity for buyers.
Investors should note President Trump's aggressive push for Federal Reserve Chair Powell to cut interest rates, including threats to dismiss him if he resists. While this rhetoric could unsettle markets, we believe Trump is unlikely to follow through, as markets have likely found a bottom and he would avoid actions that could trigger a downturn.
Technical analysis supports early entry for bold investors, with a stop-loss placed below the recent low. Proceed with caution and good luck.
Disclosure: I am part of Trade Nation's Influencer program and receive a monthly fee for using their TradingView charts in my analysis.

NAS100 (Cash100) Double Top H8Potential short on NAS100.
Risk/reward = 5.4.
Entry = 22 956
Stop loss = 23 059
TP level 1 = 22 473 (50% of position)
T level 2 = 22 303 (50% of position)
RSI divergence.
Waiting for closure of current H8 candle to close in range.
Looking for lower volume on H8 closure, however, will make exception id higher since top 1 was on Thursday the 3rd and markets closed early.


Falling towards 50% Fibonacci support?DAX40 (DE40) is falling towards the pivot and could bounce to the pullback resistance.
Pivot: 24,122.25
1st Support: 23,935.80
1st Resistance: 24,622.91
Risk Warning:
Trading Forex and CFDs carries a high level of risk to your capital and you should only trade with money you can afford to lose. Trading Forex and CFDs may not be suitable for all investors, so please ensure that you fully understand the risks involved and seek independent advice if necessary.
Disclaimer:
The above opinions given constitute general market commentary, and do not constitute the opinion or advice of IC Markets or any form of personal or investment advice.
Any opinions, news, research, analyses, prices, other information, or links to third-party sites contained on this website are provided on an "as-is" basis, are intended only to be informative, is not an advice nor a recommendation, nor research, or a record of our trading prices, or an offer of, or solicitation for a transaction in any financial instrument and thus should not be treated as such. The information provided does not involve any specific investment objectives, financial situation and needs of any specific person who may receive it. Please be aware, that past performance is not a reliable indicator of future performance and/or results. Past Performance or Forward-looking scenarios based upon the reasonable beliefs of the third-party provider are not a guarantee of future performance. Actual results may differ materially from those anticipated in forward-looking or past performance statements. IC Markets makes no representation or warranty and assumes no liability as to the accuracy or completeness of the information provided, nor any loss arising from any investment based on a recommendation, forecast or any information supplied by any third-party.

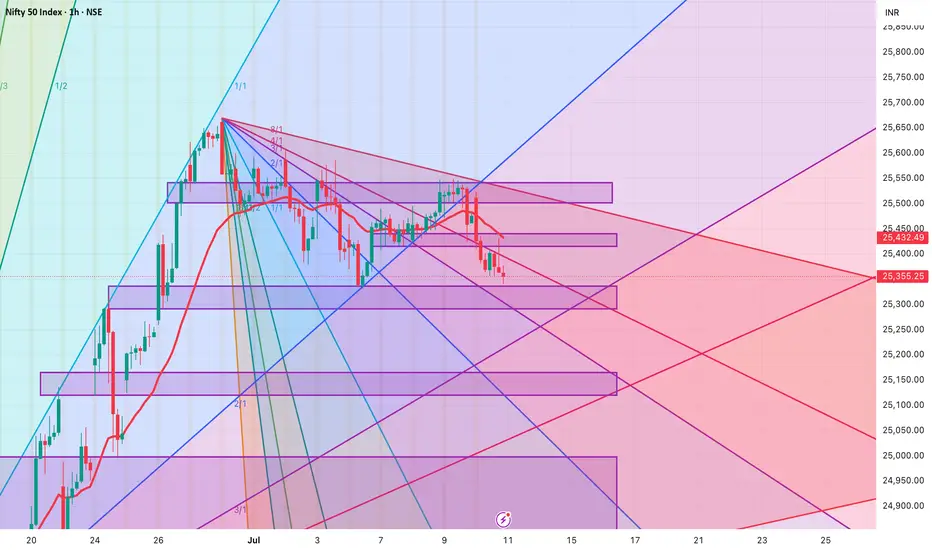
NIFTY 1. Rectangle Box (Sideways Zone)
Nifty had earlier made a strong range-bound consolidation around 24,400 -25,000.
This has now become a strong support zone (red shaded area).
2. Breakout & Retest Pattern:
Nifty then broke out of this zone and went to around 25,600.
Now it is retesting the same old resistance (now support).
3. Price Action Zones:
Support Zone: 24,950 25,100
Resistance Zone: 25,600 - 25,800
If you find this helpful and want more FREE forecasts in TradingView, Hit the 'BOOST' button
Drop some feedback in the comments below! (e.g., What did you find most useful?
How can we improve?)
Your support is appreciated!
Now, it's your turn!
Be sure to leave a comment; let us know how you see this opportunity and forecast.
Have a successful week
DISCLAIMER: I am NOT a SEBI registered advisor or a financial adviser. All the views are for educational purpose only

#BankNifty directions and levels for July 11th:if the decline takes consolidation or breaks the 78% with solid candle then the correction will likely continue.
on the other hand if the market finds support around the 78% we can expect range market with in the previous day range.
