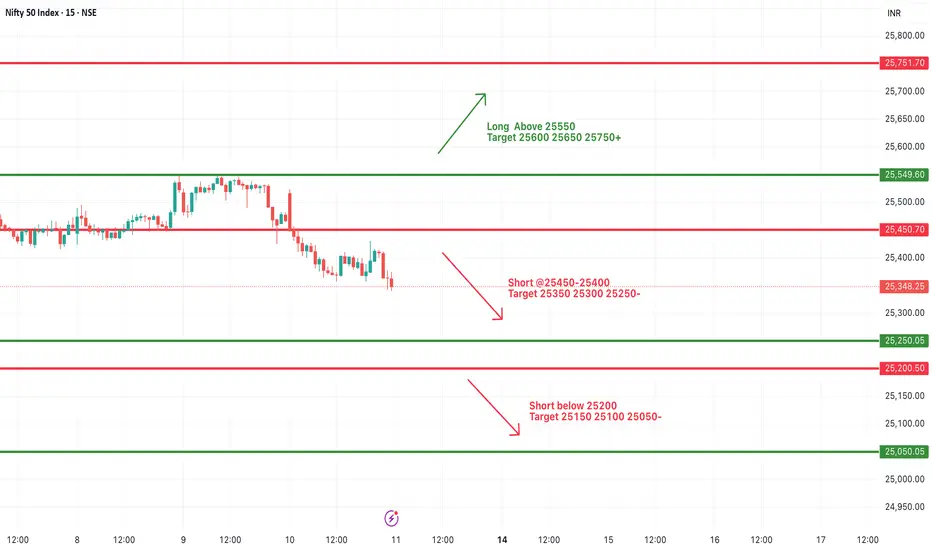
#NIFTY Intraday Support and Resistance Levels - 11/07/2025Nifty is likely to open on a flat note today, continuing the weakness seen in the recent sessions. The index has shown a consistent downward move after facing resistance near the 25550 zone. If Nifty sustains below the 25450–25400 range, it may trigger further bearish momentum with immediate targets at 25350, 25300, and 25250. Breaching 25200 could lead to further downside toward 25150, 25100, and 25050 levels.
On the other hand, any sharp reversal and breakout above 25550 may revive bullish sentiment. Sustaining above this level can push the index toward 25600, 25650, and 25750+. However, upside movement will require strong buying interest and volume support.
Overall, the broader trend remains weak unless a clear breakout occurs. Traders are advised to trade with caution, wait for directional confirmation, and use strict stop-loss to manage risks in this volatile environment.
Market indices
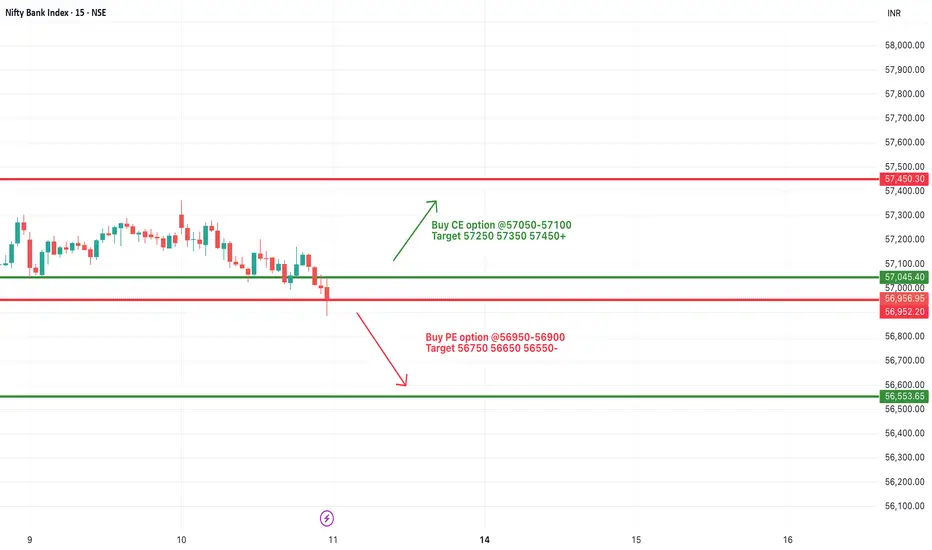
[INTRADAY] #BANKNIFTY PE & CE Levels(11/07/2025)Bank Nifty is expected to open flat today after a prolonged consolidation and a narrow trading range observed in the previous sessions. The index is hovering near the support zone of 56900–57000, which has acted as a critical level in recent price action.
If Bank Nifty sustains above 57050–57100, we may witness a rebound towards 57250, 57350, and 57450+. However, a decisive breach below the 56900 level can trigger a sharp fall, with immediate downside targets at 56750, 56650, and 56550-.
Since the index is trading close to a major support zone, today's movement could decide the next directional trend. Until a breakout or breakdown is confirmed, expect range-bound moves with limited momentum.
US30 H4 I Bearish Reversal Based on the H4 chart, the price is approaching our sell entry level at 44576.41, a pullback resistance.
Our take profit is set at 44162.08, an overlap support.
The stop loss is set at 44922.32, a swing high resistance.
High Risk Investment Warning
Trading Forex/CFDs on margin carries a high level of risk and may not be suitable for all investors. Leverage can work against you.
Stratos Markets Limited (tradu.com ):
CFDs are complex instruments and come with a high risk of losing money rapidly due to leverage. 63% of retail investor accounts lose money when trading CFDs with this provider. You should consider whether you understand how CFDs work and whether you can afford to take the high risk of losing your money.
Stratos Europe Ltd (tradu.com ):
CFDs are complex instruments and come with a high risk of losing money rapidly due to leverage. 63% of retail investor accounts lose money when trading CFDs with this provider. You should consider whether you understand how CFDs work and whether you can afford to take the high risk of losing your money.
Stratos Global LLC (tradu.com ):
Losses can exceed deposits.
Please be advised that the information presented on TradingView is provided to Tradu (‘Company’, ‘we’) by a third-party provider (‘TFA Global Pte Ltd’). Please be reminded that you are solely responsible for the trading decisions on your account. There is a very high degree of risk involved in trading. Any information and/or content is intended entirely for research, educational and informational purposes only and does not constitute investment or consultation advice or investment strategy. The information is not tailored to the investment needs of any specific person and therefore does not involve a consideration of any of the investment objectives, financial situation or needs of any viewer that may receive it. Kindly also note that past performance is not a reliable indicator of future results. Actual results may differ materially from those anticipated in forward-looking or past performance statements. We assume no liability as to the accuracy or completeness of any of the information and/or content provided herein and the Company cannot be held responsible for any omission, mistake nor for any loss or damage including without limitation to any loss of profit which may arise from reliance on any information supplied by TFA Global Pte Ltd.
The speaker(s) is neither an employee, agent nor representative of Tradu and is therefore acting independently. The opinions given are their own, constitute general market commentary, and do not constitute the opinion or advice of Tradu or any form of personal or investment advice. Tradu neither endorses nor guarantees offerings of third-party speakers, nor is Tradu responsible for the content, veracity or opinions of third-party speakers, presenters or participants.

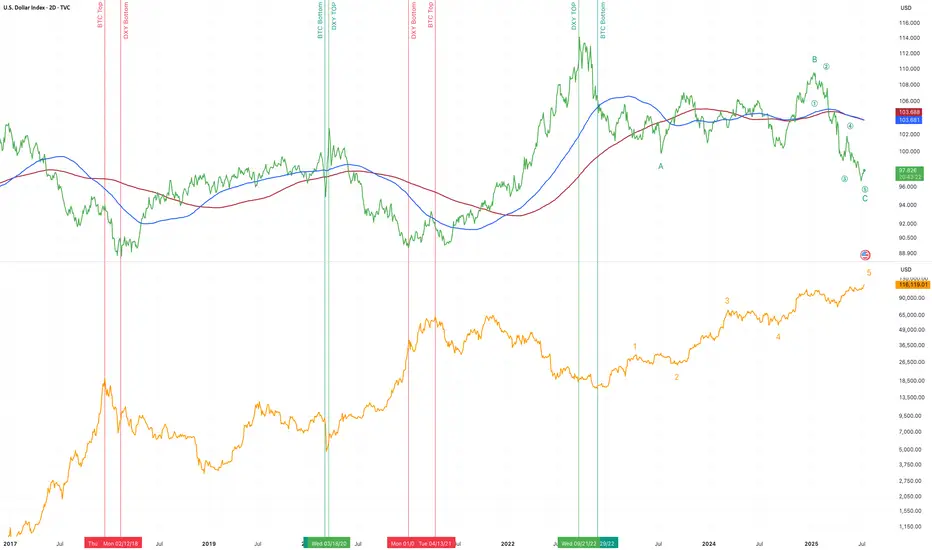
BTC vs DXYThe correlation between these two charts is striking. Now, both DXY and BTC have very completed patterns with BTC pretty high and DXY pretty low. Based on this chart it seems at least plausible that BTC should be topping in the next couple of months.
US interest rate reduction?!As you can see, the US dollar index has completed a 5-wave uptrend and after touching the top of the uptrend channel and breaking the uptrend line, it is currently in the second correction wave. I expect to see the beginning of the third correction wave soon. This may coincide with the reduction of the US interest rate in next week!!

Dollar Index AnalysisTwo possibilities for the dollar index has been shown here. We can see that dollar index is showing a short term uptrend. Which is clearly visible from the chart.
1: Dxy can maintain this short term uptrend. Because it is a monthly pullback. As it has been
for last 5 months.
2: Dxy can change character and again touches to the monthly demand zone as shown in my
previous video.

Dollar Index Analysis [DXY]Market has show upper wicks for last 3 days which is the sign that there is still sell pressure. The daily candles for this week are range bound. 4H chart is showing short term uptrend which is maintaining higher highs and higher lows. We can use this range to have scalps in this range.

FTSE 100 Wave Analysis – 10 July 2025
- FTSE 100 broke key resistance level 8900.00
- Likely to rise to resistance level 9100.00
FTSE 100 index recently broke above the key resistance level 8900.00 (which has been reversing the price from March, as can be seen below).
The breakout of the resistance level 8900.00 continues the active short-term impulse wave 3 of the intermediate impulse wave (3) from the end of June.
Given the clear daily uptrend, FTSE 100 index can be expected to rise to the next resistance level 9100.00 (target for the completion of the active impulse wave 3).

US30 Local Short!
HI,Traders !
US30 index is moving in a sideways
movement Over the medium term down
Again and will soon hit
A horizontal support
Of 44482.4 from where
We will be expecting a
Local bullish rebound !
Comment and subscribe to help us grow !

Us30 h4 next move Rejection near BoS
2. Break below support zone
3. Lower high formation
4. Bearish continuation towards 43,250

Dow Jones Extends Rally Toward New HighsOver the past two trading sessions, the Dow Jones Industrial Average has gained nearly 1%, approaching the all-time high zone near 45,000 points. For now, the bullish bias remains intact, supported by the Federal Reserve’s announcement that a rate cut may occur later this year, despite renewed concerns over a potential reignition of trade war tensions. If buying pressure holds in the short term, this could fuel further upward momentum, potentially pushing the index to new record levels.
Consistent Uptrend
The recent bullish swings have sustained a steady level of investor confidence, allowing the upward trend to remain unbroken. So far, there hasn’t been any significant selling correction strong enough to break the structure, meaning the dominant long-term uptrend remains intact. This continues to be the most important technical pattern to monitor, although the index is once again testing previous highs, where short-term selling corrections may emerge.
Technical Indicators
RSI: The RSI line is hovering near the overbought level around 70, suggesting that buying momentum has created an imbalance in market forces. This may open the door to a potential technical pullback as the index approaches historical highs.
ADX: The ADX line continues to rise above the neutral 20 level, maintaining a steady upward slope in recent sessions. If this trend continues, it could indicate increasing strength behind the current uptrend, especially if key resistance levels are broken.
Key Levels:
44,970 – Major Resistance: This level marks the all-time high and serves as the most important short-term resistance. A breakout above it could strengthen the bullish bias, open the door to new record highs, and further confirm the ongoing uptrend.
43,863 – Intermediate Support: A technical indecision zone seen in late February. A drop below this level may trigger a period of short-term neutrality or sideways movement.
42,756 – Critical Support: This zone aligns with the 50- and 200-period moving averages, making it a key technical area. A break below this level may signal the end of the current bullish trend and initiate a deeper correction.
Written by Julian Pineda, CFA – Market Analyst

S&P 500 - Sell in May, return anther day. The truth - 2025No doubt everyone has heard a variation of the phrase:
“Sell in May, return another day.”
In Wikipedia it is written:
“Sell in May and go away is an investment strategy for stocks based on a theory (sometimes known as the Halloween indicator) that the period from November to April inclusive has significantly stronger stock market growth on average than the other months. In such strategies, stock holdings are sold or minimised at about the start of May and the proceeds held in cash”
A public comment from last year:
“Over 100 years ago, the (practical) reason to sell in May and September, was to pay seasonal workers to seed the field (May) and to harvest (September). Caravans of landlords and farm owners went to New York to sell stocks and withdrew money from the banks to do payrolls
so for people without agricultural business, i'll say it's okay to hold in May”
If we are to take all this at face value then we should be unwinding our long term positions until the Autumn?
What does the chart say?
On the above monthly chart of the S&P 500 each vertical line marks the month of May going back to 2012. That is a dataset of 13 points.
The facts:
1) From the month of May onwards, 11 from 13 periods returned positive price action of not less than 10%. Selling in May was a bad choice.
2) 2015 and 2022 saw corrections of 15% from May onwards. However in both examples the correction was erased within 12 months as the index continued the uptrend.
In summary, 86% of the time a minimum return of 10% was seen before the year end. Amazing odds.
Furthermore, corrections up and until the end of April (like we’re now seeing) represented some of the best long opportunities.
Sell in May go away? I suggest it should be: Buy in June and watch it boom!
Ww

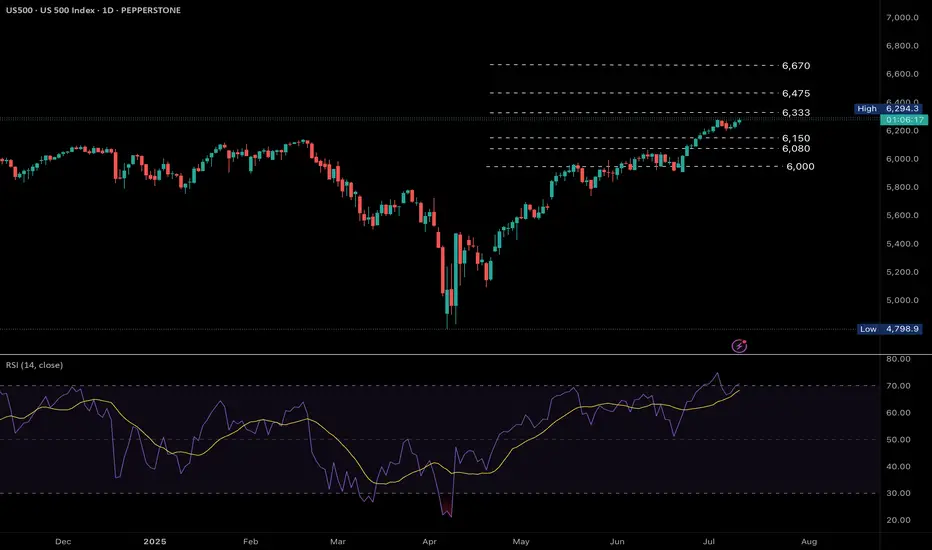
US500 trending higher as the US earnings season gains momentum. Fundamental
US500 is pushing higher as the US 2nd quarter earnings season gains momentum under President Trump's second administration amidst tariffs. Big tech earnings will have a significant impact on the index price action.
Technical
Bullish momentum is gaining as the uptrend remains strong. The RSI is approaching the overbought region however a break above the 6,333 key resistance level sees the index trading at all time highs with resistance levels at 6,475 and 6,670. A move below 6,230 sees a possible move towards supports at 6,150, 6,080 and subsequently 6,000.
by Terence Hove, Senior Financial Markets Strategist at Exness
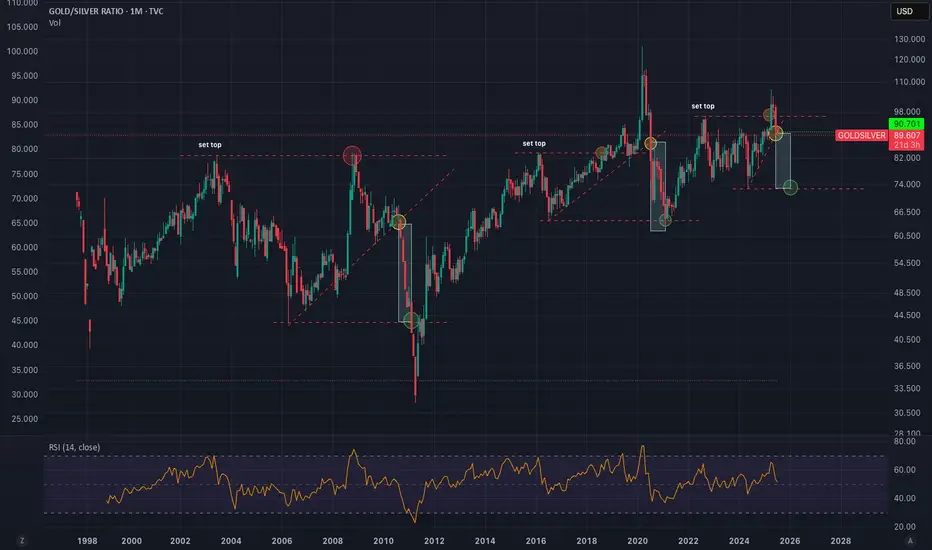
Gold/Silver Ratio to 72 Minimum - Imminent Silver BreakoutGoldSilver Ratio is following a clear pattern of behavior. We can expect a return to mean conservatively hitting 72 at a minimum. This puts silver at $46-58 if Gold doesn't move higher. I think we will see silver 5-10X over the next few years. Easy 25-50% in the short term (6-12 months).
Nasdaq 100 Index 2-Hour Chart Analysis2-hour candlestick chart for the Nasdaq 100 Index (NDX) on the NASDAQ exchange. The chart spans from May to August, showcasing a significant upward trend with notable fluctuations. Key indicators include a recent price of 22,861.53, representing a 0.72% increase. The chart features technical analysis elements such as support and resistance levels, highlighted by green and red boxes, and a downward arrow suggesting a potential price movement.

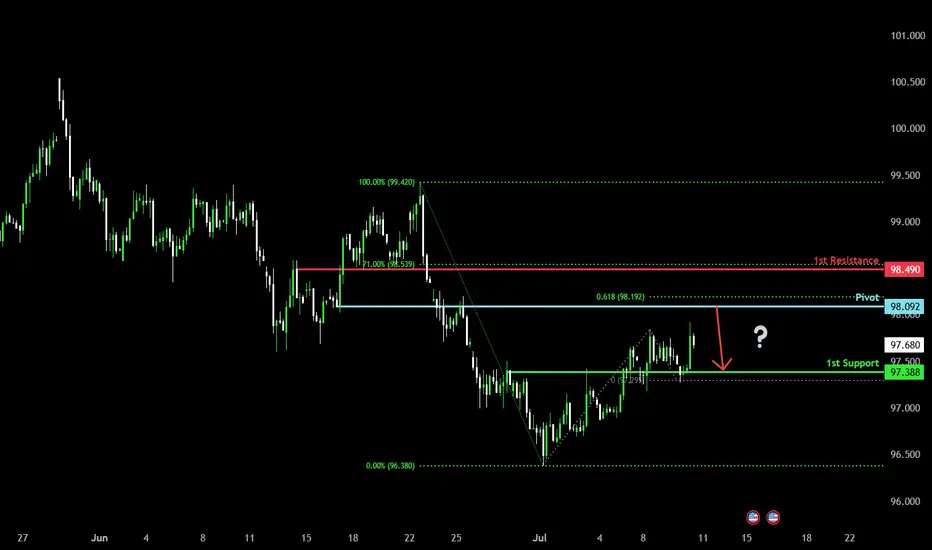
Could the price reverse from here?US Dollar Index (DXY) is rising towards the pivot and could reverse to the 1st support which acts as an overlap support.
Pivot: 98.09
1st Support: 97.38
1st Resistance: 98.49
Risk Warning:
Trading Forex and CFDs carries a high level of risk to your capital and you should only trade with money you can afford to lose. Trading Forex and CFDs may not be suitable for all investors, so please ensure that you fully understand the risks involved and seek independent advice if necessary.
Disclaimer:
The above opinions given constitute general market commentary, and do not constitute the opinion or advice of IC Markets or any form of personal or investment advice.
Any opinions, news, research, analyses, prices, other information, or links to third-party sites contained on this website are provided on an "as-is" basis, are intended only to be informative, is not an advice nor a recommendation, nor research, or a record of our trading prices, or an offer of, or solicitation for a transaction in any financial instrument and thus should not be treated as such. The information provided does not involve any specific investment objectives, financial situation and needs of any specific person who may receive it. Please be aware, that past performance is not a reliable indicator of future performance and/or results. Past Performance or Forward-looking scenarios based upon the reasonable beliefs of the third-party provider are not a guarantee of future performance. Actual results may differ materially from those anticipated in forward-looking or past performance statements. IC Markets makes no representation or warranty and assumes no liability as to the accuracy or completeness of the information provided, nor any loss arising from any investment based on a recommendation, forecast or any information supplied by any third-party.
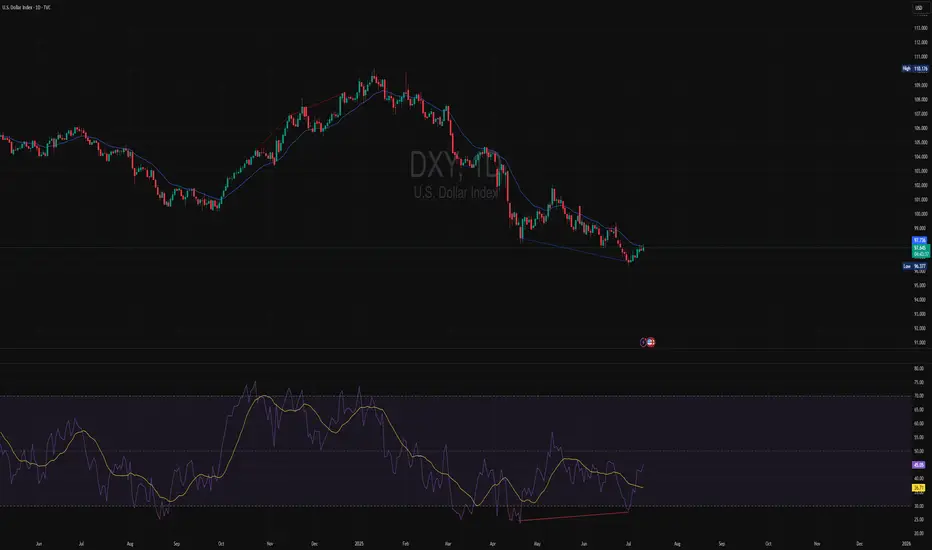
DXY-Technical Analysis DAILY Timeframe 📊 DXY – Technical Analysis (1D Timeframe)
🔷 Overall Trend:
The Dollar Index (DXY) has been in a strong downtrend for several months, forming multiple confirmed Breaks of Structure (BOS) to the downside.
However, recent price action is showing signs of momentum loss and potential exhaustion from sellers near the current lows.
🟡 Market Structure:
Price recently formed a lower low, but momentum indicators are showing bullish divergence — suggesting the downward pressure is weakening.
A small bullish reversal candle has printed, indicating potential short-term buying interest.
There is no confirmed bullish CHoCH yet, but structure is starting to slow down and compress — signaling a possible shift.
📉 Indicators (RSI ):
RSI is rebounding from oversold territory, showing potential early reversal signals.
The confirms bullish divergence and shows fading bearish momentum.
Overall, sellers are showing reduced strength, increasing the chance of a corrective move to the upside.
🔹 Key Levels:
Immediate resistance zones:
🔹 97.23 and 97.73 — key levels to watch for bullish continuation.
Major support:
🔻 96.34 – 96.50 — current low area that if broken, will confirm further downside.
✅ Conclusion:
While DXY remains structurally bearish, the recent bullish divergence, loss of selling momentum, and RSI recovery suggest the potential for a short-term correction or bounce.
A confirmed CHoCH and break above 97.73 would signal a potential shift to bullish structure.
If price fails to break resistance and drops below 96.34, the bearish trend is likely to continue.
🟢 Scenario Table:
Scenario Trigger Implication
Bullish shift Break above 97.73 with CHoCH Potential trend reversal
Continuation bearish Break below 96.34 Downtrend continuation
Disclaimer: This analysis is for informational and educational purposes only. It does not constitute financial advice or a recommendation to buy or sell any asse
US30 Sell IdeaSelling in the 44815–44886 zone, targeting a drop to 44476.50 with a stop loss at 44927.50 to cap risk. This setup aims to catch a pullback from resistance after the recent upward move, expecting the price to retrace toward the lower support area. Trade with discipline and wait for bearish confirmation around the entry zone.

TECHNICAL ANALYSIS: KSE-100 | 10 JULY 2025TECHNICAL ANALYSIS: KSE-100 | 10 JULY 2025
As we have mentioned several times, the index is expected to mark only shallow pullbacks,
and this current pullback, which started two days ago, also ended today and didn't go below
the breakdown level that we had mentioned, which was 132,330. In fact, the index resumed
its uptrend and now is on its way to achieve immediate targets.
Target Prices:
Immediate TP: 136,300
TP3: 138,970
Final Target: 151,600 (readjusted and raised due to recent continuous upward moves)
Market Sentiment: The index is very much all in long.

SP500 Bullish Momentum Amid Trade DevelopmentsThe US stock index continues to trade higher as overall market sentiment remains bullish, driven by optimism despite Donald Trump's aggressive tariff stance and ongoing global trade negotiations.
Currently, the index is consolidating within a narrow range around 6260. A confirmed breakout from this zone is essential to determine the next directional move. then Upside Target will be :6,250 and 6,300
If you like this idea if you Have on Opinion about this analysis share in comments.

Nasdaq leads the rally and can move for 3-5 days moreWhile crude oil is declining, tech stocks are gaining momentum: Nasdaq had reached another all-time-high recently and that might not be over: according to statistical studies, it rarely reverses quickly above the upper Bollinger Bands line and the average swing duration is between 17 and 20 days (which gives us several days of potential continuation).
The earnings season fuels growth for many technological stocks, and the “sell America” narrative steps back, so we may see Nasdaq growing as shown in the chart below.
Don't forget - this is just the idea, always do your own reserch and never forget to manage your risk!

S&P 500 (SPX) – Gann & Market Timing Outlook!We're currently leaning towards a bullish melt-up scenario into August 2025, supported by both price structure and Gann time analysis.
🔹 Key Gann Time Clusters:
11th July 2025
14th July 2025
These dates may act as pivotal turning points. The ideal scenario for bulls would be a short-term pullback into the 15th–16th July window, which could then confirm the next major leg up.
📈 Price action is riding strongly above the 1/1 and 2/1 Gann angles – a clear sign of accumulation and strength. The setup aligns well with a continued rally targeting August 2025 as a significant cycle top before any serious correction unfolds.
🎯 Watch the coming days closely. If we get a healthy dip, it may be your best buy-the-dip opportunity ahead of a major move.

The W FormationThe question now is, with the W pattern forming with bold bullish price, that has broken a high we had as a target yesterday, tapped on the FVG already and now showing some positive candle stick communication, will we buy to continue breaking the highs, or relax and wait for more confirmation within the fvg range or even lower before going in?
