Nifty Analysis EOD – July 23, 2025 – Wednesday 🟢 Nifty Analysis EOD – July 23, 2025 – Wednesday 🔴
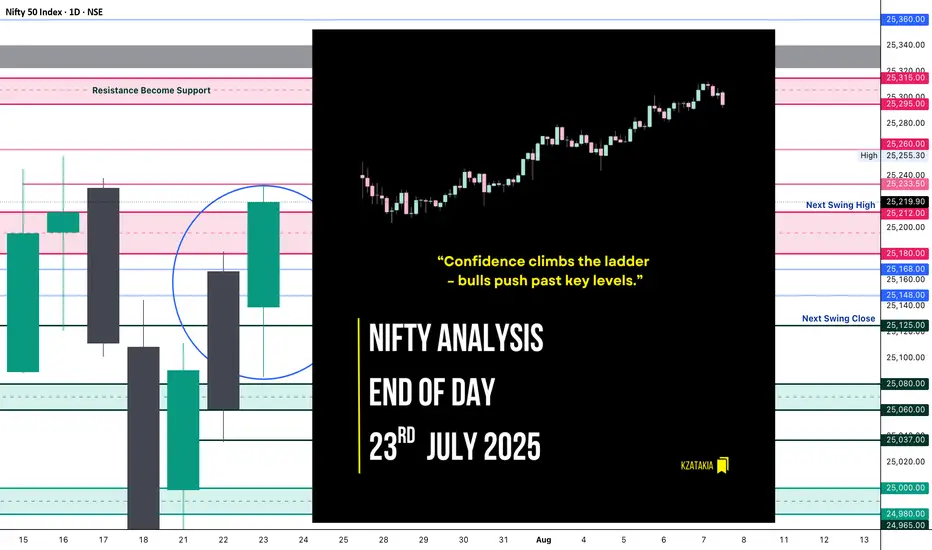
“Confidence climbs the ladder – bulls push past key levels.”
Nifty opened with a Gap Up of 78 points and initially retraced 54 points, finding solid footing around the CPR Zone. Once reclaimed VWAP, the index climbed in a methodical, low-volatility uptrend, breaking one resistance after another: CDH, R1, 25150, PDH, and the key zone 25200~25212 — finally touching the anticipated resistance at 25333, and closing just below that at 25219.90, close to the day’s high.
📌 Flashback from Yesterday's Note:
“If this is truly a retracement, 25K must hold in upcoming sessions, and bulls will need to reclaim 25,200 to regain their grip.”
👉 This expectation played out to perfection today — gradual yet confident bullish strength led Nifty to reclaim 25200 and close above it.
🔍 Today’s close of 25220 is higher than the last 7 sessions, suggesting a bullish shift in structure. However, bulls now face the real test — breaching the 25300 ~ 25350 resistance zone.
🕯 5 Min Time Frame Chart with Intraday Levels
🕯 Daily Time Frame Chart with Intraday Levels
🕯️ Daily Candle Breakdown
Open: 25,139.35
High: 25,233.50
Low: 25,085.50
Close: 25,219.90
Change: +159.00 (+0.63%)
Candle structure analysis:
Real body: Green body = 80.55 pts → strong bullish body
Upper wick: 13.60 pts → very small
Lower wick: 53.85 pts → moderate
Candle Interpretation:
The session opened stable, dipped to 25,085, but strong buyers showed up, helping price climb throughout the day and close near high. A firm green candle, signaling buyers in control.
Candle Type:
A Bullish Marubozu–like candle, not perfectly clean but represents strong continuation momentum.
Key Insight:
Close above 25200 confirms a bullish grip
If price holds above 25220–25250, next push could be towards 25280–25330
Immediate support now moves to 25,120–25,140
🛡 5 Min Intraday Chart
⚔️ Gladiator Strategy Update
ATR: 181.35
IB Range: 64.35 → Medium
Market Structure: Balanced
Trades Triggered:
⏱️ 10:45 AM – Long Entry → Trailing SL Hit (1:2.65 RR)
🔁 Support & Resistance Levels
Resistance Zones:
25,180 ~ 25,212
25,233
25,260
25,295 ~ 25,315
25,340 ~ 25,322 (Gap Zone)
Support Zones:
25,168
25,125
25,080 ~ 25,060
25,037
🧠 Final Thoughts
“Momentum is not magic—it’s built one level at a time.”
Bulls showed strength with control and consistency today. With 25200 reclaimed, they now hold the ball — next challenge lies at the gates of 25300–25350. Will they break through or pause for breath? Tomorrow holds the answer.
✏️ Disclaimer:
This is just my personal viewpoint. Always consult your financial advisor before taking any action.
Market indices
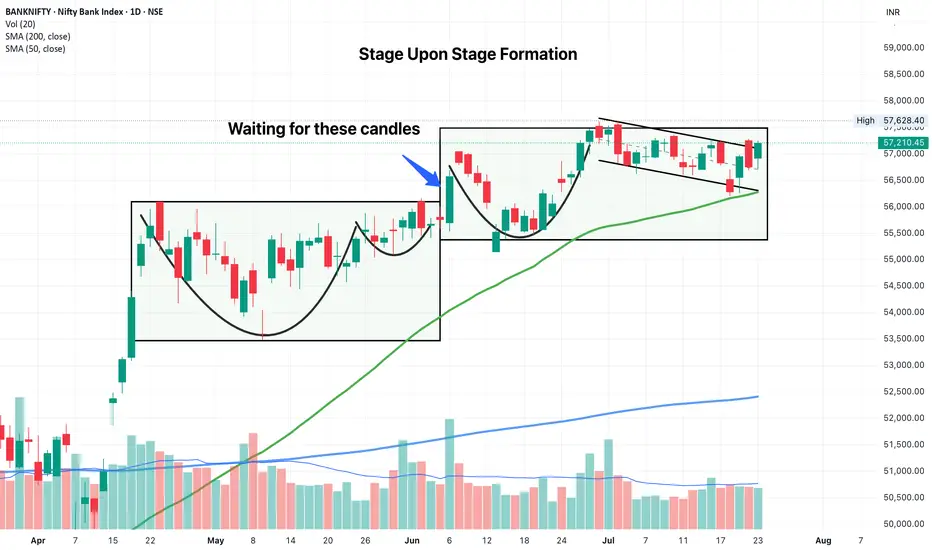
BankNifty Looks ready for a strong moveWe had an inside candle forming today. A small shakeout below today's low would be ideal, but we might move up in a straight line tomorrow if opening is strong.
You can play this with options if you like. But do buying and not selling. Max loss should be capped at 1% of your portfolio and reward should be taken at 2-3x the risk
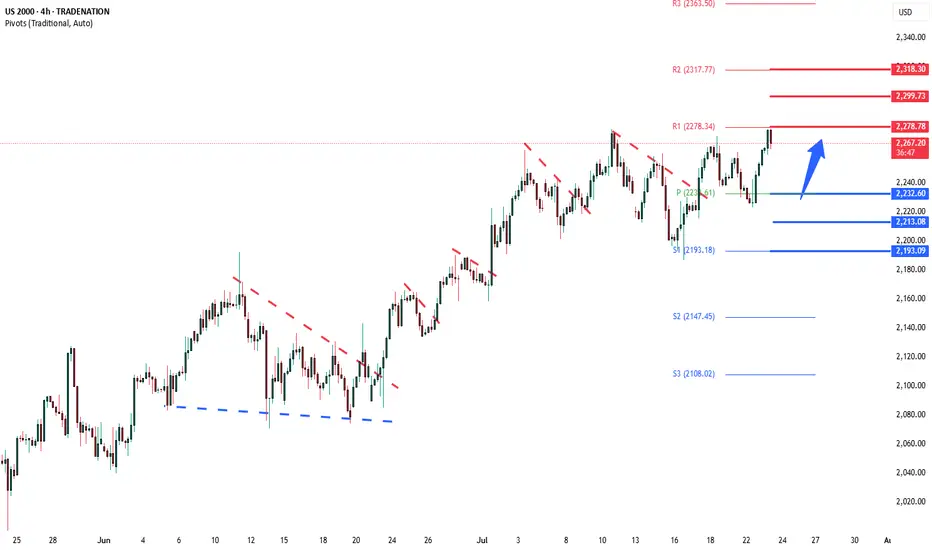
Russell2000 bullish continuation breakoutKey Support and Resistance Levels
Resistance Level 1: 2278.80
Resistance Level 2: 2299.70
Resistance Level 3: 2318.30
Support Level 1: 2232.60
Support Level 2: 2213.00
Support Level 3: 2193.00
This communication is for informational purposes only and should not be viewed as any form of recommendation as to a particular course of action or as investment advice. It is not intended as an offer or solicitation for the purchase or sale of any financial instrument or as an official confirmation of any transaction. Opinions, estimates and assumptions expressed herein are made as of the date of this communication and are subject to change without notice. This communication has been prepared based upon information, including market prices, data and other information, believed to be reliable; however, Trade Nation does not warrant its completeness or accuracy. All market prices and market data contained in or attached to this communication are indicative and subject to change without notice.
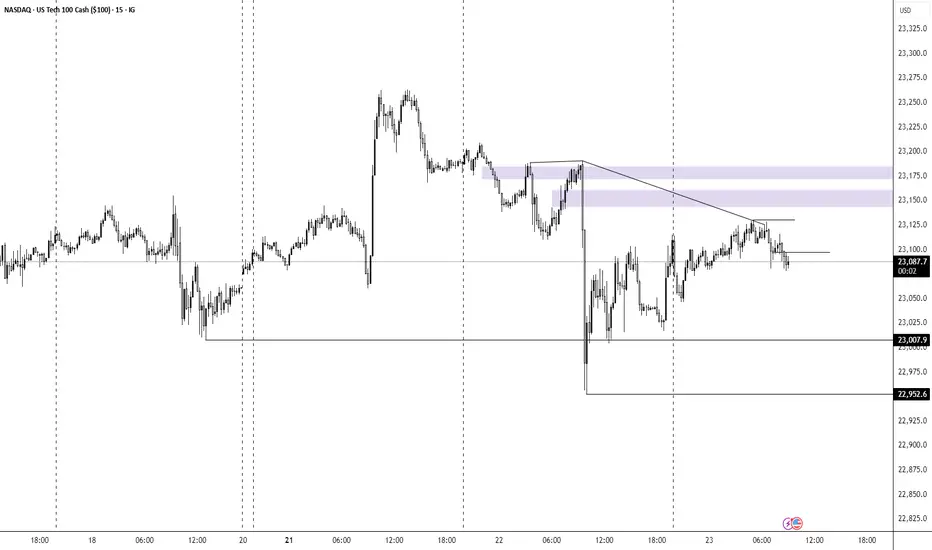
NSDQ100 another bullish flag developing ?Donald Trump has agreed a new trade deal with Japan, setting 15% tariffs on US imports like cars and launching a $550 billion fund to boost investment in the US. This is lower than his earlier 25% tariff threat. Other allies saw mixed outcomes—the Philippines got a small tariff cut, while Canada’s talks stalled. Goldman Sachs now expects the US baseline tariff rate to rise to 15%.
Trump also suggested that Fed Chair Jerome Powell may not stay in his role much longer, and he’s considering removing capital gains tax on home sales, which could affect the housing market.
Separately, a Chinese-linked cyberattack breached the US nuclear weapons agency, though no classified data was stolen. Meanwhile, SpaceX’s investor documents flagged Elon Musk’s political activity as a potential risk as the company targets a $400 billion valuation.
Conclusion for Nasdaq 100:
The Nasdaq 100 faces short-term uncertainty due to rising trade tariffs, Fed leadership questions, and geopolitical risks. While some US-focused investments could benefit, traders should stay cautious as policy and global tensions evolve.
Key Support and Resistance Levels
Resistance Level 1: 23265
Resistance Level 2: 23670
Resistance Level 3: 23480
Support Level 1: 22953
Support Level 2: 22840
Support Level 3: 22740
This communication is for informational purposes only and should not be viewed as any form of recommendation as to a particular course of action or as investment advice. It is not intended as an offer or solicitation for the purchase or sale of any financial instrument or as an official confirmation of any transaction. Opinions, estimates and assumptions expressed herein are made as of the date of this communication and are subject to change without notice. This communication has been prepared based upon information, including market prices, data and other information, believed to be reliable; however, Trade Nation does not warrant its completeness or accuracy. All market prices and market data contained in or attached to this communication are indicative and subject to change without notice.

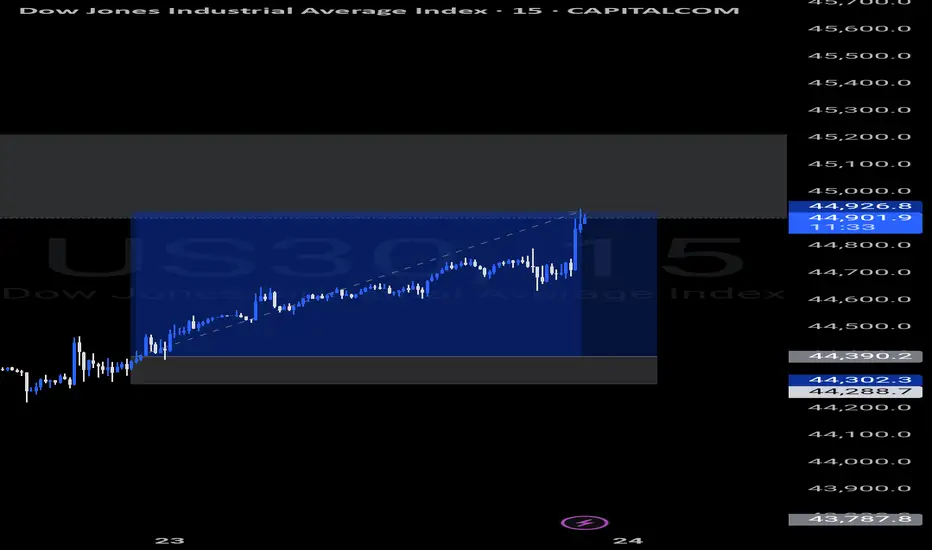
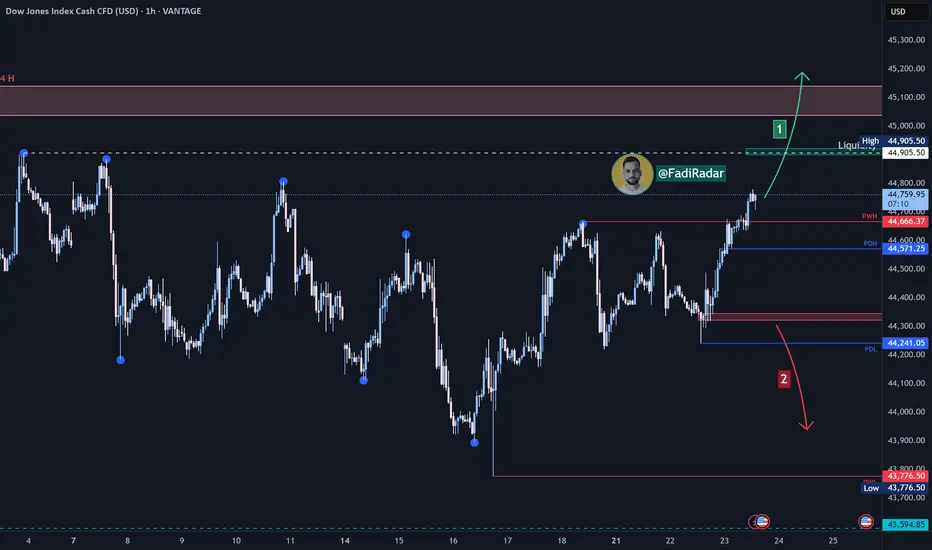
Dow Jones Index US30 Analysis:🔹 The index is approaching a key liquidity zone near 44,905 USD.
1️⃣ If price breaks and closes above 44,905, this could trigger a bullish continuation toward 45,100 USD.
2️⃣ However, if the price fails to break above and bearish momentum appears, a pullback is expected to test 44,570 and 44,320.
🔻 A confirmed break and close below 44,320 could resume the bearish trend and open the way toward 43,900 USD.
⚠️ Disclaimer:
This analysis is not financial advice. Please monitor the markets carefully before making any investment decisions.
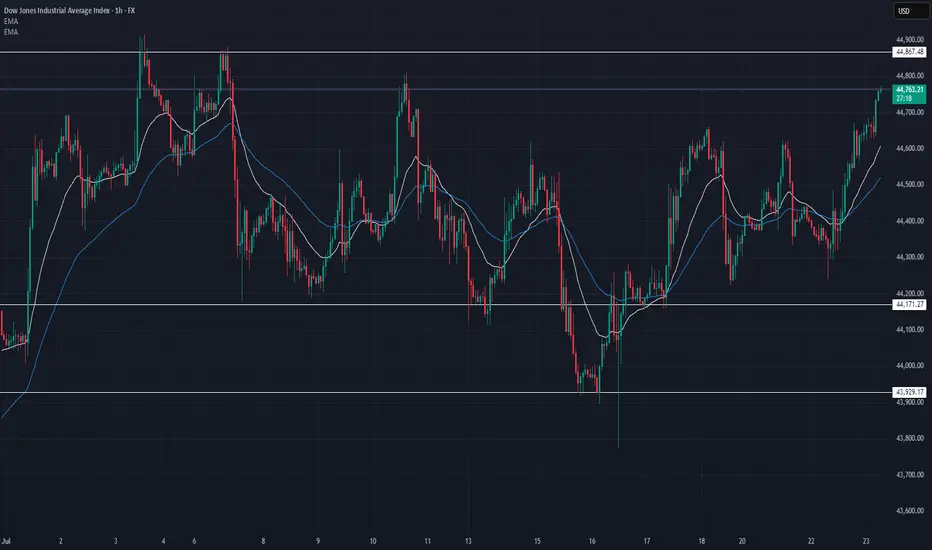
US30 Update – 07/23/2025📍 US30 Update – 07/23/2025
The bulls are back in control 🚀
After consolidating below 44,450, we finally saw a strong breakout above the mid-range and EMAs. Price surged straight into the 44,760–44,867 resistance zone with strength, riding the 9/21 EMA crossover 🟢
We're now testing a major supply zone, so momentum traders should watch for a reaction here.
📊 Market Structure:
✅ Clean higher lows
✅ Breakout above 44,600 resistance
✅ EMAs aligned bullish on 1H
✅ Bullish engulfing + follow-through
🔑 Key Levels:
🔼 Resistance: 44,764 → 44,867
🔽 Support: 44,450 → 44,171
🧠 Market Bias:
Short-term bullish ✅
➡️ Holding above 44,600 = bullish continuation
➡️ Rejection at 44,867 = possible pullback/retest
💡 Trade Scenarios:
📈 Breakout Continuation (Aggressive Long):
Entry: Above 44,780
TP1: 44,867
TP2: 44,950
SL: Below 44,700
Nifty trading in a rangeNifty Outlook:
Current Zone: Nifty has bounced from the 25,000 support and is now testing resistance at the 25,200–25,250 zone.
Immediate Resistance: 25,200–25,250 is a strong supply zone. A decisive breakout above this range is needed for further upside.
Upside Targets: If 25,250 is cleared, expect momentum toward 25,350 and 25,500.
Support Levels: 25,000 remains a strong support; below this, trend weakens with downside risk to 24,900.
Outlook: As long as Nifty holds 25,000, bias remains positive. Watch for a breakout above 25,250 to confirm fresh upside. Until then, expect range-bound action.

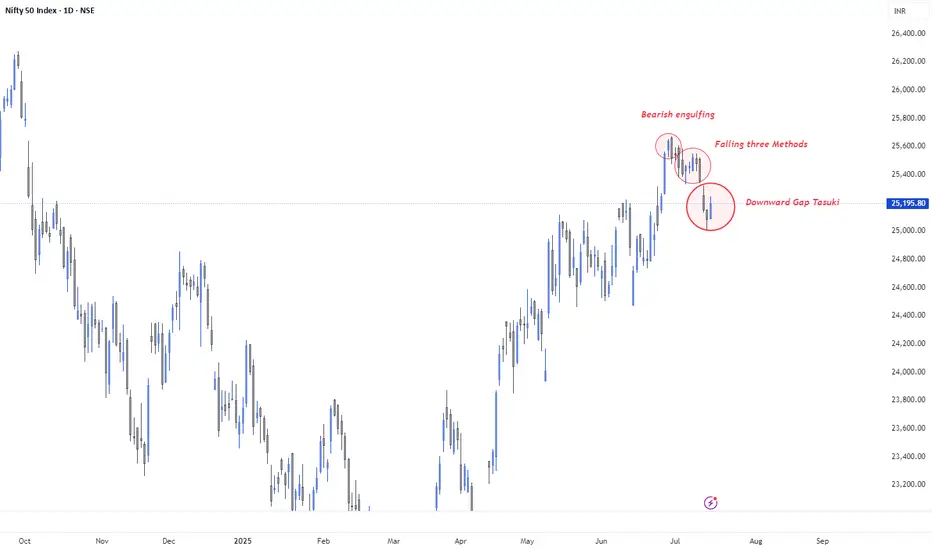
Candlestick Confluence: Bearish Signals in a Bullish Trend🔹 30 June – Bearish Engulfing
A large bearish candle fully engulfed the prior bullish day, forming at new highs (~25,790). Classic sign of distribution after an extended uptrend. This marked the beginning of the current corrective leg.
🔹 3 to 10 July – Falling Three Methods
After the initial drop, price consolidated in a tight range. Three small-bodied candles (4–9 July) signaled indecision. On 10 July, a strong bearish continuation candle confirmed the Falling Three Methods pattern — strengthening the downside move.
🔹 15 July – Downward Gap Tasuki
A bearish gap formed between 12–14 July. On 15 July, a small bullish candle emerged but failed to fill the gap — forming a Downward Gap Tasuki, a bearish continuation pattern. While this is typically a trend-continuation signal, it's forming within a primary uptrend, making follow-through uncertain.
🧠 Trend Context: Bullish Dominance Meets Short-Term Exhaustion
Despite these bearish candlestick formations, the broader trend from April remains structurally bullish. This confluence of reversal + continuation signals indicates:
Controlled profit-booking at highs
Low conviction from bulls near resistance
Possible mid-trend correction, not a trend reversal (yet)
🔎 Key Technical Levels to Watch
📉 Support Zones:
25,050: Immediate swing low (14 July)
24,850: Prior breakout zone
24,600: Horizontal support from mid-June
📈 Resistance Zones:
25,300 – 25,350: Gap resistance from 12–15 July
25,500: Key rejection zone from recent highs
25,650 – 25,700: All-time highs
⚠️ Market Psychology
Bulls are still in control on the higher timeframe, but the emergence of strong bearish patterns suggests hesitation at the top.
With Indian CPI easing and RBI’s neutral stance, macro still supports the bullish narrative — but the technical structure is flashing red flags in the short term.
🧾 Conclusion
"Nifty Spot has printed a sequence of reliable bearish candlestick formations — Bearish Engulfing (30 June), Falling Three Methods (3–10 July), and Downward Gap Tasuki (15 July). While these indicate short-term pressure, the broader uptrend remains intact. A close below 25,050 could trigger a deeper correction to 24,850–24,600. Bulls need to decisively reclaim 25,400+ to nullify the bearish setup and resume the uptrend."
#Nifty50
#NiftyAnalysis
#NiftyTechnicalAnalysis
#NSEIndia
#IndianStockMarket
#BearishEngulfing
#FallingThreeMethods
#TasukiGap
#CandlestickPatterns
#PriceAction
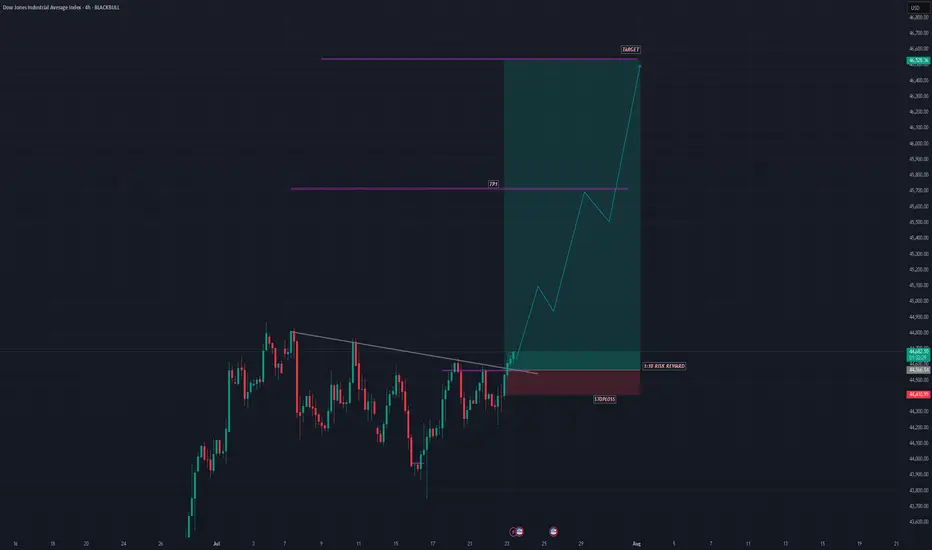
US30 SHOWING A GOOD UPWARD MOVE WITH 1:10 RISK REWARDUS30 SHOWING A GOOD UPWARD MOVE WITH 1:10 RISK REWARD
DUE TO THESE REASON
A. its following a rectangle pattern that stocked the market
which preventing the market to move any one direction now it trying to break the strong resistant lable
B. after the break of this rectangle it will boost the market potential for break
C. also its resisting from a strong neckline the neckline also got weeker ald the price is ready to break in the outer region
all of these reason are indicating the same thing its ready for breakout BREAKOUT trading are follows good risk reward
please dont use more than one percentage of your capital follow risk reward and tradeing rules
that will help you to to become a better trader
thank you
US30 BUYS!!!I see price creating a 4hr bullish structure to take price towards those equal highs because Equal Highs is a magnet for priice.

FTSE100 breakout zone now new support at 9030The FTSE remains in a bullish trend, with recent price action showing signs of a continuation breakout within the broader uptrend.
Support Zone: 9030 – a key level from previous consolidation. Price is currently testing or approaching this level.
A bullish rebound from 9030 would confirm ongoing upside momentum, with potential targets at:
9107 – initial resistance
9140 – psychological and structural level
9170 – extended resistance on the longer-term chart
Bearish Scenario:
A confirmed break and daily close below 9030 would weaken the bullish outlook and suggest deeper downside risk toward:
8980 – minor support
8920 – stronger support and potential demand zone
Outlook:
Bullish bias remains intact while the FTSE holds above 9030. A sustained break below this level could shift momentum to the downside in the short term.
This communication is for informational purposes only and should not be viewed as any form of recommendation as to a particular course of action or as investment advice. It is not intended as an offer or solicitation for the purchase or sale of any financial instrument or as an official confirmation of any transaction. Opinions, estimates and assumptions expressed herein are made as of the date of this communication and are subject to change without notice. This communication has been prepared based upon information, including market prices, data and other information, believed to be reliable; however, Trade Nation does not warrant its completeness or accuracy. All market prices and market data contained in or attached to this communication are indicative and subject to change without notice.

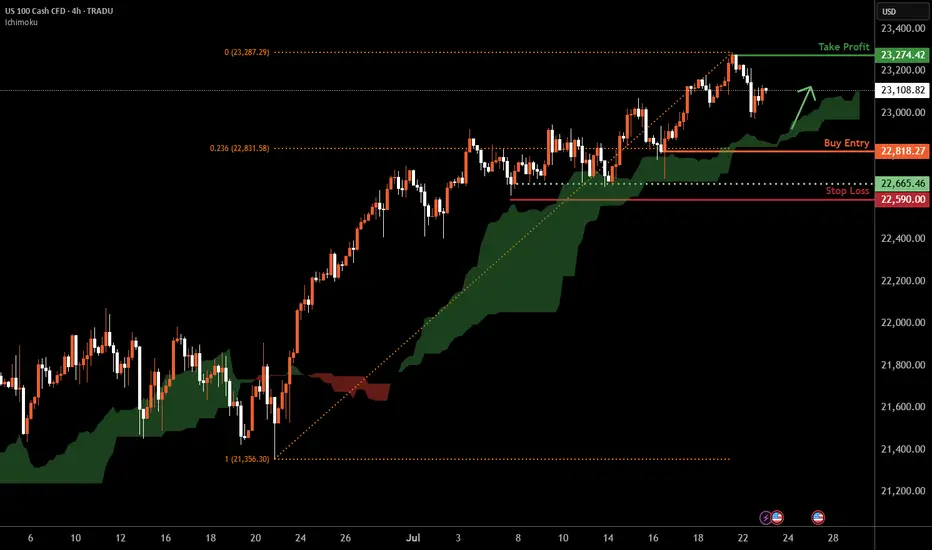
Nasdaq-100 H4 | Bullish uptrend to extend higher?The Nasdaq-100 (NAS100) is falling towards a swing-low support and could potentially bounce off this level to climb higher.
Buy entry is at 22,818.27 which is a swing-low support that aligns with the 23.6% Fibonacci retracement.
Stop loss is at 22,590.00 which is a level that lies underneath a multi-swing-low support.
Take profit is at 23,274.42 which is a swing-high resistance.
High Risk Investment Warning
Trading Forex/CFDs on margin carries a high level of risk and may not be suitable for all investors. Leverage can work against you.
Stratos Markets Limited (tradu.com ):
CFDs are complex instruments and come with a high risk of losing money rapidly due to leverage. 66% of retail investor accounts lose money when trading CFDs with this provider. You should consider whether you understand how CFDs work and whether you can afford to take the high risk of losing your money.
Stratos Europe Ltd (tradu.com ):
CFDs are complex instruments and come with a high risk of losing money rapidly due to leverage. 66% of retail investor accounts lose money when trading CFDs with this provider. You should consider whether you understand how CFDs work and whether you can afford to take the high risk of losing your money.
Stratos Global LLC (tradu.com ):
Losses can exceed deposits.
Please be advised that the information presented on TradingView is provided to Tradu (‘Company’, ‘we’) by a third-party provider (‘TFA Global Pte Ltd’). Please be reminded that you are solely responsible for the trading decisions on your account. There is a very high degree of risk involved in trading. Any information and/or content is intended entirely for research, educational and informational purposes only and does not constitute investment or consultation advice or investment strategy. The information is not tailored to the investment needs of any specific person and therefore does not involve a consideration of any of the investment objectives, financial situation or needs of any viewer that may receive it. Kindly also note that past performance is not a reliable indicator of future results. Actual results may differ materially from those anticipated in forward-looking or past performance statements. We assume no liability as to the accuracy or completeness of any of the information and/or content provided herein and the Company cannot be held responsible for any omission, mistake nor for any loss or damage including without limitation to any loss of profit which may arise from reliance on any information supplied by TFA Global Pte Ltd.
The speaker(s) is neither an employee, agent nor representative of Tradu and is therefore acting independently. The opinions given are their own, constitute general market commentary, and do not constitute the opinion or advice of Tradu or any form of personal or investment advice. Tradu neither endorses nor guarantees offerings of third-party speakers, nor is Tradu responsible for the content, veracity or opinions of third-party speakers, presenters or participants.
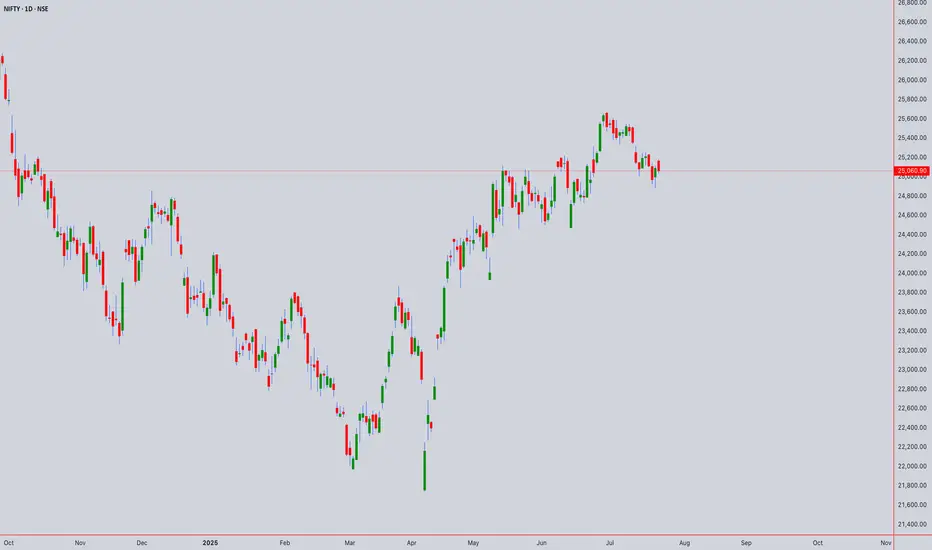
Comprehensive Technical Analysis: NIFTY50 ₹25060.90 as of 22/07Long-Term (Monthly/Weekly) - SWING PERSPECTIVE
Trend & Structure:
Elliott Wave:
Primary Trend: Bullish (Wave 3 or 5 ongoing since 2023).
Current Phase: Likely final sub-wave (Wave 5) targeting ₹25,800–26,200.
Risk: Completion of Wave 5 may trigger a 10–15% correction (ABC pattern) toward ₹22,500–23,000 (38.2% Fib retracement).
Wyckoff & Volume:
Accumulation/Distribution: Monthly volume declining near highs → early distribution signals.
Key Level: Close below ₹24,800 confirms distribution phase (bearish reversal).
Gann Analysis (Price-Time Squaring):
Square of 9:
Key Resistance: ₹25,317 (√25,060 ≈ 158.3; 158.5² = 25,132 → 159² = 25,281).
Major Support: ₹24,649 (157.5²), ₹24,000 (psychological + Gann 45° angle).
Time Cycle:
Aug-Sep 2025 critical for reversal (90-day cycle from April 2025 high).
Ichimoku (Weekly):
Kumo Cloud: Price above cloud → bullish bias.
Lagging Span (Chikou): Above price (26 weeks back) → no congestion.
Warning: Tenkan (9) below Kijun (26) on weekly → momentum loss.
Moving Averages (Weekly):
Bullish Stacking: EMA(20) > EMA(50) > SMA(100) → trend intact.
Support: EMA(20) at ₹24,200
Medium-Term (Daily/4H) - SWING ENTRY
Candlestick Patterns:
Daily: Doji/Spinning Top near ₹25,060 → indecision.
4H: Bearish Shooting Star → resistance at ₹25,150–25,200.
Harmonic Patterns:
Bullish Bat potential (PRZ: ₹24,600–24,750).
Bearish Crab if price rejects ₹25,300 (PRZ: ₹25,280–25,350).
Gann Angles:
1x1 Angle Support (from June 2025 low): ₹24,900 (break → accelerates selling).
Price-Time Squaring:
24th July = 180° from Jan 2025 low → watch for volatility.
RSI + Bollinger Bands (Daily):
RSI(14): 68 (neutral-bearish divergence → weakening momentum).
BB(20,2): Price near upper band (₹25,200) → overbought.
VWAP (4H): Price above VWAP → intraday bullish, but divergence at highs.
Intraday (1H/30M/15M/5M)
Ichimoku (1H):
Tenkan (9) > Kijun (26): Bullish.
Kumo Twist: Support at ₹24,950 (cloud top).
Sell Signal: If price breaks below Kijun (₹25,010).
Moving Averages (30M):
EMA(20): ₹25,040 (intraday support).
Death Cross: EMA(20) < SMA(50) on 15M → short-term bearish.
RSI + BB (15M):
RSI(14): 72 → overbought.
BB Squeeze: Bands narrowing → expect breakout (bearish bias below VWAP).
Gann Intraday Levels (5M):
Resistance: ₹25,100 (1x1 angle), ₹25,180 (2x1).
Support: ₹24,980 (1x1 downside), ₹24,920 (2x1).
Synthesis & Trading Plan
Bullish Scenario (Swing):
Trigger: Hold above ₹24,900 (Gann 1x1) + RSI > 60 on weekly.
Target: ₹25,800–26,200 (Wave 5, Gann Square 159²).
Stop Loss: ₹24,650 (Harmonic Bat PRZ).
Bearish Reversal (Intraday/Swing):
Trigger: Close below ₹24,950 (Ichimoku cloud) + RSI < 50.
Target: ₹24,600 (Harmonic Bat), ₹24,000 (monthly SMA).
Stop Loss: ₹25,200 (Bollinger upper band).
Intraday Levels (23rd July):
Resistance Support
₹25,100 (1H VWAP) ₹25,000 (psych)
₹25,180 (Gann 2x1) ₹24,950 (Ichimoku)
₹25,280 (Sq9) ₹24,800 (daily pivot)
Key Risk Factors
Gann Time Cycle: 24–28 July = high volatility (price-time square).
Elliott Terminal Wave: Wave 5 exhaustion → strict stop losses.
VWAP Divergence: Failure to hold above VWAP on 4H → short.
Instrument: NIFTY50
Strategy:
Swing: Wait for daily close above ₹25,150 (confirms bullish) or below ₹24,800 (bearish).
Intraday: Sell rallies to ₹25,100–25,150 (RSI>70, BB squeeze) for ₹24,950.
Verified Tools:
Gann Square of 9 + Ichimoku for precision entries.
RSI/BB for overbought/oversold filters.
For those interested in further developing their trading skills based on these types of analyses, consider exploring the mentoring program offered by Shunya Trade.(world wide web shunya trade)
I welcome your feedback on this analysis, as it will inform and enhance my future work.
Regards,
Shunya Trade
world wide web shunya trade
⚠️ Disclaimer: This post is educational content and does not constitute investment advice, financial advice, or trading recommendations. The views expressed here are based on technical analysis and are shared solely for informational purposes. The stock market is subject to risks, including capital loss, and readers should exercise due diligence before investing. We do not take responsibility for decisions made based on this content. Consult a certified financial advisor for personalized guidance.
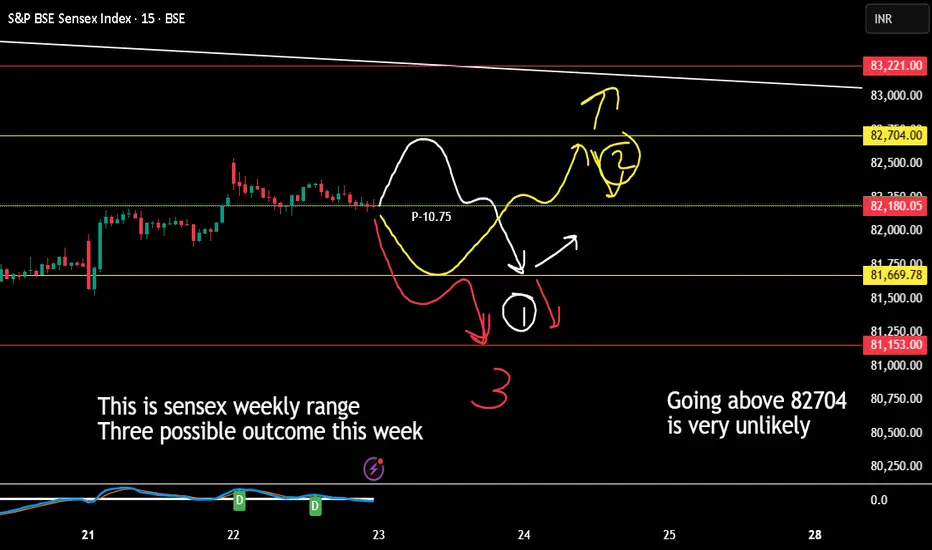
Sensex Weekly Expiry (applicable only till 29th July 2025)1. If Market VIx is less than pivot point then any price coming near pivot line or above is an opportunity to short.
2. Coming to half line below the pivot is highly possible by 80% by 24th July 2025 if not today.
3. That half line point will decide the market direction and any closing below in day to day bassis will indicate weak market.
I am expecting reversal or bulls to enter on 25th july or else by 28th July 2025
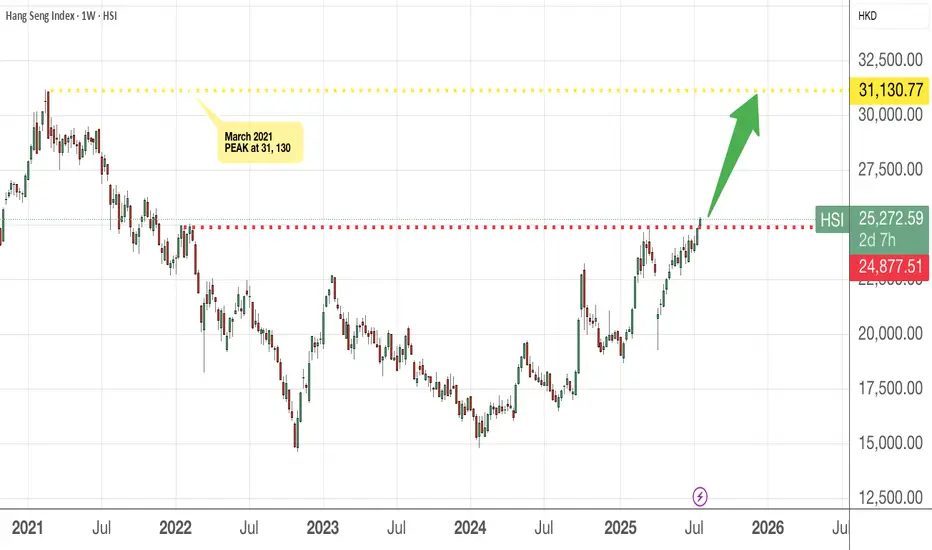
HSI has finally cleared the 25,000 level !!!!Congrats to all who are invested in the HSI index , ETF or individual stocks in HK. You should be smiling as the index crossed the 25k mark.
The next level I am looking at will be 27k mark and this will not be a straight line (as usual). Buy on pullback.
Of course, there are still many who think HK/China markets are not investable, to each his own. Everyone is entitled to your own opinion and you may have a different risk profile, time horizon and way of looking at market.
To those on board, let's ride it higher to the moon, haha!
DXY BULLISHWe sitting on a trendline third touch and also in confluence with a 61.8% level once we hold we should see a takeoff or highest we dump into $94 then we takeoff

Wall Street takes off: 5 secret growth engines for #S&P500 Record closes for the indices on July 21 came from a powerful combo: a surge in #Google , a strong start to the earnings season, gains in #Apple (+0.6%), #Amazon (+1.4%), plus #Microsoft, #Meta Platforms, and #Nvidia . This momentum, coupled with market bets on imminent Fed rate cuts and hopes for a softening US-EU tariff conflict, pushed #S&P500 and #NQ100 to new all-time highs.
5 mega drivers that could keep #S&P500 and #NQ100 on the runway through 2025:
• AI capex and monetization: Top cloud providers are ramping up spending in computing clusters and generative AI solutions. The growing lineup of paid AI products (Google Gemini, Microsoft Copilot+ Apps, Amazon Bedrock) is starting to generate significant revenue, boosting profit estimates for the “Magnificent 7.”
• Fed policy easing: If inflation keeps drifting towards 2%, we may see the first rate cut of the cycle between July and September. Historically, every 25 bps drop in 10-year UST yields adds ~2% to the #NQ100 ’s valuation multiple.
• Record buybacks and dividends: #S&P500 companies hold $3.5 trillion in cash. After tax relief on repatriated foreign earnings earlier this year, several megacap boards approved accelerated buybacks — mechanically supporting stock prices.
• Easing tariff risks: Potential trade deals between the US and EU, and the US and Mexico, would remove the threat of 20–50% tariffs priced into valuations, unlocking CAPEX in manufacturing and semiconductors — sectors with a heavy #NQ100 weight.
• Resilient consumers and services: Unemployment remains near 4%, and household spending is growing 2–3% YoY. This supports e-commerce, streaming, and platform advertising — together making up ~40% of #NQ100 and ~28% of #S&P500 .
The current highs of #S&P500 and #NQ100 aren’t a random spike — they result from strong corporate earnings, expectations of Fed cuts, and hopes of trade détente. If even some of these five drivers materialize, the indices have a strong chance to stay elevated and set new records by year-end. FreshForex analysts believe current prices could spark a new rally, with today’s market conditions offering plenty of entry points in both indices and stock CFDs.

NasdaqCOT data shows large speculators increasing net long positions on the Nasdaq-100, reflecting rising institutional confidence in tech and growth sectors. This positioning supports a bullish bias, especially as price holds above key moving averages and market breadth improves.

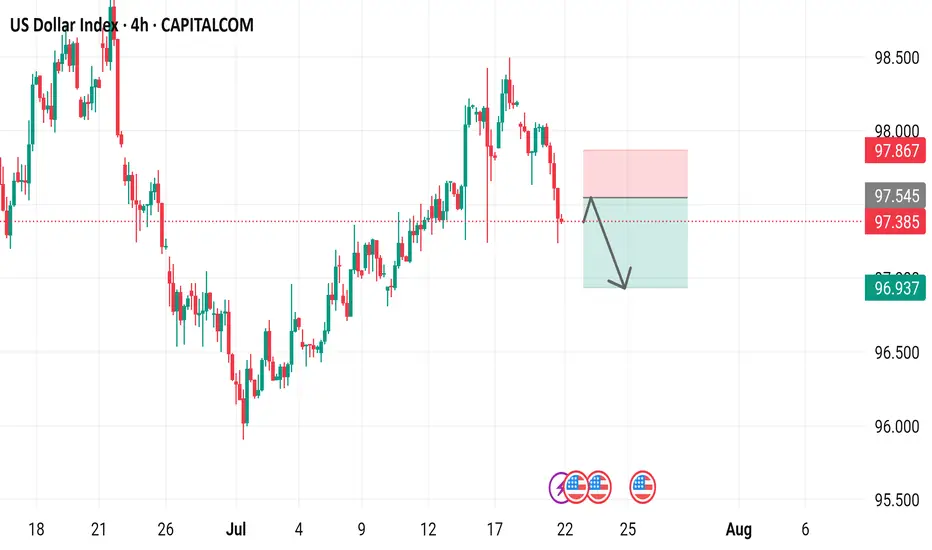
US Dollar Index 4-hour time frame, showcasing the US Dollar Index's performance over this period.
- The index is currently at 97.385, with a decrease of 0.636 (-0.65%) from its previous value.
- A red box indicates a "SELL" signal at 97.385, while a blue box suggests a "BUY" signal at 97.439.
- The chart includes various technical indicators, such as moving averages and relative strength index (RSI), to help traders analyze market trends.
07/22 Trade for US30The variation was tricky so i had to take my patience and set the stop loss with the low of the candle bar with volume.
1. Variation(Yellow) : Downtrend losing momentum
2.Wick(Blue): Wick rejecting going down
3. Volume(Red): Wait for momentum to go up

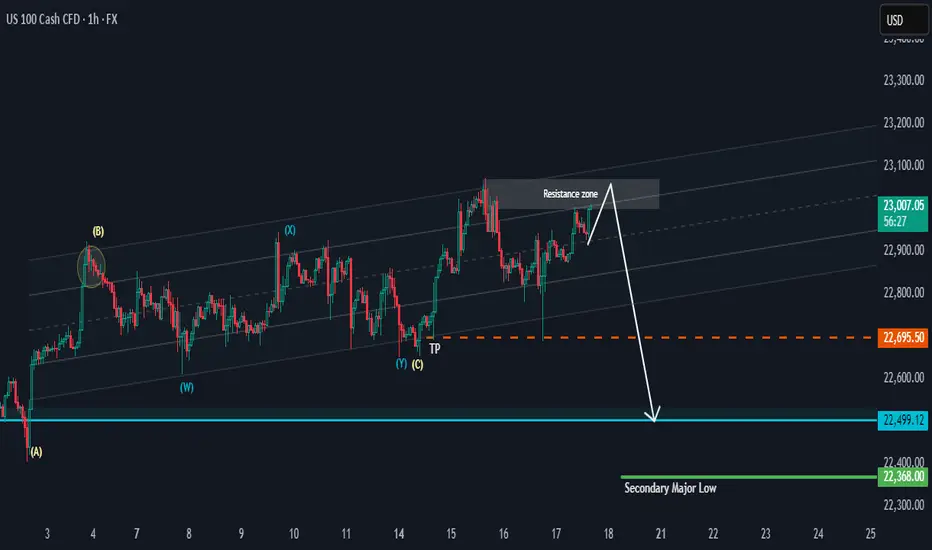
NAS 100 Potential PullbackHi there,
NAS100 has the potential to drop as it keeps testing the resistance zone in the range of 23100. This looks more like bull exhaustion than a reversal. The 22695.50 is the target for a bias of 22499.12
The overall bigger trend is bullish, with price highs aiming as far as 23717.44, 24837.28, and 26222.31, making this a potentially massive bullish trend, and it will take time to reach those highs.
Happy Trading, 🌟
K.