DXYThe current COT data shows a bullish bias for the U.S. Dollar, with institutional traders positioning net long. Although DXY is moving sideways, this positioning suggests a likely continuation of USD strength. If price breaks above key resistance levels, it would confirm the bullish sentiment reflected in the COT report.
Market indices

LAST WEEK TO GET BIDSSo as earnings push higher, it is expected that indices will try to push as there are no major news events however as this overbought Sp500 is due for correction if it taps the 6330 threshold to get to 6400.

Correction As long as the indicator does not stabilize above the green resistance area, there is a possibility of a trend change and the start of a downtrend.

Dollar $DXY Bullish WedgePretty clean falling wedge with divergence. Aligns with a pullback to come on BTC and Stocks.
A move back to 104 area would do some damage to risk on assets.
Follow for updates.
Possibility of uptrend It is expected that the triangle pattern will form according to the specified direction and then we will see the start of the upward trend. If the index breaks through the support area and consolidates, the continuation of the downward trend is likely.

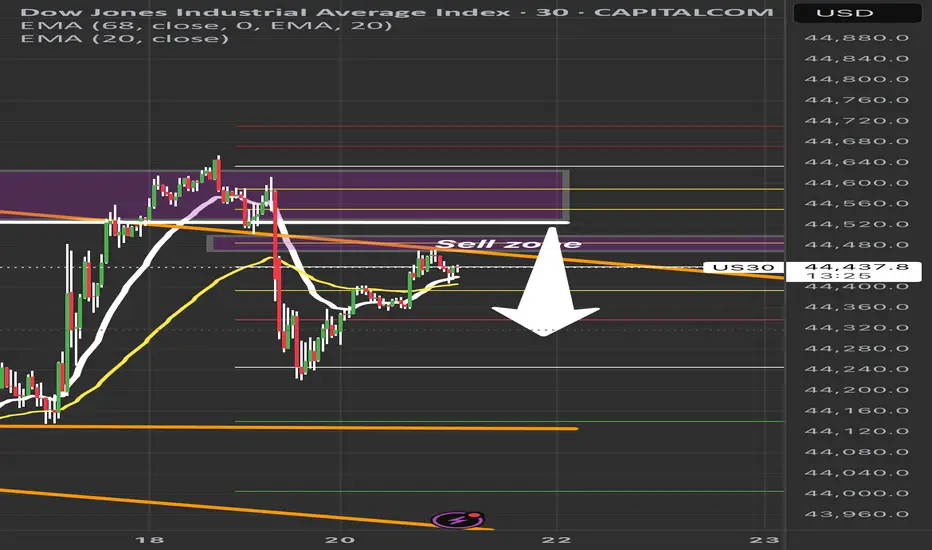
US30 Sell Setup – Watching Key Retracement ZonePrice is pulling back into a key sell zone (44,480–44,550) after a strong bearish move.
✅ Confluences:
• Previous liquidity zone
• 50–61.8% Fib retracement
• EMA rejection overhead
Plan: Waiting for bearish confirmation before short entry.
🎯 Targets:
TP1: 44,300
TP2: 44,150
TP3: 44,000
❌ Invalidation: Break above 44,600.
Patience = Precision. No confirmation, no trade.
#US30 #DowJones #TradingSetup #SmartMoneyConcepts #PriceAction #LiquidityZones #ForexTrading #DayTrading #IndicesTrading #SupplyAndDemand #TechnicalAnalysis #Fibonacci #MarketStructure #ScalpSetup #SwingTrade #RiskManagement #TradingEducation
Short NAS100Elite Discretionary Analysis
Executed trade on 30m
Price is rejecting the previous liquidity pool zone.
Targeting New York Low and CIC LP.
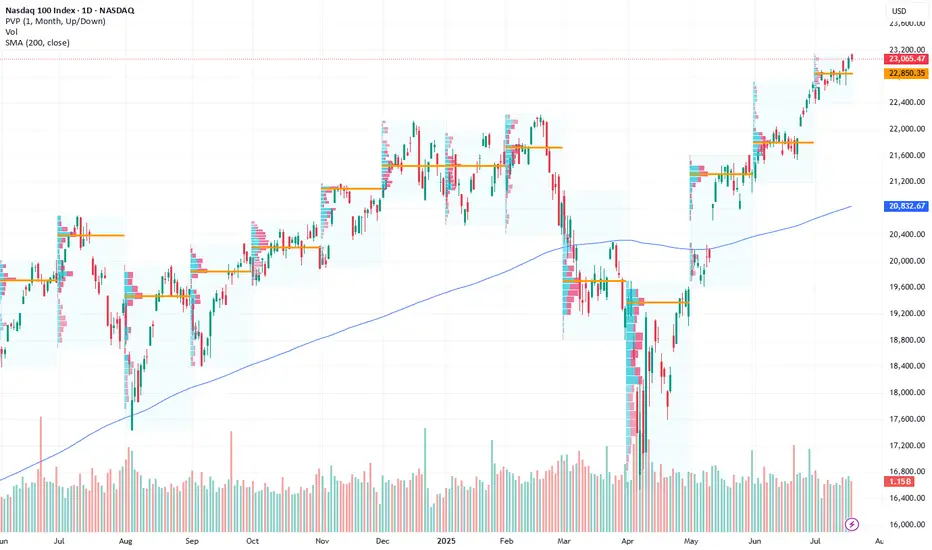
Go Long – Bullish Targets for Next Week- Current Price: $23065.47
- Key Insights: NASDAQ has exhibited resilience despite recent sentiment shifts,
showing signs of potential upside driven by a solid rebound in major tech
stocks. With earnings season approaching, improved performance in underlying
components reinforces long-term confidence in the index.
- Price Targets:
- T1: $23427.43
- T2: $23696.12
- S1: $22834.82
- S2: $22604.17
- Recent Performance: Over the past week, NASDAQ has consolidated near its
current levels, with intraday volatility driven by sector rotations and
macro concerns. While sentiment has weakened, the index remains supported by
key levels near the $23,000 mark.
- Expert Analysis: Analysts express optimism around key components such as
Apple, Microsoft, and Nvidia, which have recently seen improved outlooks.
Broader tech sector strength may drive NASDAQ higher. Caution is advised
given geopolitical uncertainties but upside opportunities dominate momentum.
- Sentiment Analysis:
- Current sentiment: 0
- Last week: 62.5
- Change: -62.5
- Total mentions: 386
- News Impact: Positive developments in semiconductor growth forecasts and
easing fears over rate hikes have supported bullish sentiment. However, last
week’s lower-than-expected inflation data and Federal Reserve signals for
"higher rates for longer" dampened sentiment overall.
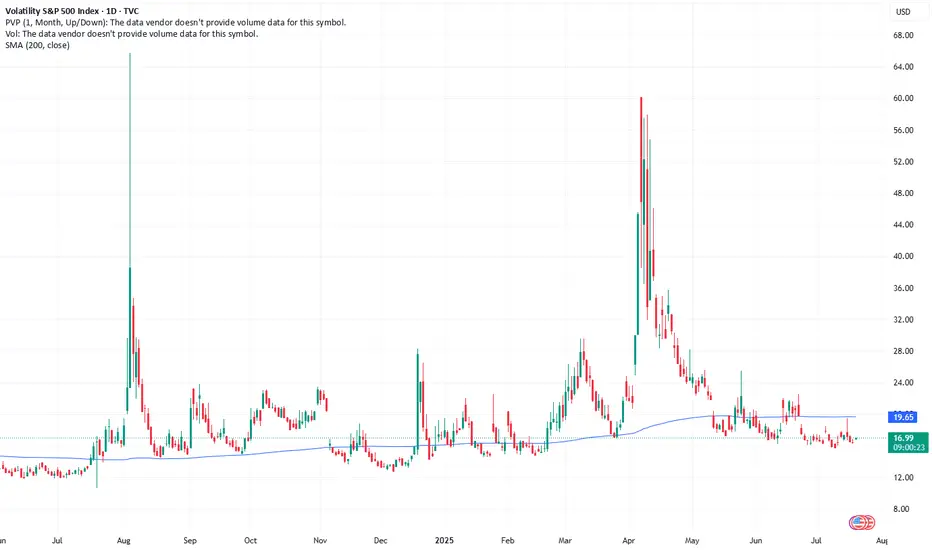
Go Long on VIX: Predictions for Increased VolatilityCurrent Price: $16.41
Direction: LONG
Targets:
- T1 = $17.50
- T2 = $18.25
Stop Levels:
- S1 = $15.90
- S2 = $15.65
**Wisdom of Professional Traders:**
This analysis synthesizes insights from thousands of professional traders and market experts, leveraging collective intelligence to identify high-probability trade setups. The wisdom of crowds principle suggests that aggregated market perspectives from experienced professionals often outperform individual forecasts, reducing cognitive biases and highlighting consensus opportunities in VIX.
**Key Insights:**
The VIX, commonly referred to as the "Fear Index," is currently hovering at historically low levels of 16.41, well below the psychologically significant threshold of 20. This indicates a relatively calm equity market, but traders know all too well that complacency often precedes sharp volatility spikes. Key breakout levels range between 18 and 19, with the potential to test mid-20 range if significant macroeconomic or geopolitical events materialize. Traders are advised to consider hedging strategies while monitoring these thresholds closely.
The current low-volatility environment reflects broad market optimism, but it also suggests the possibility of a quick reversal. Historically, prolonged periods of suppressed VIX readings can lead to sharper corrections when fear abruptly rises. For this reason, traders should stay vigilant, particularly with major economic events on the horizon.
**Recent Performance:**
Over the past few weeks, the VIX has steadily declined, breaking below 17 and reaching the current zone of 16.41. This downward momentum aligns with bullish equity markets, where major indices like the S&P 500 continue to hover near all-time highs. This subdued state demonstrates investor confidence but warns of potential complacency risks.
**Expert Analysis:**
Market analysts emphasize the importance of the 18-19 zone, which serves as a critical resistance range. A sustained breakout above these levels could lead to a move into the 20-25 range, driven by renewed market uncertainty. Technically, the VIX remains oversold, implying the probability of an upward momentum shift soon. Experts point to factors such as Federal Reserve policy statements, inflation data, and geopolitical surprises as potential catalysts. Overall, professional sentiment skews towards a medium-term bullish stance on VIX.
**News Impact:**
Recent market headlines indicate hedging activities through August and September VIX futures, preparing for a potential volatility spike tied to macroeconomic concerns or policy announcements. Additionally, the simultaneous drop in the MOVE index—a measure of bond market volatility—further signals market complacency, raising questions about whether markets are adequately pricing in risks. These factors, combined with historically low VIX levels, suggest that a volatility breakout is on the table in the coming weeks.
**Trading Recommendation:**
With the VIX at suppressed levels, traders have an opportunity to position themselves for a potential upside. Going long on VIX with an initial target of $17.50 and a secondary target of $18.25 provides a favorable risk-to-reward setup. Stop-losses at $15.90 and $15.65 help manage downside risks effectively. This strategy aligns with historical patterns where low VIX levels are followed by periods of heightened volatility, especially during critical market junctures.
Litty Like US30!!I'm purely going off the Week chart. 4hr MSS+ 4hr BPR gives me reasons to buy price. I'm targeting the Equal Highs on the Weekly chart.

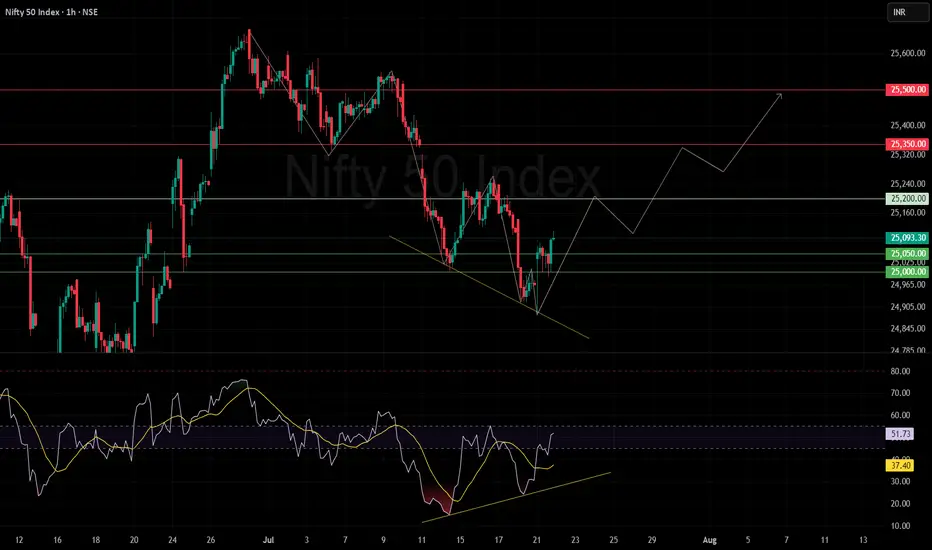
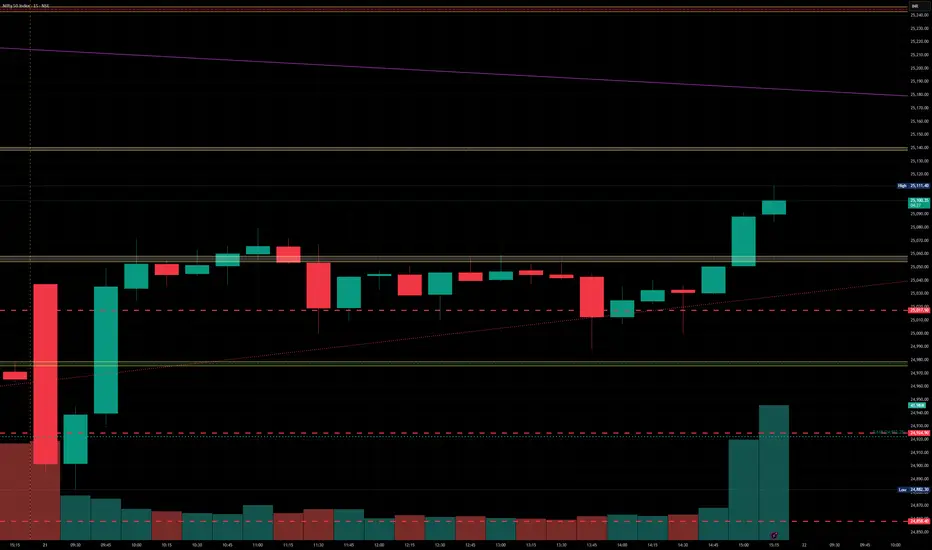
Nifty bounced with a liquidity grab.Market Action Overview
Breakdown Below 25,000: The Nifty 50 index recently dipped below the psychologically significant level of 25,000, a move that likely triggered stop-loss orders and drew out short-sellers.
Liquidity Grab: This action can be interpreted as a classic "liquidity grab," where the market briefly breaks a key support, absorbs sell-side liquidity, and shakes out weak hands before reversing direction.
Quick Rebound: Following the breakdown, the index swiftly reclaimed the 25,000 mark, signaling a strong buy-side response and potential exhaustion of selling pressure.
Recent Trend: The index recently rebounded from a downward phase, forming a lower low before bouncing from a support zone.
Support Levels: Key supports are visible at 25,000 and 25,050.
Resistance Levels: Notable overhead resistances are at 25,200, 25,350, and 25,500.
Potential Path & Projections
The indicated projection outlines a potential upward journey:
A base formation near current levels.
Possible upward move toward 25,200.
If sustained, a further rally toward the resistance levels of 25,350 and then 25,500.
The chart suggests a zig-zag correction/consolidation before each resistance break, implying healthy pullbacks amid the upward path.
Trendlines & Patterns
Falling Wedge Breakout: The downtrend appears to be capped by a descending trendline which has just been breached to the upside—a potentially bullish signal.
Short-Term Recovery: An optimistic bias is presented by the "inverted V" or "W-shaped" price action, hinting at accumulating strength.
RSI Pattern: The RSI is climbing from its recent lows and maintains an upward trendline also showing positive divergence with price, supporting a bullish outlook.
Momentum: If the RSI sustains above 50, momentum could stay positive; a move above 60 might trigger increased buying.
Key Takeaways
Short-Term Bias: Bullish, given breakout patterns and the upward RSI momentum.
Critical Levels to Watch:
Support: 25,000
Resistance: 25,200, 25,350, 25,500
Confirmation Needed: Watch for price acceptance above 25,200 for further bullish momentum. Failure to hold above 25,000 may invalidate the positive setup.
Conclusion
Indicators point to a potential short-term recovery for the Nifty 50, provided support holds and RSI maintains or extends its upward trajectory. Resistance breakouts above 25,200 could open the door to higher targets, but as always, traders should monitor for reversals near mapped resistance zones.
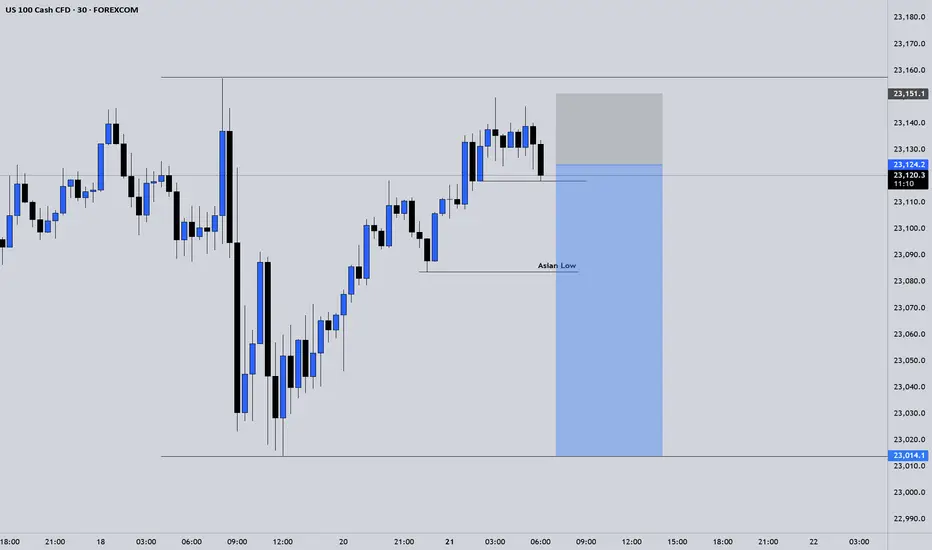
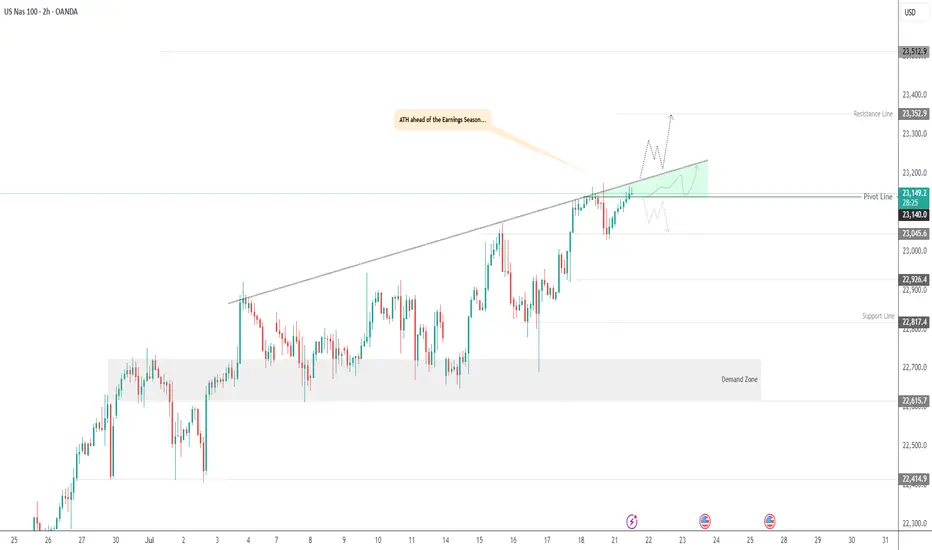
USNAS100 | Bullish Setup Ahead of Tech Earnings & Trade RiskUSNAS100 | Bullish Setup Ahead of Tech Earnings & Trade Risk
U.S. equity markets are entering a pivotal week with big-tech earnings and renewed focus on Trump’s proposed trade tariffs. Both the S&P 500 and Nasdaq are hovering near record highs, but new catalysts are required for continuation.
Technical Outlook:
The price has stabilized above 23140, breaking the pivot and confirming bullish momentum. As long as the price holds above this level, the trend remains bullish, especially if it breaks the green triangle resistance structure.
A sustained move above 23140 opens the path toward 23250 and 23350, with further extension possible to 23510.
However, a 4H close below 23140 may activate a bearish correction toward 23045, and possibly deeper toward 22920 and 22820.
Resistance Levels: 23250 · 23350 · 23510
Support Levels: 23045 · 22920 · 22820
Bias: Bullish above 23140
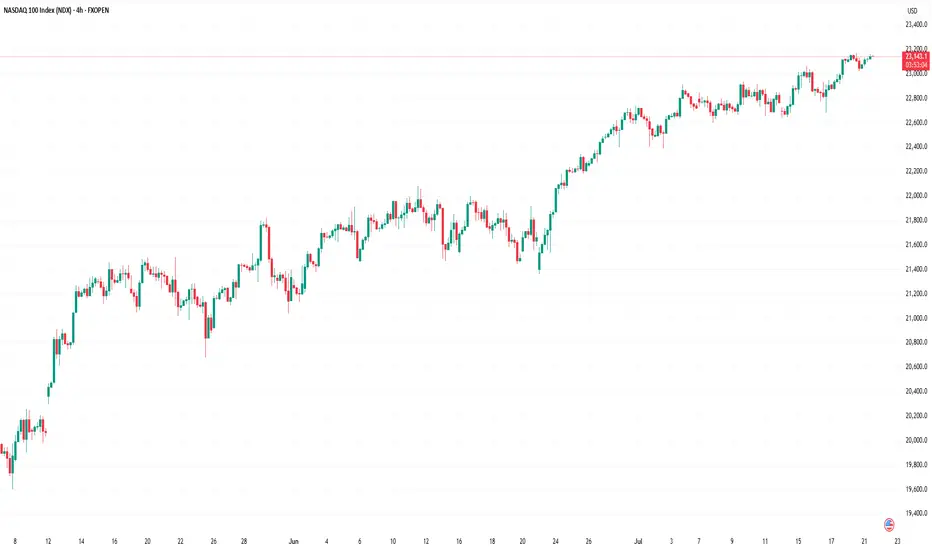
Nasdaq 100: Market Optimism Builds Ahead of Big Tech EarningsNasdaq 100: Market Optimism Builds Ahead of Big Tech Earnings
The earnings season is gaining momentum. This week, major technology companies such as Alphabet (GOOGL) and Tesla (TSLA) are scheduled to release their quarterly results.
Given that 85% of the 53 S&P 500 companies that have already reported have exceeded analysts’ expectations, it is reasonable to assume that market participants are also anticipating strong results from the big tech names. The Nasdaq 100 index (US Tech 100 mini on FXOpen) set an all-time high last week — a level that may be surpassed (potentially more than once) before the end of August.
Technical Analysis of the Nasdaq 100 Chart
Price movements have formed an upward channel (marked in blue), with the following dynamics observed:
→ The bearish signals we highlighted on 7 July did not result in any significant correction. This may be interpreted as a sign of a strong market, as bearish momentum failed to materialise despite favourable technical conditions.
→ Buyers have shown initiative by gaining control at higher price levels (as indicated by the arrows): the resistance at 22,900 has been invalidated, while the 23,050 level has flipped to become support.
→ A long lower shadow near the bottom boundary of the channel (circled on the chart) underscores aggressive buying activity.
Should the earnings and forward guidance from major tech firms also come in strong, this could further reinforce the sustainable bullish trend in the US equity market.
This article represents the opinion of the Companies operating under the FXOpen brand only. It is not to be construed as an offer, solicitation, or recommendation with respect to products and services provided by the Companies operating under the FXOpen brand, nor is it to be considered financial advice.
Dow Jones is Nearing an Important Support!!Hey Traders, in today's trading session we are monitoring US30 for a buying opportunity around 43,950 zone, Dow Jones is trading in an uptrend and currently is in a correction phase in which it is approaching the trend at 43,950 support and resistance area.
Trade safe, Joe.

BankNifty levels - Jul 22, 2025Utilizing the support and resistance levels of BankNifty, along with the 5-minute timeframe candlesticks and VWAP, can enhance the precision of trade entries and exits on or near these levels. It is crucial to recognize that these levels are not static, and they undergo alterations as market dynamics evolve.
The dashed lines on the chart indicate the reaction levels, serving as additional points of significance. Furthermore, take note of the response at the levels of the High, Low, and Close values from the day prior.
We trust that this information proves valuable to you.
* If you found the idea appealing, kindly tap the Boost icon located below the chart. We encourage you to share your thoughts and comments regarding it.
Wishing you successful trading endeavors!

Nifty levels - Jul 22, 2025Nifty support and resistance levels are valuable tools for making informed trading decisions, specifically when combined with the analysis of 5-minute timeframe candlesticks and VWAP. By closely monitoring these levels and observing the price movements within this timeframe, traders can enhance the accuracy of their entry and exit points. It is important to bear in mind that support and resistance levels are not fixed, and they can change over time as market conditions evolve.
The dashed lines on the chart indicate the reaction levels, serving as additional points of significance to consider. Furthermore, take note of the response at the levels of the High, Low, and Close values from the day prior.
We hope you find this information beneficial in your trading endeavors.
* If you found the idea appealing, kindly tap the Boost icon located below the chart. We encourage you to share your thoughts and comments regarding it.
Wishing you success in your trading activities!
DAX / GER40: Double Long tradeGood morning traders,
I just received an alert from my LuBot Ultimate indicator of a Long signal on a good uptrend structure.
From the weekly chart I see that we are surfing on the wave of the second swing after the last bearish retracement, however on the daily the first swing has just begun after a slight minimum made in the last few days.
On the 4H this opportunity presents itself which I take advantage of in a doubly way, that is:
-I insert a trade on correction with stop at the level suggested by the indicator and TP to be defined based on the trend.
-I insert a second trade, again on correction, but with stop below the latest lows and take profit on the latest highs, the invested capital is much lower in this case in order to contain the loss but optimize any profit.
👍 If you want to see other similar posts, like/boost
🙋♂️ Remember to follow me so you don't miss my future analyses
⚠️ Disclaimer: This post is for informational purposes only and does not constitute financial advice. Always do your research before making investment decisions.
AMEX:EWG BMFBOVESPA:DAX1! FPMARKETS:GER40 PEPPERSTONE:GER40 ACTIVTRADES:GER40 XETR:DAX

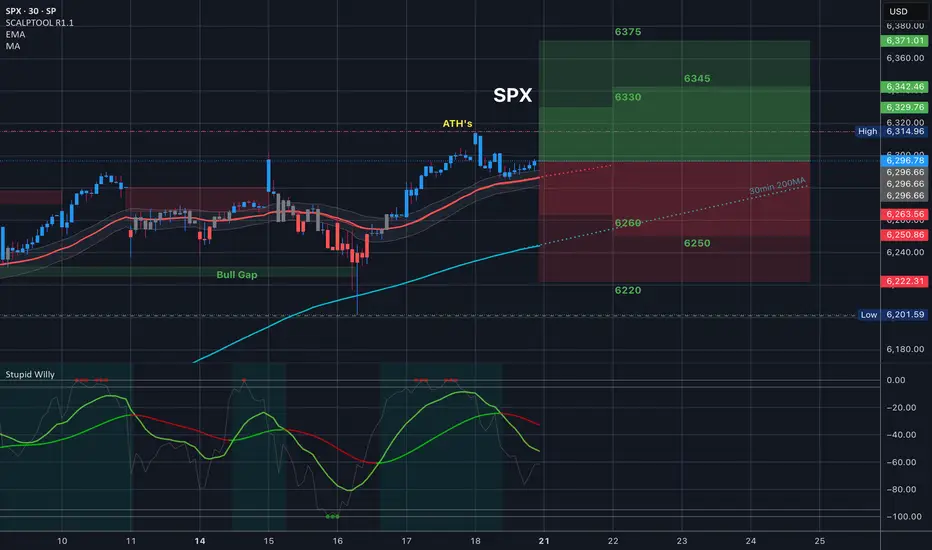
$SPX Trading Range for 7.21.25 and everything in itToday’s Trading range and everything in it. How are you playing it?
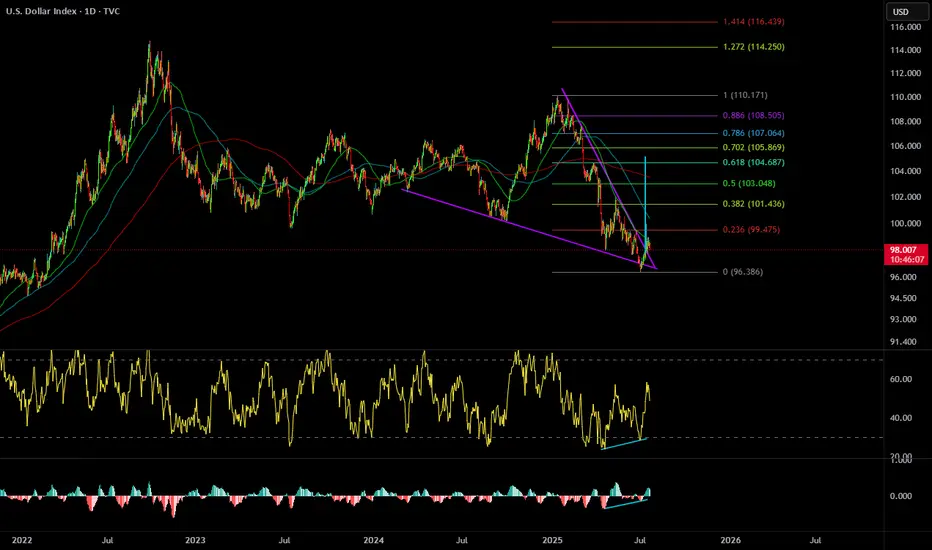
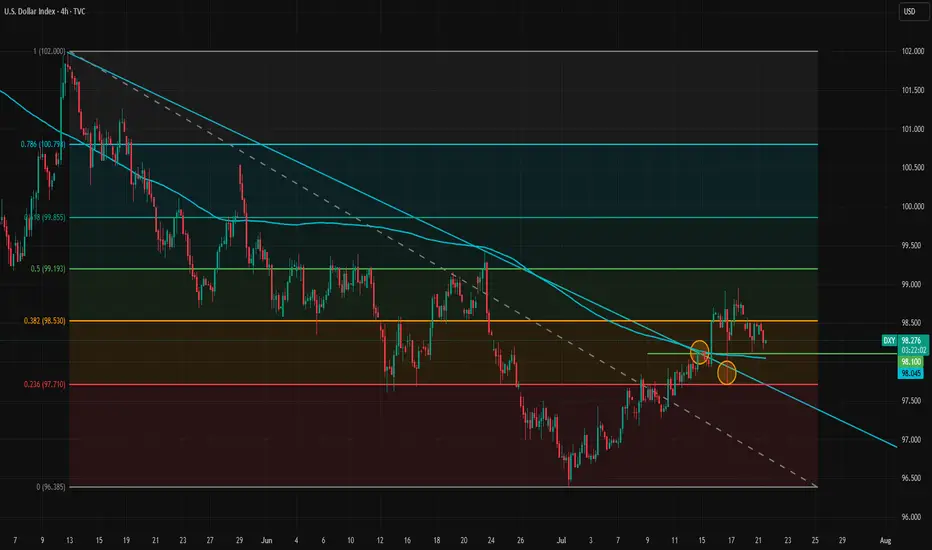
Fundamentals Support Dollar’s Potential Trend ReversalThe dollar appears to be reversing its direction on the 4-hour timeframe. The trendline has been broken and retested twice, but the dollar has held above it, signaling a potential shift in momentum.
Despite intense pressure from the White House on the Federal Reserve, the data is likely to prevent the Fed from cutting rates at the upcoming meeting and possibly at the one after that. A potential rate cut in September will largely depend on incoming inflation and labor market data.
The inflation impact of tariffs became more visible in the latest CPI report, but the effect is still relatively modest. This aligns with our theory that tariff-driven inflation will build gradually and persist over a longer period, rather than cause an immediate spike.
Meanwhile, the labor market has not shown clear signs of rapid weakening, so there is no strong case for a rate cut from that side either. The Financial Conditions Index also indicates that monetary policy remains on the accommodative side. Bloomberg financial conditions index is at highest level since March.
As markets increasingly recognize that no rate cuts are likely in the near term, and with the August 1 tariff deadline approaching amid potential rising risks of trade tensions between the U.S. and the EU, the dollar may gain further support. The U.S.–EU bond market spread also does not favor a stronger euro at the moment, adding to the dollar's upside potential.
In the short term, 98.10 and 98.53 are immediate support and resistance levels. If the dollar breaks above 98.53 again, upward momentum may strengthen and open the path toward the 100 level.
NAS100 - Stock Market Awaits Tariffs!The index is trading above the EMA200 and EMA50 on the 1-hour timeframe and is trading in its ascending channel. The target for this move will be the channel ceiling, but if it corrects towards the indicated support area, it is possible to buy Nasdaq with better reward to risk.
In a week once again clouded by trade tariff threats, the stock market reacted cautiously at times. However, what truly captured investors’ attention was growing concern over potential political interference in Federal Reserve policymaking—a development that influenced market sentiment and shifted the focus away from geopolitical tensions.
Despite political headwinds, U.S. economic data continued to show signs of resilience. Investors this week were more focused on corporate earnings and inflation data than on trade war rhetoric or speculation about Jerome Powell’s possible dismissal. While betting markets such as Polymarket raised the odds of Powell being removed to 40%, legally, the president cannot dismiss the Fed Chair without a valid cause—and allegations like “lying to Congress” lack legal standing.
Still, the greater danger lies not in Powell’s dismissal itself but in the potential erosion of the Federal Reserve’s independence—something that could unsettle investors in stocks, bonds, and currencies alike. Analysts expect Trump may soon appoint an ally as an informal or “shadow” Fed Chair, a move that would elevate political risk in financial markets.
Nevertheless, markets are continuing to operate along familiar lines: equities focus on corporate profits, the bond market on inflation and growth, and the currency market on relative returns. For now, the takeaway is clear: Trump is winning—but perhaps only temporarily.
Rick Rieder, Chief Investment Officer at BlackRock, noted that despite trade tensions and inflation concerns, tariffs have had limited impact so far. Following the June CPI report, he pointed out that inflation ticked up slightly—core CPI rose by 0.23% monthly and 2.93% annually, while headline inflation was up 0.29% monthly and 2.67% annually—but the broader trend still reflects easing price pressures.
Rieder attributed this to companies acting preemptively, managing inventory and adjusting supply chains to avoid passing on costs to consumers. He also cited easing wage pressures and a weakening labor market as factors contributing to the decline in inflation.
As such, Rieder believes the Federal Reserve might lower interest rates in September, though a cut in July is less likely, as the central bank would prefer to assess the impact of tariffs first.
According to the Wall Street Journal, Treasury Secretary Scott Besant privately urged Trump not to remove Jerome Powell. Besant warned that such an action could cause unnecessary turbulence in financial markets and the broader economy, and would also face legal and political hurdles. He emphasized that the Fed is already signaling potential rate cuts later this year, and confronting Powell now would be unwarranted.
A source noted that Besant reminded Trump the economy is performing well, and markets have responded positively to administration policies—another reason to avoid drastic moves.
On another front, rising long-term bond yields have become a concern for Besant, as they increase the government’s borrowing costs.He has been working to keep yields in check and believes firing Powell could further escalate them—hence his conversation with Trump aimed at dissuasion.
The coming week will begin with market attention on the European Central Bank’s rate decision, which could set the tone for Eurozone monetary policy in the second half of the year. Meanwhile, a series of key U.S. economic data will be released, providing a clearer view of conditions in employment, production, and housing.
On Tuesday, Jerome Powell will deliver an opening speech at an official event in Washington. While he is unlikely to directly address Trump’s recent verbal attacks, investors will be listening closely for any subtle references to Fed independence or interest rate direction.
On Wednesday, the June existing home sales report will be released, which could indicate whether housing demand remains steady or is weakening.
Thursday will be a packed day on the economic calendar. The ECB’s rate decision will be announced—an event under heavy scrutiny amid Eurozone stagnation. In the U.S., preliminary PMI data from S&P, weekly jobless claims, and new home sales will also be published.
Finally, the week will wrap up on Friday with the release of U.S. durable goods orders—an important gauge of capital investment in the manufacturing sector.

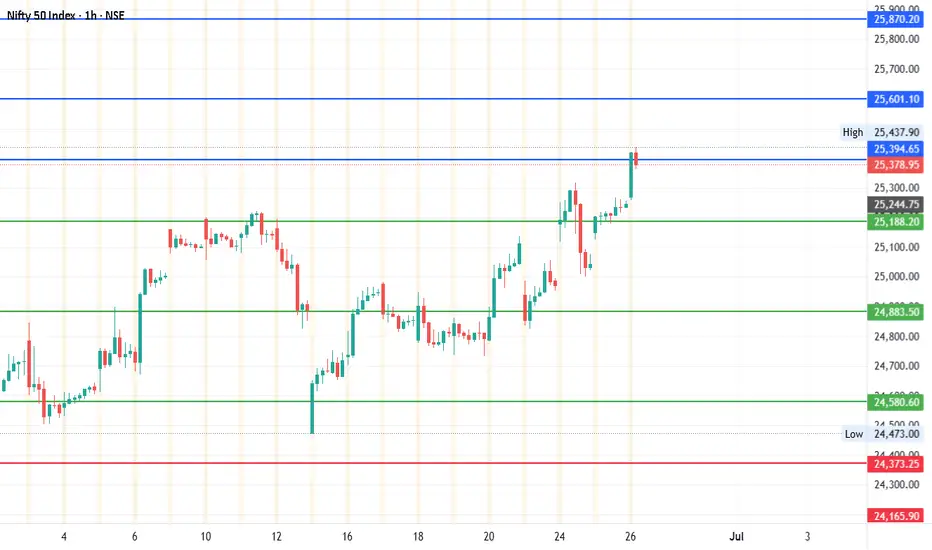
#NIFTY - 640 pts done. What Next?May 29
Date: 29-05-2025
#NIFTY - Pivot Point is 24883.50
#NIFTY Current Price: 24755 (As on 29th May 2025 post is still valid). We also have other pivot points, and the target levels are pointing to the much higher. Both the pivots are valid.
Every pivot point will have a different target level.
Upside Target 1: 25394.66 is hit and continue to watch these levels.
Upside Targets: 25394.66, 25601.10, 25870.20 and 26139.30
Downside Targets: 24373.24, 24165.90, 23896.80 and 23627.70
Support: 24580.58
Resistance: 25188.21
#Nifty - Pivot Point: 25031.63Date: 18-07-2025
#Nifty Current Price: 25025
Pivot Point: 25031.63 Support: 24794.06 Resistance: 25270.32
#NiftyUpside Targets:
Target 1: 25376.92
Target 2: 25483.53
Target 3: 25652.99
Target 4: 25822.45
#NiftyDownside Targets:
Target 1: 24686.89
Target 2: 24579.73
Target 3: 24410.26
Target 4: 24240.80
#TradingView #Stocks #Equities #StockMarket #Investing #Trading #Nifty
#TechnicalAnalysis #StockCharts #Finance

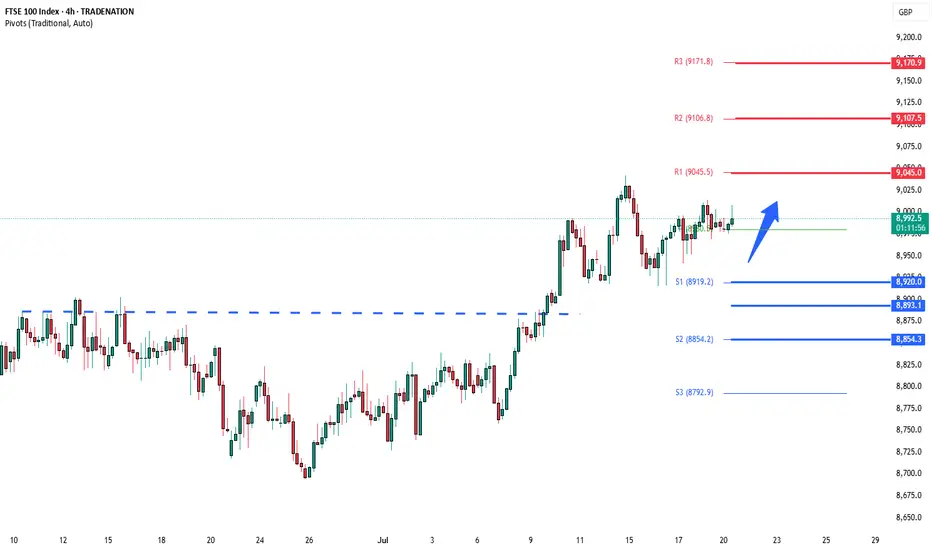
FTSE bullish consolidation resistance at 9045The FTSE remains in a bullish trend, with recent price action showing signs of a corrective pullback within the broader uptrend.
Support Zone: 8020 – a key level from previous consolidation. Price is currently testing or approaching this level.
A bullish rebound from 8920 would confirm ongoing upside momentum, with potential targets at:
9045 – initial resistance
9107 – psychological and structural level
9170 – extended resistance on the longer-term chart
Bearish Scenario:
A confirmed break and daily close below 8920 would weaken the bullish outlook and suggest deeper downside risk toward:
8893 – minor support
8854 – stronger support and potential demand zone
Outlook:
Bullish bias remains intact while the FTSE holds above 8920. A sustained break below this level could shift momentum to the downside in the short term.
This communication is for informational purposes only and should not be viewed as any form of recommendation as to a particular course of action or as investment advice. It is not intended as an offer or solicitation for the purchase or sale of any financial instrument or as an official confirmation of any transaction. Opinions, estimates and assumptions expressed herein are made as of the date of this communication and are subject to change without notice. This communication has been prepared based upon information, including market prices, data and other information, believed to be reliable; however, Trade Nation does not warrant its completeness or accuracy. All market prices and market data contained in or attached to this communication are indicative and subject to change without notice.