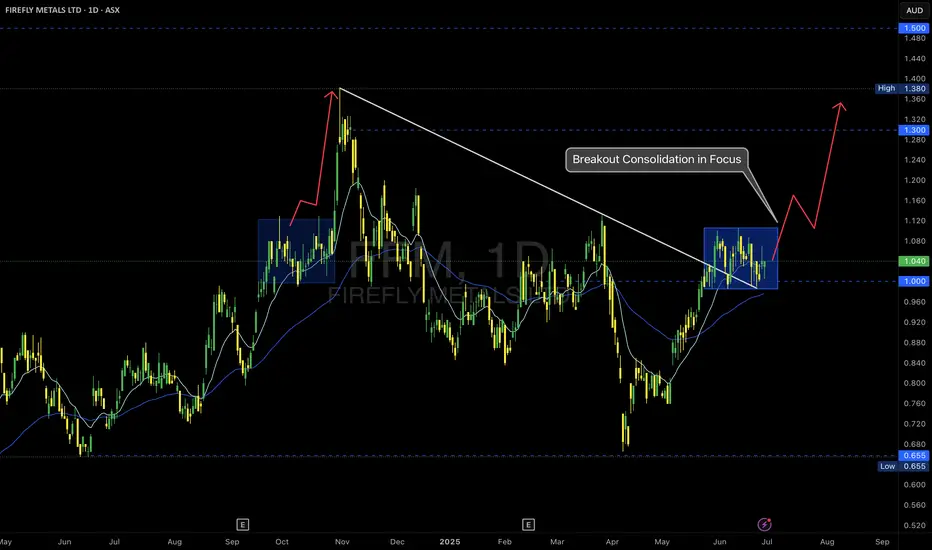
FFM -- ASX – Breakout Consolidation in Focus
📝 Description
Firefly Metals is setting up a classic breakout continuation scenario after reclaiming the $1.00 psychological level and breaking the long-term trendline resistance.
🔹 Key Observations:
• Trendline Break: The descending trendline from the prior high was decisively breached, signaling a structural shift.
• Accumulation Zone: Price has consolidated in a tight range above $1.00, forming a bullish flag or box accumulation.
• EMA Cluster Support: Both the 15 and 60 EMAs are aligned below the consolidation, providing dynamic support.
🔹 Potential Scenarios:
✅ Bullish Continuation:
A clean breakout above the top of the blue box could trigger a momentum rally toward $1.30 and ultimately the $1.38–$1.50 resistance levels.
✅ Deeper Pullback:
If price loses the $1.00 support decisively, a retracement to retest the breakout base is possible.
Trade Plan:
I am monitoring for a confirmed breakout candle with volume expansion to validate the continuation thesis.
• Entry trigger above the range high ($1.10 area)
• Stops below recent swing low / $1.00 level
• First target: $1.30 resistance
As always, risk management first—no breakout, no trade.
#MJTrading
#FFM #FireflyMetals #ASXTrading #BreakoutSetup #TechnicalAnalysis #PriceAction #TradingPlan #ChartOfTheDay #AustralianStocks #MomentumTrading #MJTrading
Bearish potential detected for AGLEntry conditions:
(i) breach of the lower confines of the Darvas box formation for ASX:AGL
- i.e.: below low of $9.84 of 7th April, and
(ii) swing increased bearishness of indicators such as DMI/RSI along with a test of prior level of support of $10.02 from 11th March.
Stop loss for the trade (based upon the Darvas box formation) would be:
(i) above the high of 10th April (i.e.: above $10.89), or
(ii) above the prior support level from the open of 10th January (i.e.: above $11.15), depending on risk tolerance.

Vys longPotential long buying opportunity on Vys. Fourth push up looking to breakout of the wedge consolidation pattern, short term Ema all converging and volume starting to increase into what should hopefully be a strong 2h earnings report. There has been strong buying from its recent low of 0.34c qll the way up to 0.48c and holding at 0.45c. RSI sitting at around 50 has it sitting currently neutral if it starts to pick up hopefully that will confirm the breakout. Buying at 0.45c with a stop loss at 0.42c with a target of 0.52c offers a 3:1 risk reward.

Bearish potential detected for BAPEntry conditions:
(i) lower share price for ASX:BAP along with swing of DMI indicator towards bearishness and RSI downwards, and
(ii) observing market reaction around the share price of $4.82 (close of 18th June).
Stop loss for the trade would be:
(i) above the high of the recent swing high once the trade is activated (currently $4.92 from the high of 19th June), or
(ii) above the prior resistance zone of $4.87 from 8th November 2024, depending on risk tolerance.

EGL long term buy setup almost readyHey people,
watching for the c wave down before long-term upside have an alarm or watch this daily/weekly for the buy setup according to your strategies... previous buy for an investor scored 1000% @0.035 more upside to come structure playing out perfectly

APX Rebound in Play?📈 “APX Rebound in Play? Eyeing the AUD 1.55 Resistance”
Appen (APX) has shown a significant uptick today, closing at AUD 1.040 (+5.58%) with a sharp volume spike (8.96M shares) that could suggest accumulation. After a long downtrend, price appears to be consolidating above key support near AUD 1.00, forming a potential base for reversal.
🔍 Chart Highlights:
Support Zone: AUD 1.000 – strong historical level holding.
Resistance Targets: → AUD 1.555 → AUD 1.655 → AUD 1.785
R/R Setup: Defined green zone shows potential upside if momentum continues; red zone clearly marks invalidation below support.
🧠 Thesis: If APX maintains momentum and holds above AUD 1.00, we may be witnessing a structural shift with upside potential toward AUD 1.78 in stages. Breakout traders might watch for confirmation via volume and price action at each resistance.
💬 “Could we be looking at an early-stage reversal or just a dead-cat bounce? Watching the 1.00 level closely.”
#ASX #APX #APPEN #MJTRADING #TRADING #SHARE #STOCKMARKET #BUY #CHART #MONEYMANAGEMENT

FMG - complete correction - trend continuationHey people,
looking at this as a complete expanding flat, with the most recent piece being an impulse and 123 (sharp waves) running flat with the reversal beginning now (potential RSI entries)

Conservative 630% upside for Horizon MineralsHello and thanks for viewing.
I tend to write a lot. My valuation is based on a few assumptions;
- There are no new material ore discoveries as extraction progresses,
- The gold price doesn't rise over time,
- The miner will have the 'average' profitability of gold miners of 11% (I use 10%),
- The miner will be fairly but not excessively valued vs its earnings. I used a PE ratio of 20, which is pretty normal.
Reserves are over 1.8 million ounces x AUD4539/oz = AUD8.17B / 25 year mine life = AUD326m a year. At 10% EBIT this is AUD 32.6m in earnings per year. If valued at a PE ratio of 20, this would give the mine a value of 653.6m. The current Market Cap is AUD103m (up 53% in the past month) so a 6.3x of the current price is $0.456.
I have already bought in and am up 46% in a week :) so WHEN we hit $0.45 that is a 9.5x gain for me. I might sell 50% then, not sure, depends on how much positive news accumulates up until that point.
Just sharing my method. I feel it is easy to apply, is sufficiently conservative, not too naive. Oh, I don't trade short-term. I have found that short-term trading only makes money for brokers and dramatically increases risk. I find a share that I am comfortable offers a large margin of safety, if the price goes down after I buy in, I am happy, especially if I can add to my position.

DVP chat with ASX and Craig Tappinghas had a wave 1 accumulation on the monthly, loving this for a buy whilst in wave 3 now!!
DVP Moon!

DVP chat with. ASX and CraigDVP chat with. ASX and Craig discussing the potential of DVP to moon!@
it has had a accumulation that is setting it up to rocket!

ASX on WatchLooking to buy the pullback/retest under $68
Why:
Looking for bounce off demand zone, $67.50 - $68
1.618 fib extension lines up with demand zone
Head and shoulders pattern is forming. Not a good time to go long

High Dividend Stock on the Move? COH – Eyes on 351.51 Cochlear Limited (ASX: COH) is showing strong bullish potential after price tapped into a respected Monthly Order Block (OB). This region aligns with a historically strong demand zone, offering a prime entry opportunity for longer-term investors and SMC traders alike.
From a Smart Money Concept (SMC) perspective, the structure remains bullish:
- Price swept a low into the Monthly OB, indicating engineered liquidity grab.
- The reaction shows strong displacement to the upside, validating the OB.
- Volume also suggests institutional interest at this level.
- There’s now a clean path toward Equal Highs at 351.51, a natural draw for buy-side liquidity.
With COH offering consistent dividend payouts, this could be a double win – capital appreciation + income.
🧠 As always: Do Your Own Research (DYOR).

potential start of the upside... page 4hey people,
looking at the four hourly structure as a running flat with sharp a and c wave, i dont see this still continuing to the upside, strongly, if it retetests 3.27 strong potential for upside imminent haha

QANTAS ShortQANTAS is now net short on the regression break.
I am considering this trade with limited risk allocated.

SBM Bullish to fill the gapTechnical Commentary – SBM (St Barbara Limited)
SBM has formed a textbook double bottom pattern, confirming a bullish reversal from prior downtrend conditions. The price action has since broken above neckline resistance and is now trending within a well-defined rising channel, supported by increasing volume and aligned moving averages.
The stock is currently targeting the next major supply zone around 44c, where a previous gap remains unfilled. The recent wave structure suggests a classic Elliott Wave impulse, with the current leg aiming for wave (5), coinciding with this resistance level.
Short-term momentum remains strong, with bullish alignment across the 20, 50, and 100-day moving averages. A break and close above 44c may signal a continuation toward higher resistance zones established in late 2023.
Key Levels:
Support: 33c–34c (previous resistance turned support)
Resistance: 44c (gap fill target)
Trend: Bullish above 30c

CYC REVERSAL IMMINENT Hey people,
looking at this as a complete pattern and reversals to the upside to be the next phase after this meta push to the downside
fyi im already in

Potential outside week and bullish potential for NEMEntry conditions:
(i) higher share price for ASX:NEM above the level of the potential outside week noted on 13th June (i.e.: above the level of $88.35).
Stop loss for the trade would be:
(i) below the low of the outside week on 11th June (i.e.: below $80.70), should the trade activate.

Bellevue Gold - chart indicates recovery after 30% dropHi, thanks for viewing.
I'm going to look deeper into Bellevue and position myself for a significant purchase. But won't be buying just yet.
So, some people see Elliot Wave as reading tea-leaves or goat entrails. But, it does help with market timing sometimes. It isnt everything. But, I find it helpful, especially when combined with 'coincident targets' using Elliot Wave, support and resistance, and RSI divergence.
If the correction is an "A-B-C" three wave correction, the third wave, wave C is often the same length as wave A.
RSI divergence, I look for three lower lows on the price chart, paired with three higher lows on the RSI the first two in the over-sold area and the third higher low fails to push into the over-sold RSI region / below 30. For these conditions, it appears one more drop seems warranted.
But would have to look into the fundamentals, because the gold price just had its highest weekly close. It is hard to see it going lower in this environment without major cost-overruns / profitability challenges / technical mining bottle-necks.
The red box denotes an area where I believe the Elliot wave rules have been breached. Normally Wave C would have five sub-waves. Wave (v) may unfold, but it looks to be the shortest of the three sub-waves if it reaches my blue box target. One EW rule is that wave (iii) may not be the shortest of the three, but it can be shorter than wave (i). In this bullish gold price environment, the 30% drop may not occur. Will have to look into it. For now, watching from the sideline. Good luck everyone.

$NRW gap to Fill, bullish, Head and Shoulder breaks neckline🔍 Current Technical Setup
Price: $2.92 AUD
Trend: Recent bullish reversal from lows near $2.00
Volume: Increasing volume on the uptrend — a bullish sign of accumulation.
Moving Averages:
Short-Term EMA (10): $2.82 — price is above = bullish.
EMA (50): $2.61 — price is also above = uptrend intact.
SMA (200): $3.25 — price below = long-term resistance remains.
🧠 Key Chart Patterns & Levels
Structure: Cup & Handle / Inverted Head and Shoulders-like bottom formation from the April–June base.
Breakout Zone: Just broke through minor resistance around $2.90 with strong volume.
Gap Fill Zone: Between $3.10–$3.30 (highlighted grey box). This is a key target area where price previously sold off — likely to act as resistance.
Major Resistance: The 200-day SMA at $3.25 aligns with the upper edge of the gap zone = high confluence resistance.
📈 Bullish Scenario (High Probability ~60–70%)
Price continues to rally on strong volume to test the gap resistance zone.
Target: $3.10 to $3.30 in the short term (5–15% upside).
A daily close above $3.30 would confirm a structural breakout toward previous highs near $3.80–$4.00 (medium-term target).
📉 Bearish Scenario (~30–40% Probability)
Price rejects off $2.90–$3.00 and retests support at the 50 EMA (~$2.60).
If it loses the $2.50 level again, the structure weakens and re-tests lows near $2.10–$2.20 become possible.
🎯 Trading Strategy & Risk
Entry zone (momentum): $2.85–$2.95 (already underway).
Short-term Target: $3.10–$3.30
Medium-term Target: $3.80
Stop loss: Below $2.70 (just under the 50 EMA and recent swing low).
Risk:Reward: About 1:2 or better toward the gap fill.
🧠 Summary
NRW (NWH) is showing a strong bullish reversal from a major base with increasing volume. The short-term structure supports a gap fill to $3.10–$3.30, with a medium-term potential back to $3.80 if it breaks the 200 SMA cleanly. However, resistance is expected near that region and caution is warranted around $3.25.
Would you like a trade plan or probability table next?

Bearish potential detected for NHCEntry conditions:
(i) lower share price for ASX:NHC along with swing of DMI indicator towards bearishness and RSI downwards, and
(ii) observing market reaction around the share price of $3.57 (open of 11th April).
Stop loss for the trade would be:
(i) above the high of the recent swing high once the trade is activated (currently $3.75 from the high of 19th May).

Bullish potential detected for DRREntry conditions:
(i) higher share price for ASX:DRR along with swing up of indicators such as DMI/RSI.
Depending on risk tolerance, the stop loss for the trade would be:
(i) a close below the 50 day moving average (currently $3.63), or
(ii) below previous support of $3.49 from the open of 14th March, or
(iii) below previous support of $3.34 from the open of 5th September.

another breakoutKCN has done well sinces the previous breakout
of a triangle formation.
The Weekly line chart closing at a new high shows bullish signals
for the price of KCN.
I expect it to slowly climb to the next target of 5.50
which is about 100% gain on this break.
Gold price will continue to rise as Wars need printed money.
