Finer Market Points: ASX Top 10 Momentum Stocks: 21 May 2025ASX:DTR GETTEX:VTM ASX:PEK ASX:BGD GETTEX:YOJ ASX:PUA TSX:XAM ASX:WA8 PSE:RLT ASX:MM1 Momentum leading shares are the market's best performers today. They are the fastest-growing shares on the ASX over the last 90 days. These companies can't get to be leaders without first appearing on our Launch Pad list. The Launch Pad List is shared on Thursdays and the video interview published after market close on Fridays. Today's ASX's Top 10 Quarterly Momentum Stocks are: Dateline Resources Limited (DTR) Victory Metals Limited (VTM) Peak Rare Earths Limited (PEK) Barton Gold Holdings Limited (BGD) Yojee Limited (YOJ) Peak Minerals Limited (PUA) Xanadu Mines Limited (XAM) Warriedar Resources Limited (WA8) Renergen Limited (RLT) Midas Minerals Limited (MM1)

Finer Market Points: ASX Top 10 Momentum Stocks: 20 May 2025ASX:DTR ASX:PEK GETTEX:VTM ASX:BGD TSX:XAM ASX:WA8 ASX:SYR $360 EURONEXT:EGR NYSE:NMT Momentum leading shares are the market's best performers today. They are the fastest-growing shares on the ASX over the last 90 days. These companies can't get to be leaders without first appearing on our Launch Pad list. The Launch Pad List is shared on Thursdays and the video interview published after market close on Fridays. Today's ASX's Top 10 Quarterly Momentum Stocks are: Dateline Resources Limited (DTR) Peak Rare Earths Limited (PEK) Victory Metals Limited (VTM) Barton Gold Holdings Limited (BGD) Xanadu Mines Limited (XAM) Warriedar Resources Limited (WA8) Syrah Resources Limited (SYR) Life360, Inc. (360) Ecograf Ltd (EGR) Neometals Ltd (NMT)
Finer Market Points: ASX Top 10 Momentum Stocks: 19 May 2025 CSE:DTR ASX:PEK GETTEX:VTM ASX:BGD ASX:WA8 AMEX:DES NYSE:WCN ASX:SYR TSX:XAM $360 Momentum leading shares are the market's best performers today. They are the fastest-growing shares on the ASX over the last 90 days. These companies can't get to be leaders without first appearing on our Launch Pad list. The Launch Pad List is shared on Thursdays and the video interview published after market close on Fridays. Today's ASX's Top 10 Quarterly Momentum Stocks are: Dateline Resources Limited (DTR) Peak Rare Earths Limited (PEK) Victory Metals Limited (VTM) Barton Gold Holdings Limited (BGD) Warriedar Resources Limited (WA8) DeSoto Resources Limited (DES) White Cliff Minerals Limited (WCN) Syrah Resources Limited (SYR) Xanadu Mines Limited (XAM) Life360, Inc. (360)

VTX bullish break out from bull fagVertex Minerals Limited (ASX: VTX) – Snapshot Summary
Business: Australian gold exploration company focused on the Hargraves and Hill End projects in Central West NSW.
Share Price: $0.255 (↑10.87%), with strong 1-year growth of +210.98%.
2025 YTD Performance: +22.89%
Market Cap: ~$49 million
Shares Outstanding: ~192.4 million
Valuation:
EPS: -$0.016 (loss-making)
Book Value/Share: $0.085
Dividend: None (DPS: $0.00)
Ranking:
ASX Rank: 1,188 of 2,322
Sector (Basic Materials): 350 of 1,047
Liquidity: Daily turnover ~$82.7K, average volume ~531K
Peers: S2R, MPK, TAM
Overall: Vertex is a small-cap gold explorer showing strong stock momentum, but remains pre-revenue with negative earnings.
Director Transactions
VTX directors must report any change in shareholding to the ASX within 5 business days.
See Director Transactions for all ASX companies.
Date Director Type Amount Price Value Notes
25/02/25 Mr Sean David Richardson Buy +80,000 $0.316 $25,300 On-market trade

$TER is BasingCash in hand, low soi, low mc, Exponential moving average, has hit up tick. Oversold.
All positives from here

Potential outside week and bullish potential for KCNEntry conditions:
(i) higher share price for ASX:KCN above the level of the potential outside week noted on 2nd May (i.e.: above the level of $1.825).
Stop loss for the trade would be:
(i) below the low of the outside week on 28th April (i.e.: below $1.54), should the trade activate.

IAG supply zonePrice arriving into supply zone.
will monitor from daily chart, h4/daily only
interested to see if 9.19 level will be reached ? or if any fake upside breaks?
and or how price behaves around highs.
short side catches my interest only if PA and structure builds right .
will wait for sellers to confirm their interest .
stick ya gambling pre mature entries up your insured asshoolee. ;)
naturally neutral stance will activate short position later on if price behaves.

Bullish potential detected for WOWEntry conditions:
(i) higher share price for ASX:WOW along with swing up of indicators such as DMI/RSI, and
(ii) observation of market reaction at the resistance level / volume profile area at $32.32 after closing above 200 day MA.
Stop loss for the trade would be, dependent on risk tolerance:
(i) a close below the 200 day moving average (currently $31.63), or
(ii) a close below the 50 day moving average (currently $30.17).

Trade Idea: QBE.AX – Breakout Swing SetupEntry Trigger:
🔹 Buy stop @ AUD 22.71 — breakout above recent highs with volume confirmation.
Thesis:
QBE has built a multi-week consolidation just under the key resistance level of 22.70–22.75. A breakout above this zone could trigger a bullish continuation, supported by improving capital metrics, analyst upgrades (Jefferies Buy @ $24.30), and rotation into defensive financials.
Fundamentals Snapshot:
• ROE: 16.6%
• Dividend Yield: ~3.9%
• Strong capital adequacy (PCA 1.86x)
• Recently posted +27% net profit growth in FY24
Technical Setup:
• Resistance: 22.70 (breakout level)
• Volume spike potential if breached
• MACD SL: 21.06 (use as technical invalidation zone)
Risk Management:
• 🛑 Stop Loss: 21.10 (below MACD SL + recent pivot)
• 🎯 Target: 24.50–25.00
• 📊 R-Multiple: Approx 1:2.5 to 1:3 depending on entry fill
DISCLAIMER : The content and materials featured are for your information and education only and are not attended to address your particular personal requirements. The information does not constitute financial advice or recommendation and should not be considered as such. Risk Management is Your Shield! Always prioritise risk management. It’s your best defence against losses.

Endeavour Group (EDV)
Has CoMS through resistance at 4.05.
Retesting resistance as support.
Enter trade at 4.20 with Stop Loss below 4.05.
Will give break of Trendline.
RSI
Bullish
Take Profit at 4.85 (Unless breaks supply zone on volume)
OBV
Needs to imporove to support the move up

Novonix (NVX)Inverted Head and Shoulders about to play out.
There is already a change of market structure with a Failure Swing.
Entry can be taken on a candle close at 0.550 with a measured move exit at 0.760 (assuming continued market structure.

Syrah Resources SYRSYR trend change after multi-year downtrend.
Broken out of Accumulation, waiting for confirmed CoMS (Confirmed change of Market Structure), giving us a Non-Failur Swing to the upside.
Currently overbought on RSI, looking for a correction for the CoMS pattern.

Finer Market Points: ASX Top 10 Momentum Stocks: 14 May 2025 CSE:DTR ASX:PUA ASX:FHE GETTEX:VTM LSE:KNB ASX:WA8 ASX:BGD NYSE:WCN ASX:SYR NYSE:STK Momentum leading shares are the market's best performers today. They are the fastest-growing shares on the ASX over the last 90 days. These companies can't get to be leaders without first appearing on our Launch Pad list. The Launch Pad List is shared on Thursdays and the video interview published after market close on Fridays. Today's ASX's Top 10 Quarterly Momentum Stocks are: Dateline Resources Limited (DTR) Peak Minerals Limited (PUA) Frontier Energy Limited (FHE) Victory Metals Limited (VTM) Koonenberry Gold Limited (KNB) Warriedar Resources Limited (WA8) Barton Gold Holdings Limited (BGD) White Cliff Minerals Limited (WCN) Syrah Resources Limited (SYR) Strickland Metals Limited (STK)

Trade Idea: ASX:CPU – Long Setup
✅ Technical Setup
• Entry: $40.60
• Stop: $37.80
• Target Zone: $44.80 – $47.00
• R:R Ratio: ~2:1 to 3:1
📊 Chart Notes:
• Price has broken out above 50-day MA, signaling momentum shift
• Formed a solid base between $38–$40 — now showing early signs of trend continuation
• Volume picking up on up-days = accumulation
📉 Key Levels
• Support: $38.00 (base of consolidation)
• Resistance: $44.80, then $47.00 (Nov–Jan highs)
🔍 Fundamental Backing
• Strong balance sheet with stable earnings growth
• Interest-rate sensitive model benefits from elevated global rates
• Global registry and mortgage processing exposure = defensive + cashflow-positive
📌 Summary
CPU shaping up for a post-consolidation breakout backed by both technicals and fundamentals.
Solid R:R with support at recent range lows. Risk managed at $37.80.
DISCLAIMER : The content and materials featured are for your information and education only and are not attended to address your particular personal requirements. The information does not constitute financial advice or recommendation and should not be considered as such. Risk Management is Your Shield! Always prioritise risk management. It’s your best defence against losses.

Finer Market Points: ASX Top 10 Momentum Stocks: 13 May 2025CSE:DTR ASX:VRX ASX:PUA LSE:KNB GETTEX:VTM AMEX:DES NYSE:WCN ASX:WA8 ASX:BGD ASX:SYR Momentum leading shares are the market's best performers today. They are the fastest-growing shares on the ASX over the last 90 days. These companies can't get to be leaders without first appearing on our Launch Pad list. The Launch Pad List is shared on Thursdays and the video interview published after market close on Fridays. Today's ASX's Top 10 Quarterly Momentum Stocks are: Dateline Resources Limited (DTR) VRX Silica Limited (VRX) Peak Minerals Limited (PUA) Koonenberry Gold Limited (KNB) Victory Metals Limited (VTM) DeSoto Resources Limited (DES) White Cliff Minerals Limited (WCN) Warriedar Resources Limited (WA8) Barton Gold Holdings Limited (BGD) Syrah Resources Limited (SYR)

Finer Market Points: ASX Top 10 Momentum Stocks: 12 May 2025CSE:DTR NASDAQ:ADN NYSE:WCN LSE:KNB AMEX:DES ASX:VRX GETTEX:VTM ASX:FHE ASX:WA8 NYSE:NMR Momentum leading shares are the market's best performers today. They are the fastest-growing shares on the ASX over the last 90 days. These companies can't get to be leaders without first appearing on our Launch Pad list. The Launch Pad List is shared on Thursdays and the video interview published after market close on Fridays. Today's ASX's Top 10 Quarterly Momentum Stocks are: Dateline Resources Limited (DTR) Andromeda Metals Limited (ADN) White Cliff Minerals Limited (WCN) Koonenberry Gold Limited (KNB) DeSoto Resources Limited (DES) VRX Silica Limited (VRX) Victory Metals Limited (VTM) Frontier Energy Limited (FHE) Warriedar Resources Limited (WA8) Native Mineral Resources Holdings Limited (NMR)

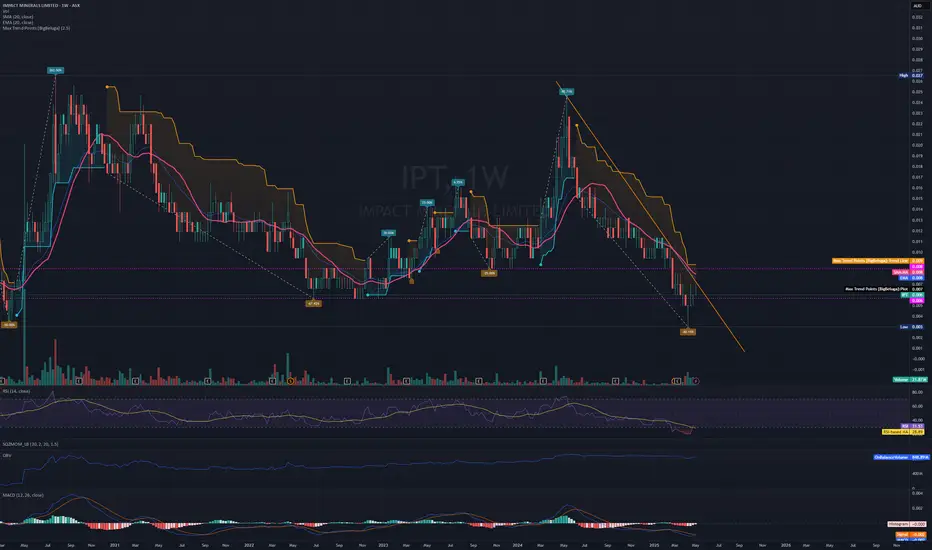
$IPT neutral Impact Minerals Limited (IPT) Summary:
Impact Minerals Limited (ASX: IPT) is an exploration company with a 5,229 km² portfolio of tenements, focused on unlocking Australia's mineral potential. Its flagship Lake Hope High Purity Alumina (HPA) Project in Western Australia aims to revolutionize HPA production using cost-efficient mining and innovative acid leaching.
Market Snapshot:
Share Price: $0.006 (unchanged)
Market Cap: ~$22.2M
Shares Issued: ~3.7B
Sector: Basic Materials
EPS: -$0.002 | DPS: $0.00 | Book Value/Share: $0.004
Performance: +50% (1M), -36.5% (YTD), -71.1% (1Y)
Not covered by major brokers.
$SVL $SVL.ax Long Silver is back in the spotlight. After gaining more than 40% over the past 12 months and trading above $34 an ounce, silver is again the focus of a coordinated grassroots movement – this time dubbed “Silver Squeeze 2.0.”

Bullish potential detected for MTSEntry conditions:
(i) higher share price for ASX:MTS along with swing up of indicators such as DMI/RSI.
Stop loss for the trade would be:
(i) below the recent swing low of 6th May (i.e.: below $3.21), or
(ii) a close below the 50 day moving average (currently $3.16), or
(ii) below the support level from the open of 11th April (i.e.: below $3.12), depending on risk tolerance.

$AGL $AGL.ax Bullish Continuation AGL Energy (ASX: AGL) – Snapshot
Industry: Utilities (Energy supply & services)
Focus: Decarbonisation & electrification
Share Price (09/05): $11.05 | Market Cap: $7.43B
Volume: 1.26M (4-wk avg: 1.75M)
1-Year Return: +6.76% (slight outperformance)
Key Financials: EPS $0.344 | DPS $0.58 | BV/Share $7.83 | Shares: ~672.7M
Ranking: ASX #76 | Sector #5
Broker Consensus: Buy (3 Buy · 4 Hold · 0 Sell)
Bullish Continuation. OBV rising, ASX Utilities index Breaking out, Low RSI. Good buying levels.

$GNE $GNE.ax Forming a bullish continuationGenesis Energy (ASX: GNE) – Snapshot Summary
Industry: Utilities (Energy Retail & Generation – NZ)
Customers: 490,000+
Energy Sources: Thermal & renewable
Retail Brands: Genesis, Frank
Share Info (as of 09/05):
Price: $2.10
Market Cap: $2.31B
Volume: 17,975 (4-week avg: 44,884)
1-Year Return: +2.94% (Underperformed sector & ASX 200)
Key Financials:
EPS:$0.122
DPS: $0.1276
Book Value/Share: $2.494
Shares Outstanding: ~1.1B
ASX Rank: 194 / 2,324
Sector Rank: 9 / 30
Broker Coverage: Not covered by major brokers.
Trend:
Looks bullish continuation. RSI rising. OBV is low. Sector Utilities is breaking out of consolidation

$APA.ax $APA Longer term Bull RunAPA is extended and about to hit a key FIB level. RSI is overbought. ASX Utilities Index is breaking out of long term Consolidation. Pull back to lower Fib level before resumption of trend.

Finer Market Points: ASX Top 10 Momentum Stocks: 9 May 2025CSE:DTR NYSE:WCN ASX:WA8 ASX:AZL LSE:KNB NYSE:NMR TSX:DXB NYSE:SMP AMEX:DES ASX:MTM Momentum leading shares are the market's best performers today. They are the fastest-growing shares on the ASX over the last 90 days. These companies can't get to be leaders without first appearing on our Launch Pad list. The Launch Pad List is shared on Thursdays and the video interview published after market close on Fridays. Today's ASX's Top 10 Quarterly Momentum Stocks are: Dateline Resources Limited (DTR) White Cliff Minerals Limited (WCN) Warriedar Resources Limited (WA8) Arizona Lithium Limited (AZL) Koonenberry Gold Limited (KNB) Native Mineral Resources Holdings Limited (NMR) Dimerix Limited (DXB) Smartpay Holdings Limited (SMP) DeSoto Resources Limited (DES) MTM Critical Metals Limited (MTM)
