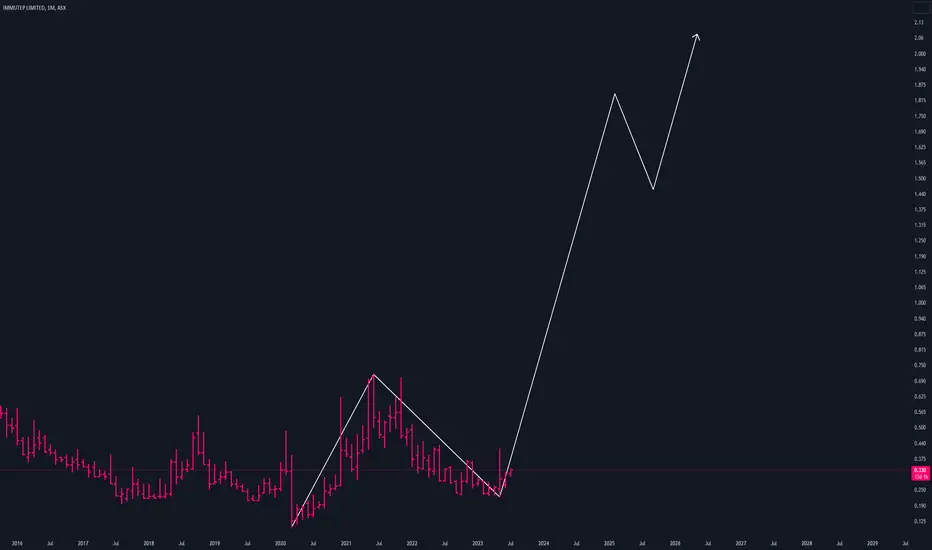
RNU Forecast for both Long and Short potentialsRNU has now potentially produced a bullish pattern if price doesn't break 0.17
Expecting resistance and reversal at 78.6 - 88.6 fib levels if bullish
Otherwise we are highly likely to break the Bottom of 0.13 which will complete Regular Flat Pattern on the larger Time-frame

ASX Top 10 Momentum Stocks: 24 July 2023 - Finer Market PointsASX:MGU ASX:LDX ASX:WC8 NYSE:IDA ASX:AZS TSX:MVP ASX:PV1 ASX:MP1 ASX:LPD TSX:ERD
Momentum leading shares are the market's best performers today. They are the fastest-growing shares on the ASX over the last 90 days. These companies can't get to be leaders without first appearing on our Launch Pad list.
Today's ASX's Top 10 Quarterly Momentum Stocks are:
Magnum Mining & Exploration (MGU): Magnum Mining & Exploration is a miner in IUS, Nevada, and West Virginia. They focus on iron ore concentrate and green pig iron production, aiming to serve steelmakers in the West Coast and Ohio River Valley areas.
Lumos Diagnostics (LDX): Lumos Diagnostics engages in the development and manufacture of point-of-care (POC) diagnostics solutions to help healthcare professionals more accurately diagnose and manage medical conditions.
Wildcat Resources (WC8): Wildcat Resources is a WA and NSW Gold explorer with exposure to Lithium, Caesium, Tantalum, Nickel, and Copper as well.
Indiana Resources (IDA): Indiana Resources is a miner focusing on Rare Earths, Gold, and other base metals in both SA and Tanzania.
Azure Minerals (AZS): Azure Minerals is a mining company that explores and develops mineral deposits, with a focus on precious and base metals.
Medical Developments (MVP): Medical Developments manufactures and distributes pharmaceutical drugs, medical equipment, and veterinary equipment. They sell Penthrox drugs in the Pharmaceuticals segment and medical devices and veterinary products in Australia, Europe, and Asia.
Provaris Energy Ltd (PV1): Provaris Energy Ltd is an oil and gas explorer working in the hydrogen markets, developing green hydrogen projects for export through compressed hydrogen. They have recently worked on hydrogen storage and marine carriers from Norway into Europe, addressing supply chain constraints.
Megaport Limited (MP1): Megaport Limited provides elastic interconnection services that enable enterprises to connect to cloud service providers.
Lepidico Ltd (LPD): Lepidico Ltd is a vertically integrated open-pit, brown-field lithium miner with projects in Namibia. Using conventional flotation technology before applying their patented conversion processes in the UAE, LPD then exports lithium hydroxide to their offtake partner Traxys.
Eroad Limited (ERD): Eroad Limited provides telematics and fleet management solutions.

Novonix limited- wait and see case💎The price has come to a confluence of a trend line with the fib ratio of 0.618. The only wait is for some kind of bullish candle.
💎 The downward trend is the correction of a larger degree of wave 1. wave 2 could go further down.
🚩30ma has act as a downward trendline showing a bearish scenario if the price breaks the trendline.

$AGL NYSE:AGL running hot into an area of resistance, everyone getting horney. Almost 6 months without any pullbacks....
#gas

CCP is making a bullish patternCCP has formed a base and trading range the last few months. Earnings have been robust though below analyst estimates last few quarters. Earnings will be out on 1st August and could be a catalyst for the stock to move higher.
Current Technical resistance is at 24.5 and stock is trading closer to the resistance range. Watch for a good result and stock could move to 32 as the next immediate level. Given the nature of the scrip you can expect a ballistic move if there are good numbers on topline/bottomline.

BCB CoalPSE:BCB watching waiting ,,,,,,,,,, #Coal #energy #bowen
If this do this,, if not done sweet fa
Chart explains level im interested in, alerts set. If we re-claim looking for an entry on swing trade.

ASX Top 10 Momentum Stocks: 21 July 2023 - Finer Market PointsASX:MGU TSX:MVP ASX:PV1 ASX:AW1 NASDAQ:LNW ASX:LDX ASX:AZS NYSE:IDA ASX:MP1 ASX:LRS
Momentum leading shares are the market's best performers today. They are the fastest-growing shares on the ASX over the last 90 days. These companies can't get to be leaders without first appearing on our Launch Pad list.
Today's ASX's Top 10 Quarterly Momentum Stocks are:
Magnum Mining & Exploration (MGU): Magnum Mining & Exploration is a miner in IUS, Nevada, and West Virginia. They focus on iron ore concentrate and green pig iron production, aiming to serve steelmakers in the West Coast and Ohio River Valley areas.
Medical Developments (MVP): Medical Developments manufactures and distributes pharmaceutical drugs, medical equipment, and veterinary equipment. They sell Penthrox drugs in the Pharmaceuticals segment and medical devices and veterinary products in Australia, Europe, and Asia.
Provaris Energy Ltd (PV1): Provaris Energy Ltd is an oil and gas explorer working in the hydrogen markets, developing green hydrogen projects for export through compressed hydrogen. They have recently worked on hydrogen storage and marine carriers from Norway into Europe, addressing supply chain constraints.
American West Metals Limited (AW1): American West Metals Limited is a copper-focused miner in North America. They have the Storm Copper Project in Nunavut, Canada, and the zinc-copper-indium deposit at West Desert and Copper Warrior Project in Utah, USA.
Light & Wonder Inc. (LNW):
Lumos Diagnostics (LDX): Lumos Diagnostics engages in the development and manufacture of point-of-care (POC) diagnostics solutions to help healthcare professionals more accurately diagnose and manage medical conditions.
Azure Minerals (AZS): Azure Minerals is a mining company that explores and develops mineral deposits, with a focus on precious and base metals.
Indiana Resources (IDA): Indiana Resources is a miner focusing on Rare Earths, Gold, and other base metals in both SA and Tanzania.
Megaport Limited (MP1): Megaport Limited provides elastic interconnection services that enable enterprises to connect to cloud service providers.
Latin Resources Ltd (LRS): Latin Resources Ltd is an Australian-based mineral exploration company with a focus on lithium, copper, gold, and other base metals.

$SLC 0.655 BUEC, ready for the real move This is a really good looking chart, any move out should be pretty explosive given how long its been grinding along and the fact theres only 50M SOI
Holding from 655

ASX Top 10 Momentum Stocks: 20 July 2023 - Finer Market PointsASX:MGU TSX:MVP ASX:PV1 ASX:AW1 NASDAQ:LNW ASX:LDX ASX:AZS NYSE:IDA ASX:MP1 ASX:LRS
Momentum leading shares are the market's best performers today. They are the fastest-growing shares on the ASX over the last 90 days. These companies can't get to be leaders without first appearing on our Launch Pad list.
Today's ASX's Top 10 Quarterly Momentum Stocks are:
Magnum Mining & Exploration (MGU): Magnum Mining & Exploration is a miner in IUS, Nevada, and West Virginia. They focus on iron ore concentrate and green pig iron production, aiming to serve steelmakers in the West Coast and Ohio River Valley areas.
Medical Developments (MVP): Medical Developments manufactures and distributes pharmaceutical drugs, medical equipment, and veterinary equipment. They sell Penthrox drugs in the Pharmaceuticals segment and medical devices and veterinary products in Australia, Europe, and Asia.
Provaris Energy Ltd (PV1): Provaris Energy Ltd is an oil and gas explorer working in the hydrogen markets, developing green hydrogen projects for export through compressed hydrogen. They have recently worked on hydrogen storage and marine carriers from Norway into Europe, addressing supply chain constraints.
American West Metals Limited (AW1): American West Metals Limited is a copper-focused miner in North America. They have the Storm Copper Project in Nunavut, Canada, and the zinc-copper-indium deposit at West Desert and Copper Warrior Project in Utah, USA.
Light & Wonder Inc. (LNW):
Lumos Diagnostics (LDX): Lumos Diagnostics engages in the development and manufacture of point-of-care (POC) diagnostics solutions to help healthcare professionals more accurately diagnose and manage medical conditions.
Azure Minerals (AZS): Azure Minerals is a mining company that explores and develops mineral deposits, with a focus on precious and base metals.
Indiana Resources (IDA):
Megaport Limited (MP1): Megaport Limited provides elastic interconnection services that enable enterprises to connect to cloud service providers.
Latin Resources Ltd (LRS): Latin Resources Ltd is an Australian-based mineral exploration company with a focus on lithium, copper, gold, and other base metals.

ASX Top 10 Momentum Stocks: 19 July 2023 - Finer Market PointsFWB:SOV ASX:MGU ASX:LDX ASX:PV1 ASX:AZS ASX:AW1 ASX:LRS ASX:MP1 ASX:TGM NYSE:ARL
Momentum leading shares are the market's best performers today. They are the fastest-growing shares on the ASX over the last 90 days. These companies can't get to be leaders without first appearing on our Launch Pad list.
Today's ASX's Top 10 Quarterly Momentum Stocks are:
Sovereign Cloud Holdings (SOV): Sovereign Cloud Holdings provides cloud-based infrastructure as a service. They offer official and protected data community environments and storage and back-up systems for the Australian government, Australian Defence Force, and critical national industry communities.
Magnum Mining & Exploration (MGU): Magnum Mining & Exploration is a miner in IUS, Nevada, and West Virginia. They focus on iron ore concentrate and green pig iron production, aiming to serve steelmakers in the West Coast and Ohio River Valley areas.
Lumos Diagnostics (LDX): Lumos Diagnostics engages in the development and manufacture of point-of-care (POC) diagnostics solutions to help healthcare professionals more accurately diagnose and manage medical conditions.
Provaris Energy Ltd (PV1): Provaris Energy Ltd is an oil and gas explorer working in the hydrogen markets, developing green hydrogen projects for export through compressed hydrogen. They have recently worked on hydrogen storage and marine carriers from Norway into Europe, addressing supply chain constraints.
Azure Minerals (AZS): Azure Minerals is a mining company that explores and develops mineral deposits, with a focus on precious and base metals.
Americanwestmetals (AW1):
Latin Resources Ltd (LRS): Latin Resources Ltd is an Australian-based mineral exploration company with a focus on lithium, copper, gold, and other base metals.
Megaport Limited (MP1): Megaport Limited provides elastic interconnection services that enable enterprises to connect to cloud service providers.
Theta Gold Mines Ltd (TGM):
Ardea Resources Ltd (ARL): Ardea Resources Ltd is a mineral exploration and development company focused on nickel, cobalt, and gold projects in Western Australia.


Reversal?Chart looks like the bottom is in and in the process of reversing...probably a multi year swing if this ends up cracking the last peak at $4.10
ASX Top 10 Momentum Stocks: 18 July 2023 - Finer Market PointsFWB:NOU NYSE:ARL ASX:PV1 ASX:AZS TSX:MVP NYSE:EOS NYSE:TNC ASX:MP1 ASX:LRS ASX:COB
Momentum leading shares are the market's best performers today. They are the fastest-growing shares on the ASX over the last 90 days. These companies can't get to be leaders without first appearing on our Launch Pad list.
Today's ASX's Top 10 Quarterly Momentum Stocks are:
Noumi Limited (NOU): Noumi Limited manufactures and sells food products in the Dairy and Plant Based Beverages segments. They offer dairy milk beverages, nutritional products, performance and adult nutritional powders, as well as plant-based products with names like MilkLab, Australia's Own, So Natural, and more.
Ardea Resources Ltd (ARL): Ardea Resources Ltd is a mineral exploration and development company focused on nickel, cobalt, and gold projects in Western Australia.
Provaris Energy Ltd (PV1): Provaris Energy Ltd is an oil and gas explorer working in the hydrogen markets, developing green hydrogen projects for export through compressed hydrogen. They have recently worked on hydrogen storage and marine carriers from Norway into Europe, addressing supply chain constraints.
Azure Minerals (AZS): Azure Minerals is a mining company that explores and develops mineral deposits, with a focus on precious and base metals.
Medical Developments (MVP): Medical Developments manufactures and distributes pharmaceutical drugs, medical equipment, and veterinary equipment. They sell Penthrox drugs in the Pharmaceuticals segment and offer medical devices and veterinary products in Australia, Europe, and Asia.
Electro Optic Systems Holdings Ltd. (EOS): Electro Optic Systems Holdings Ltd. creates advanced electro-optic technologies for the aerospace market. They specialize in software, lasers, electronics, optics, gimbals, telescopes, beam directors, optical coatings, and precision mechanisms. EOS operates in the Communication Systems, Defence Systems, and Space segments, providing microwave and on-the-move radio and satellite products, advanced fire control, surveillance and weapon systems to approved military customers. They are also involved in surveillance systems in the Space segment.
True North Copper (TNC): True North Copper is a copper and cobalt focused mining explorer in Queensland, Cloncurry, and Mt Oxide.
Megaport Limited (MP1): Megaport Limited provides elastic interconnection services that enable enterprises to connect to cloud service providers.
Latin Resources Ltd (LRS): Latin Resources Ltd is an Australian-based mineral exploration company with a focus on lithium, copper, gold, and other base metals.
Cobalt Blue Ltd (COB): Cobalt Blue Ltd focuses on cobalt mining and refining operations, with a technology to extract cobalt from pyrite and other host minerals.

ASX Top 10 Momentum Stocks: 17 July 2023 - Finer Market PointsFWB:NOU ASX:LDX NYSE:ARL TSX:MVP ASX:AZS NASDAQ:LNW ASX:COB TSX:ERD ASX:MGU AMEX:EPM
Momentum leading shares are the market's best performers today. They are the fastest-growing shares on the ASX over the last 90 days. These companies can't get to be leaders without first appearing on our Launch Pad list.
Today's ASX's Top 10 Quarterly Momentum Stocks are:
Noumi Limited (NOU): Noumi Limited manufactures and sells food products in the Dairy and Plant Based Beverages segments. They offer dairy milk beverages, nutritional products, performance and adult nutritional powders, as well as plant-based products under various brand names.
Lumos Diagnostics (LDX): Lumos Diagnostics is a company that develops and manufactures rapid diagnostic tests for various medical conditions.
Ardea Resources Ltd (ARL): Ardea Resources Ltd is a mineral exploration and development company focused on nickel, cobalt, and gold projects in Western Australia.
Medical Developments (MVP):
Azure Minerals (AZS): Azure Minerals is a mining company that explores and develops mineral deposits, with a focus on precious and base metals.
Light & Wonder Inc. (LNW):
Cobalt Blue Ltd (COB): Cobalt Blue Ltd is a company that focuses on the development and commercialization of cobalt deposits.
Eroad Limited (ERD): Eroad Limited provides telematics and fleet management solutions.
Magnum Mining & Exploration (MGU): Magnum Mining & Exploration is a company engaged in the exploration and development of mineral resources.
Eclipse Metals (EPM): Eclipse Metals is an exploring miner with projects in South-western Greenland, NT, and QLD covering cryolite, rare earths, manganese, uranium, gold, vanadium, high purity quartz, fluorite, iron, and zinc.

going long on A2Mgood pull back into OB, going long from there. A2M is in a pretty good position in the asian markets, and milk is primarily not affected when it comes to formula which they also produce in very high quality.

$RNU long (short to medium term trade)ASX:RNU moving above the trend line. A pull back to the 0.5 or 0 .618 fib (19 to 19.5c) represents good value. This would create a bullish running flat.
BAM update is imminent and could be a catalyst to a move up to the mid 20c or 30c mark. RNU are also presenting in the Noosa Mining Conference 2023. Lots of potentially bullish news in the next few weeks but the one to watch is the BAM announcement.

ASX Top 10 Momentum Stocks: 14 July 2023 - Finer Market PointsASX:GMN NYSE:ARL NYSE:TNC NYSE:DTC TSX:MVP ASX:COB AMEX:EMC TSX:ERD ASX:PV1 NYSE:ICL
Momentum leading shares are the market's best performers today. They are the fastest-growing shares on the ASX over the last 90 days. These companies can't get to be leaders without first appearing on our Launch Pad list.
Today's ASX's Top 10 Quarterly Momentum Stocks are:
Gold Mountain Ltd (GMN): Gold Mountain Ltd is a copper-gold-molybdenum miner exploring deposits in the Papuan Mobile Belt (PMB) in Papua New Guinea and lithium deposits in Lithium Valley in Brazil.
Ardea Resources Ltd (ARL): Ardea Resources Ltd is a mineral exploration and development company focused on nickel, cobalt, and gold projects in Western Australia.
True North Copper (TNC): True North Copper is a copper and cobalt focused mining explorer in Queensland, Cloncurry, and Mt Oxide.
Damstra Holdings (DTC): Damstra Holdings provides workplace management solutions through integrated hardware and software-as-a-service (SaaS) solutions.
Medical Developments (MVP): Medical Developments manufactures and distributes pharmaceutical drugs, medical equipment, and veterinary equipment. MVP sells Penthrox drugs in the Pharmaceuticals segment and medical devices and veterinary products in Australia, Europe, and Asia.
Cobalt Blue Ltd (COB): Cobalt Blue Ltd focuses on cobalt mining and refining operations, with a technology to extract cobalt from pyrite and other host minerals.
Everest Metals Corp (EMC): Everest Metals Corporation Limited is focused on advancing mining projects in Western Australia. They primarily target precious metals, lithium, and base metals from their mine sites.
Eroad Limited (ERD): Eroad Limited provides telematics and fleet management solutions.
Provaris Energy Ltd (PV1)
Iceni Gold (ICL)

Scam It...I think Rare Earths have bottomed out and we're early stages of a trend reversal - Expecting lot's of $ to be thrown at Rare Earth companies from the Gov to help get these mines into production as the shift away from reliance on China, China's made in China 2025 will have lot's of countries scrambling to have their own infrastructure built out to support the green energy future - which should be a net positive for lot's of mining companies on the exploration and producer side.

$BRN popping a 2B setup. clear 37 on volumeBeen dangling this trade for a while. Finally looks ready with volume today, but lacking tracking. tight stops etc.
I would put a link in to explain what a 2B is but some overzealous gate keeper migh block it. If you don't know google it OK?

$ORG - rotation looks to be happening on cue.Moves into energy names. ths thing has broken a 16 year down trend and based. 8.95 close above and we will be looking at a bit of Buzz Lightyear.....

AMI is fibonacciAMI following the laws of fibonacci well.
price at the lower band of the channel.
buy the support and hold on.
risk a small position for big gains.
we're all speculators now.
their is no REAL yield anymore.

ASX Top 10 Momentum Stocks: 13 July 2023 - Finer Market PointsNYSE:ARL AMEX:EMC ASX:AW1 NASDAQ:SLM NYSE:TNC NYSE:KAI ASX:IBX ASX:WC8 ASX:AZS ASX:MP1
Momentum leading shares are the market's best performers today. They are the fastest-growing shares on the ASX over the last 90 days. These companies can't get to be leaders without first appearing on our Launch Pad list.
Today's ASX's Top 10 Quarterly Momentum Stocks are:
Ardea Resources Ltd (ARL): Ardea Resources Ltd is a mineral exploration and development company focused on nickel, cobalt, and gold projects in Western Australia.
Everest Metals Corp (EMC): Everest Metals Corporation Limited is focused on advancing mining projects in Western Australia. They primarily target precious metals, lithium, and base metals from their mine sites.
American West Metals Limited (AW1): American West Metals Limited is a copper-focused miner in North America. They have the Storm Copper Project in Nunavut, Canada, and the zinc-copper-indium deposit at West Desert and Copper Warrior Project in Utah, USA.
Solismineralsltd (SLM): Solismineralsltd is a Latin American battery metals focused mining exploration company.
True North Copper (TNC): True North Copper is a copper and cobalt focused mining explorer in Queensland, Cloncurry, and Mt Oxide.
Kairos Minerals Ltd (KAI): Kairos Minerals Ltd is an exploration and development company focused on gold and nickel-copper sulfide projects in Western Australia.
Imagion Biosys Ltd (IBX): Imagion Biosys Ltd is a company that focuses on the development of non-invasive imaging solutions for cancer detection.
Wildcat Resources (WC8): Wildcat Resources is a WA and NSW gold explorer with exposure to lithium, caesium, tantalum, nickel, and copper.
Azure Minerals (AZS): Azure Minerals is a mining company that explores and develops mineral deposits, with a focus on precious and base metals.
Megaport Limited (MP1): Megaport Limited provides elastic interconnection services that enable customers to connect to over 700 data centers worldwide.

buy SBM @ the lower boundSBM looks bad. sentiment is bad.
price is bad. buy the support level which is close.
10-20 cents is a good buying area. speculate on this on
and hope it doesnt end up like BDR, TRY or X64.
we need the gold price to move higher to lift
all these gold miners. when the price of gold rockets
higher even the lowly cruddy gold miner will rise too
