Australian Silica Sand StocksComparing 5 Australian high-purity silica sand stocks: Metallica Minerals Ltd., Diatreme Resources Ltd., VRX Silica Ltd., Industrial Minerals Ltd., Australian Silica Quartz Group Ltd.

Shoot up ready !!!Hey hey everyone, asx here, I found this share interesting as we will see a good fundamental numbers in next couple of years so and downward risk is high but highly profitable it it starts going up. Please leave me youridea.
Thanks

BreakoutI believe this stock done a beautiful breakout at 0.41 so plenty of time to enter the market for a good return. Please leave your idea for me. Thanks everyone for reading

More Moving Averages for ScreenersAdd more Moving averages to the screener to enable a more robust screening process for traders. This would be for weekly and Daily charts as the 200MA daily would be a 40MA on a weekly chart and that option doesnt exist, there is also no 150MA for Daily charts but there is the 30MA that can be used for weekly

WGX rebuy at support 1.25Has had a decent run but it may fall into low volume to retest 1.20, then possibly back to 1.50

LongNot an advise, but learning; On the monthly chart I could see a potential for an uptrend and just thought it could be a strong support price area so after all I hope i will get a good return :)
Please share your idea with me.
Thanks all

Holding Value area possible fallWesfarmers broke the trend so if back at $49 sellers may push it down, i'm thinking to buy it at $46

Pitchfork supportfollowing trend support ay $14 and then run to $16 by end of year (maybe), if it falls down to 13.59 the trend is done

Holding support to retest highsFinancial look OK so think it should hold 2.70 and if so it will run to $3.30 ish

(ASX: $SPQ)
ASX:SPQ Potential move to Z2 (Zone 2), due to increasing bullish volume, interest from retail, and organisational bodies.
I don't think we'll see major moves in share price until we get some interesting market news.
Top 20 Holders have remained the same over the last 2 years, current price reduction represents retail investors cutting losses. Despite having positive market news in April, sophisticated investors did offload some of their shares, not for a huge profit, but in order to buy back in at a lower price.
ASX:SPQ Recently raised $4M AUD to proceed with further drilling and exploration projects. Options have been released with an execution price of 0.06c before Nov 24.
This can be viewed positively, as the company is confident in its short to medium term capability, and is expecting to please investors.
The top 20 Holders own roughly 31% of market share, considering they have remained the same over the last 2 years, we can be confident that they aren't going to dump huge volume on us retail investors.
We can use the RSI to visualise how the institutions are maintaining a level of support at this key level, hopefully pulling us out of this 3 stage downtrend.
I'll try and update this Idea as we get more information from the company in this exciting time!

wyckoff looking setupSeems to be showing relative strength to the overall market. Seems to be coming out of a spring kinda action, getting tight on the weekly. Might go, might not go, tough market for breakouts though, we'll see.

COH - ASX short on retest of range COH has broken down from its range, so look too short any retest. Invalidation if it can hold above first major fib resistance.

DYLLooking For run into the Mid range into blue box,
Resistance turned into support and also a macro Swing Low Sweep which adds confluence.

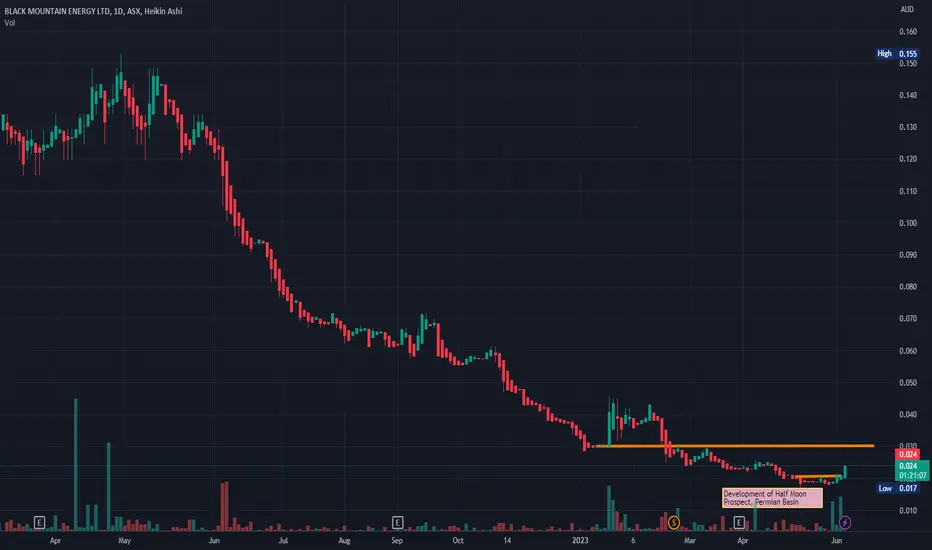
$BME.AX #BME.AX BME.AX - look for confirmation around 3c #HOLD Oil & Gas Exploration & Production - energy and resources company
Developing prospects, drilling in June and production in 90 days
This has come 4 months after acquisition
Project to cost around US$12.3 million
Volume and price up after a disastrous IPO
Should turnaround but look for plenty of supply as it grinds its way up
First target is 3c
ASX: SPQ - 100% in 18 Months!(ASX: SPQ) Superior Resources Limited is an Australia-based mineral exploration company. The Company's principal activities include exploration of lead-zinc-silver, copper, gold and nickel-copper-cobalt-platinum group elements (PGE) deposits in northern Queensland.
The company also owns interest in the projects of Deep Yellow Limited.
SPQ Recently raised $4 Million AUD via a share placement, where "sophisticated" investors where given the opportunity to purchase shares at a value of $0.03 per share. For every standard share purchased, the investor we're given 1 option with a strike price of $0.06, expiring 18 months from now.
The lead manger for the prospectus is Whario Capital, which seems to be a very lucrative investment firm, who is a corporate authorised representative of Redleaf Securities.
A number of shady individuals have been given access to this opportunity, one of whom has been charged and fined for dishonest conduct on the ASX.
A number of these holders are either running small investment firms in order to purchase these securities, or they're doing it under there name.
This "Idea" isn't based on the companies financials, the company itself seems extremely dodgy, because this isn't their first time offering options to select individuals.
They claim that the $4 Million raise is to fund their existing projects and to hopefully propel them into stage 2 of a number of their projects.
Their is a huge opportunity for retail investors to do their own research on this company, and potentially follow the smart money to a somewhat healthy return.

Breakout to SellThe stock just completed and broke out of wave 4 ending diagonal. I'm waiting for a break and retest of a potential bearish flag.
