MT: Buying the Dip ArcelorMittal - Short Term - We look to Buy at 29.48 (stop at 27.95)
Preferred trade is to buy on dips. Previous resistance at 30.00 now becomes support. We have a 38.2% Fibonacci pullback level of 29.24 from 23.12 to 33.02. The bias is still for higher levels and we look for any dips to be limited. Risk/Reward would be poor to call a buy from current levels.
Our profit targets will be 33.01 and 34.40
Resistance: 33.00 / 35.00 / 37.00
Support: 30.00 / 28.00 / 25.00
Disclaimer – Saxo Bank Group. Please be reminded – you alone are responsible for your trading – both gains and losses. There is a very high degree of risk involved in trading. The technical analysis, like any and all indicators, strategies, columns, articles and other features accessible on/though this site (including those from Signal Centre) are for informational purposes only and should not be construed as investment advice by you. Such technical analysis are believed to be obtained from sources believed to be reliable, but not warrant their respective completeness or accuracy, or warrant any results from the use of the information. Your use of the technical analysis, as would also your use of any and all mentioned indicators, strategies, columns, articles and all other features, is entirely at your own risk and it is your sole responsibility to evaluate the accuracy, completeness and usefulness (including suitability) of the information. You should assess the risk of any trade with your financial adviser and make your own independent decision(s) regarding any tradable products which may be the subject matter of the technical analysis or any of the said indicators, strategies, columns, articles and all other features.
Please also be reminded that if despite the above, any of the said technical analysis (or any of the said indicators, strategies, columns, articles and other features accessible on/through this site) is found to be advisory or a recommendation; and not merely informational in nature, the same is in any event provided with the intention of being for general circulation and availability only. As such it is not intended to and does not form part of any offer or recommendation directed at you specifically, or have any regard to the investment objectives, financial situation or needs of yourself or any other specific person. Before committing to a trade or investment therefore, please seek advice from a financial or other professional adviser regarding the suitability of the product for you and (where available) read the relevant product offer/description documents, including the risk disclosures. If you do not wish to seek such financial advice, please still exercise your mind and consider carefully whether the product is suitable for you because you alone remain responsible for your trading – both gains and losses.

Alfen Alfen broke out of a symmetrical triangle with a target to the downside leading to 56.3 euro. The 1.272 fib is at 56.65 euro so I think it will find support down there.
If the 1.272 is lost, the 1.414 at 51.4 euro was a strong support in september 2020 so I am considering to place some cheecky bits down there.
This is not financial advise.

Renault at Resistance? Renault - Short Term - We look to Sell at 34.46 (stop at 35.55)
Trading within the Channel formation. Price action has continued to trend strongly higher and has stalled at the previous resistance near 35.00. We look for a temporary move lower. Selling spikes offers good risk/reward.
Our profit targets will be 31.88 and 30.29
Resistance: 35.00 / 37.00 / 40.00
Support: 30.00 / 28.00 / 25.00
Disclaimer – Saxo Bank Group. Please be reminded – you alone are responsible for your trading – both gains and losses. There is a very high degree of risk involved in trading. The technical analysis, like any and all indicators, strategies, columns, articles and other features accessible on/though this site (including those from Signal Centre) are for informational purposes only and should not be construed as investment advice by you. Such technical analysis are believed to be obtained from sources believed to be reliable, but not warrant their respective completeness or accuracy, or warrant any results from the use of the information. Your use of the technical analysis, as would also your use of any and all mentioned indicators, strategies, columns, articles and all other features, is entirely at your own risk and it is your sole responsibility to evaluate the accuracy, completeness and usefulness (including suitability) of the information. You should assess the risk of any trade with your financial adviser and make your own independent decision(s) regarding any tradable products which may be the subject matter of the technical analysis or any of the said indicators, strategies, columns, articles and all other features.
Please also be reminded that if despite the above, any of the said technical analysis (or any of the said indicators, strategies, columns, articles and other features accessible on/through this site) is found to be advisory or a recommendation; and not merely informational in nature, the same is in any event provided with the intention of being for general circulation and availability only. As such it is not intended to and does not form part of any offer or recommendation directed at you specifically, or have any regard to the investment objectives, financial situation or needs of yourself or any other specific person. Before committing to a trade or investment therefore, please seek advice from a financial or other professional adviser regarding the suitability of the product for you and (where available) read the relevant product offer/description documents, including the risk disclosures. If you do not wish to seek such financial advice, please still exercise your mind and consider carefully whether the product is suitable for you because you alone remain responsible for your trading – both gains and losses.

Long term idea Long term idea for personal use and to see how thing play out not financial advice ofcourse:)

BESI: Moving Averages and Fibonacci Levels BESI - Short Term - We look to Buy at 79.56 (stop at 73.28)
We look to buy dips. We have a 38.2% Fibonacci pullback level of 81.24 from 68.34 to 89.20. The primary trend remains bullish. 50 1day EMA is at 77.00. Risk/Reward would be poor to call a buy from current levels.
Our profit targets will be 95.06 and 99.50
Resistance: 90.00 / 100.00 / 110.00
Support: 80.00 / 75.00 / 70.00
Disclaimer – Saxo Bank Group. Please be reminded – you alone are responsible for your trading – both gains and losses. There is a very high degree of risk involved in trading. The technical analysis, like any and all indicators, strategies, columns, articles and other features accessible on/though this site (including those from Signal Centre) are for informational purposes only and should not be construed as investment advice by you. Such technical analysis are believed to be obtained from sources believed to be reliable, but not warrant their respective completeness or accuracy, or warrant any results from the use of the information. Your use of the technical analysis, as would also your use of any and all mentioned indicators, strategies, columns, articles and all other features, is entirely at your own risk and it is your sole responsibility to evaluate the accuracy, completeness and usefulness (including suitability) of the information. You should assess the risk of any trade with your financial adviser and make your own independent decision(s) regarding any tradable products which may be the subject matter of the technical analysis or any of the said indicators, strategies, columns, articles and all other features.
Please also be reminded that if despite the above, any of the said technical analysis (or any of the said indicators, strategies, columns, articles and other features accessible on/through this site) is found to be advisory or a recommendation; and not merely informational in nature, the same is in any event provided with the intention of being for general circulation and availability only. As such it is not intended to and does not form part of any offer or recommendation directed at you specifically, or have any regard to the investment objectives, financial situation or needs of yourself or any other specific person. Before committing to a trade or investment therefore, please seek advice from a financial or other professional adviser regarding the suitability of the product for you and (where available) read the relevant product offer/description documents, including the risk disclosures. If you do not wish to seek such financial advice, please still exercise your mind and consider carefully whether the product is suitable for you because you alone remain responsible for your trading – both gains and losses.

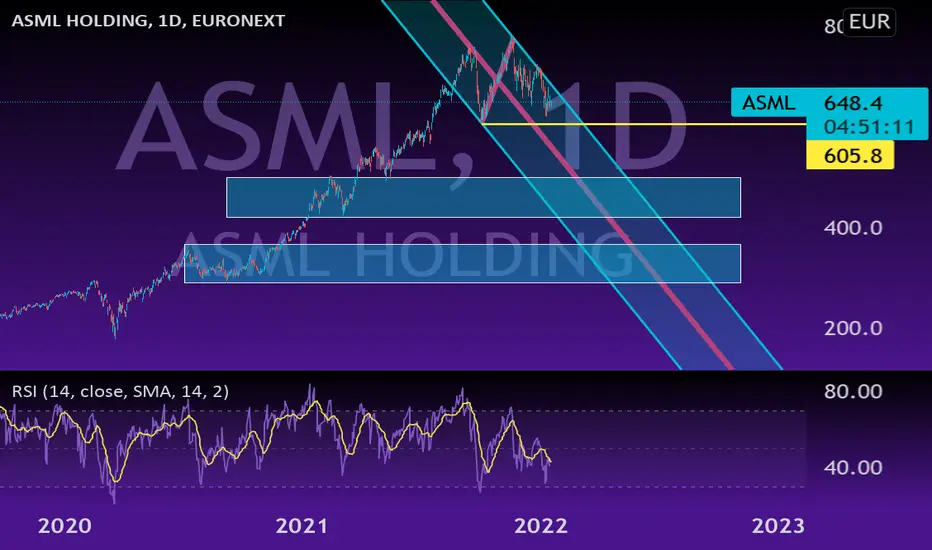
ASML downtrendNot playing this atm
semis are a bubble at this point
Action reaction chart
NOT TRADING ADVICE
GRI 2022
AD.AS long term solid uptrendJust got bounce back after reaching upper trend line, need some correction in the short term or more likely sideways consolidation: new buyback program of 1 billion EUR in 2022 should provide shock demper.
Strong support around 22-24 region (mid channel + volume profile POC), as long as this level holds, any correction provides decent opportunity for long term entries.
Possible upside trigger if e-commerce platform Bol.com gets spin off.
Next earning report 16-Feb-2022

UCB.BR short term bullish potential to challenge ATHConclusion:
A substantial break above 100, preferably above 107 signals a short term bullish potential, challenging ATH and beyond.
A drop below 75 on the other hand renders long term bearish or at least choppy consolidation.
For short term play targeting 108 minimally, with tight stop just under 96, R:R will at least be 2:1.
If break out successful, keep trailing up stop is advised.
Regardless how this short term play works out, it’s prudent to take proper measure to maintain overall exposure before next earning report, due in Feb 2022.
Elliott Wave study v.1:
After reaching ATH at 113 in Jul 2020 and then 3 waves down to 75 in May 2021, it seems to have a short term bullish set up.
Assuming there will 5 up off that May low:
1. the 5 ups to 100 seems perfect, with circle iii of 1 hitting 0.618 and circle iv of 1 retraced to 0.5;
2. then 3 downs to 90 in Sep can easily be counted as circle a-b-c of a corrective wave 2;
3. the mini double top of 107 in Nov looks tricky with a very short circle v; as wave 3 is shorter than wave 1, wave 5 is expected to be not longer than 3;
4. the corrective wave 4 features a circle c with 5 sub waves, in typical contrast with wave 2 where the drop is sharp but shorter in time;
5. we are possibly looking at the start of the 5th, with the first sub waves circle i-ii in place.
Point of concern:
Potential H&S formation i.e. LS at 100 in Aug, H at 107 in Nov, currently right at the RS level at 100-101.
The difficulty to break out this level is also proven by three failed attempts since late Nov, will fourth time be the charm?
The volume profile suggests a strong point of control around 97-98, while the rising RSI during the consolidation in wave 4 also gives it the benefit of the doubt.
Note:
The decent balance sheet and the strong track record of this solid company is well reflected in the long run up of the share price, a better entry for long term holding might be given to those who have patience.
The mono-holding above UCB, $TUB.BR is preferred in this regard given the high discount, which offers an extra margin of safety.
Like most continental European stocks, dividend is paid yearly. Its impact is more significant then a quarterly dividend, which is common for US stocks.
Next pay-out expected in Apr-May 2022, probably around 1.30 per share, a possible trigger for more correction.
Disclosure:
Long term holder of both UCB and TUB, Newbie in Elliott Wave.
Will take out cost base if UCB cannot hold 90 and exit remaining positions if 75 breached.
Price in EUR

Scalping strategy on Air stockHello, we have falling peaks chart pattern on AIRBUS stock. So it can be a good scalping trade if market will not break out 118.78 price. Now we need to wait when market will break support line at 116.16 price. Your entry price should be bellow that price. I think this can be a good trade with 1:2 risk ratio.

Long on UBIUBI in a possible turning point. If you are looking for long this is an interesting point. Wait for the setback with a possible entry long in the marked area. Enjoy, thump up and follow for more ideas!

A backward stepBig investors seem interested in Philips, and that’s been happening for a while now.
For various legal vicissitudes the Stock has had to suffer a pressure from part of some types of investor and for last the collapse happened some days before.
However, the trend towards short-term reductions by institutional investors and professional investors has not been affected.
The recent collapse seems mostly due to a mass sale by private investors and traders.
That’s why I think Philips will go back exactly where he started and then continue his ascent.

Trading the wedgeSeems like free money, but this rising wedge is the sign of an incoming crash.
Nonetheless we can trade the bounces.
Not very afraid of a crash, in fact I plan to buy it, because METEX is great for inflation and for the future, given they use bacteria to make food, oil and plastic and it's undervalued by a factor 10.

PRX.ASThis content is not an investment advice and does not constitute any offer or solicitation to offer or recommendation of any investment product. It is for general purposes only and does not take into account your individual needs, investment objectives and specific financial circumstances. Investment involves risk.

Alstom Long term ideaHere is a long term idea on Alstom EURONEXT:ALO a French multinational rolling stock manufacturer.
I will make a case why a long term view on the company is warranted from technical analysis with some commentary on its financials and business operation.
Technical
The weekly chart is presented here. It shows bullish momentum as indicate by my directional movement and cycle analysis indicators.
On the daily chart, the share price has already appreciated more than 10% from its recent low so out of an abundance of caution, investors with short timeframes might wait for better entry. Those a longer time horizon could continue to ride the trend up.
Financial
The company recently took over Bombardier Transportation and in the process took on significant debt. Net cash is also negative mainly as a result of consolidation of Bombardier's business. Admittedly their balance is a reason for concern and it is expected the business combination will take time to integrate. Nevertheless, over time, cost synergies and efficiency should improve.
Operations.
The Group has over EUR70bn in order backlog and a book to bill ratio above 1. At the current revenue run rate of about EUR7bn annually it will take over a decade to fulfill its current backlog ensuring healthy revenue generation in the years to come. The Group has major orders from all over the world for both rolling stock and signaling. In combination with Bombardier, it is competitive in all rolling stock markets from freight, trams, metro, suburban rail to high speed rail. Hydrogen trains is also being tested and could potentially replace diesel units in the future. Some notable orders include:
France - New RER , Grand Paris metro rolling stock, TGV M
US - Avelia Liberty (NE corridor)
Mexico Maya train
Egypt - line 1 upgrade
Germany DB Regio Coradia
India Dedicated freight corridor (DFCC)
I note that with the exception of the next generation TGV M and hydrogen trains, there is nothing in their backlog that Alstom has not produced in the past. This suggests that the company can continue to drive cost efficiencies and margin expansion.
Despite the pandemic, demand for mobility is still increasing. Many countries have only just started to build out its rail infrastructure. I expect Alstom to be able to fulfill a significant slice of this market in the foreseeable future.


PHIA | Time to buyPhilips has reached it's (nearly) lowest levels for the last 3-5 years,
The reason seems to be a recall of equipment of a value of about 4bl$.
In general the company is quite healthy, no debts, positive cashflow, not very impressive, but still good PE and EPS ratios.
They have concrete development plans and solid background for upcoming profits.
The stock price may in the near future go below 30 euros, down to 27 euros as worst in my opinion.
Considering the fundamental background information and technical analysis expectations (which logically support each other), in a year or two, the stock price could reach the 55-60 euros, meaning doubling.
Considering the purchase price, background info and technically expected future price, now it seems to be a good time to enter the market.
The only drawback investing in PHIA, could be longer return periods, than initially expected.
Since the company is not generating high profits, and pays dividends, they might need much longer time to recover and grow further.
For the rest, it's a healthy company, strong brand and pretty cheap offer, for those who might like the company as investment item.

ALO Neutral: Longterm Waiting periodHello Reader,
The last call was quite good... Check by yourself, the related link below.
With this new post here:
The price entered a breathing period where it needs to gather and collect more orders in the market.
So i don't ride it but i find/suggest find other stocks which you are confortable with ! Don't touch #ALO for the moment.
In the today's chart:
The longterm overall bearishness trend momentum isn't finished yet ! :)
I expect a clear retracement in the 1Q and 2Q. A retracement reaching at the best trigger level is the option.
Meanwhile, i must abandon the Bearishness scenario, if the price stay above @ 36,00. It means the retracement wasn't for another bear leg, it's nicely a reversals. Then i focus on the Bullishness trend momentum.
The average bearish target couldn't extend @ 26,00 level as shown in the chart
.
Thanks for following and have nice trading session :)
AKR Capital

ALO.PA at ideal retracement rang for long term accumulationLong term highly likely to profit from major ESG investments of the EU.
Short term need higher high to confirm bottom is in, will update upside target once 1-2 setup is clear.
RSI and stochastic indicate leaving oversold zone and ready to take off.
Disclosure: beside long term holding, already bought Sep 2022 calls, strike 40 & 45 for short term plays, start to take profit at 38.

ABO.BR long term accumulation areaIdeally come down a little bit more, first tranche initiating at 4 seems very reasonable for long term holding.

Altri in ascendent channel to 8 euros areaAltri is good condition to ascending to 8 euros area. I see a channel and the price is the botton of this channel.

BCP may go to 0.19 areaBCP is an ascendent tendency and recently touch the lowers of this tendency. My target is 0.19 euro.

ATOS: Selling rallies as lower prices are expectedATOS - Intraday - We look to Sell at 38.73 (stop at 41.72)
The medium term bias remains bearish. Trading within a Bearish Channel formation. A move lower has resulted in prices breaking from the previous range and confirmed our bearish expectation. The formation has a measured move target of 30.61. Further downside is expected although we prefer to set shorts at our bespoke resistance levels at 38.73, resulting in improved risk/reward.
Our profit targets will be 30.60 and 28.00
Resistance: 38.74 / 41.13 / 47.16
Support: 36.40 / 36.00 / 34.62
Disclaimer – Saxo Bank Group. Please be reminded – you alone are responsible for your trading – both gains and losses. There is a very high degree of risk involved in trading. The technical analysis, like any and all indicators, strategies, columns, articles and other features accessible on/though this site (including those from Signal Centre) are for informational purposes only and should not be construed as investment advice by you. Such technical analysis are believed to be obtained from sources believed to be reliable, but not warrant their respective completeness or accuracy, or warrant any results from the use of the information. Your use of the technical analysis, as would also your use of any and all mentioned indicators, strategies, columns, articles and all other features, is entirely at your own risk and it is your sole responsibility to evaluate the accuracy, completeness and usefulness (including suitability) of the information. You should assess the risk of any trade with your financial adviser and make your own independent decision(s) regarding any tradable products which may be the subject matter of the technical analysis or any of the said indicators, strategies, columns, articles and all other features.
Please also be reminded that if despite the above, any of the said technical analysis (or any of the said indicators, strategies, columns, articles and other features accessible on/through this site) is found to be advisory or a recommendation; and not merely informational in nature, the same is in any event provided with the intention of being for general circulation and availability only. As such it is not intended to and does not form part of any offer or recommendation directed at you specifically, or have any regard to the investment objectives, financial situation or needs of yourself or any other specific person. Before committing to a trade or investment therefore, please seek advice from a financial or other professional adviser regarding the suitability of the product for you and (where available) read the relevant product offer/description documents, including the risk disclosures. If you do not wish to seek such financial advice, please still exercise your mind and consider carefully whether the product is suitable for you because you alone remain responsible for your trading – both gains and losses.

KBC.BR has upside potential in 2022 but long term uncertainOff the covid crash low we were 3 waves up before a correction began, currently retrace to around 0.786 fib.
As long as 60 (the 0.5 fib) hold, I can see upside target 1.382 fib, which is ...surprise surprise... right at the ATH... struck in 2008 just before the GFC crash...
All coincident aside, after 5 waves completion, a bigger degree of correction will occur, the bullish portion of this cycle is probably at its exhaustion.
Fundamentally, KBC is one of the best capitalized banks in continental Europe, can outperform its peers.
The caveat: Financials have been systematically underperforming the market sinds the GFC.
