Long POSI3According to JOEL GREENBLAT's FACTOR INVESTING methodology, positive is currently one of the 3 cheapest shares on the IBOV. But graphically it has not yet reached the best buy point according to the indicator.
I continue to watch to build a larger position in the asset.
It could be one of the best opportunities the role has given in recent years!
BMFBOVESPA:POSI3

Vale trend downVale the biggest brazilian iron ore company is showing a big weakness mainly due to slow down in the chinese economy, for moment its sell

No real research done here I received a suggestion to invest in this stock in Brazil the back story and fundamentals seems strong but at first glance the technicals look weak. Im just putting this here to look back at it and see how it plays out will the fundamentals win or will technicals drive price down lets see

PRIO3 and RRRP3Booth stocks in a verge of a possible break down support.
Round formations show a possible down move.
Possible bounce also supported by the strong supports, for aggressive traders.

Petrobras (PETR): Bearish Divergence - Heading for a Dip After the market closed yesterday, Petrobras, a Brazilian stock, released a new earnings report. We're analyzing it in Brazilian Real (BRL) to get the most accurate view of the chart. On the weekly chart, we anticipate a mild but noticeable bearish divergence, especially since the beginning of 2024 when the stock has significantly appreciated.
There is considerable downside potential as we expect the completion of Wave (3), followed by a downward adjustment in Wave (4). The exact retracement level for Wave (4) is yet to be determined, but we anticipate a pullback to around 38.52% before the stock resumes its upward trajectory in Wave (5).
Our downside target is around 50 BRL, considering Petrobras' high dividend yield. This makes the stock attractive not only for its growth potential but also for its income-generating ability.
A closer look at the daily chart reveals potential scenarios for either the completion of Wave 5 or Wave (3), highlighting areas where bearish divergence becomes more apparent. This divergence is evident due to the significant impulsive rises in the stock over recent months and weeks, which have created several imbalances. Despite closing gaps and reaching new highs, a downward correction is likely needed before we can see further upward movement.
We anticipate that the correction in Wave (4) will take the stock lower, potentially reaching levels between 28.28 and 23.30 BRL.

Petrobras Uncovered: A Dividend Gem with Potential?
Petrobras' ON N2 shares from Brazil are particularly interesting, notably due to their high dividend yield. As the largest oil producer in Brazil and one of the biggest in South America, this stock holds significant importance over the coming years. It has experienced a strong rise, with our Wave (2) starting at 2.2 Brazilian Reals. Since then, it has risen and completed Wave (3) at the 227.2% extension level. Now, we should be entering Wave (4) and ideally not fall below the level of 19 Brazilian Reals. For Wave (4), we expect a retracement level between 38,2% and 50%. Given that we're looking at the weekly chart, this represents a very long-term scenario. We'll definitely keep you updated and may provide short-term entry opportunities as they arise. In the coming months, we expect to develop Wave B and finally Wave C. After that, as previously mentioned, holding this stock long-term could be very beneficial due to the remarkably high and attractive dividend yield.

rrrp3 bullish signalrrrp3, 3R petroleum is a Brazilian junior oil, check this out!! Its a good entry point.

CYRE3 - 7 months CUP & HANDLE══════════════════════════════
Since 2014, my markets approach is to spot
trading opportunities based solely on the
development of
CLASSICAL CHART PATTERNS
🤝Let’s learn and grow together 🤝
══════════════════════════════
Hello Traders ✌
After a careful consideration I came to the conclusion that:
- it is crucial to be quick in alerting you with all the opportunities I spot and often I don't post a good pattern because I don't have the opportunity to write down a proper didactical comment;
- since my parameters to identify a Classical Pattern and its scenario are very well defined, many of my comments were and would be redundant;
- the information that I think is important is very simple and can easily be understood just by looking at charts;
For these reasons and hoping to give you a better help, I decided to write comments only when something very specific or interesting shows up, otherwise all the information is shown on the chart.
Thank you all for your support
🔎🔎🔎 ALWAYS REMEMBER
"A pattern IS NOT a Pattern until the breakout is completed. Before that moment it is just a bunch of colorful candlesticks on a chart of your watchlist"
═════════════════════════════
⚠ DISCLAIMER ⚠
The content is The Art Of Charting's personal opinion and it is posted purely for educational purpose and therefore it must not be taken as a direct or indirect investing recommendations or advices. Any action taken upon these information is at your own risk.

Deep Dive into Taurus Arms Financials: A Look at 2024 ProspectsPrice Performance and Trends: The asset has experienced various ups and downs over the years, with an all-time high considerably above the current price. The recent trend seems to indicate a price resistance level that the stock struggles to break above. It's crucial to look at whether the stock has had strong reversals from this resistance level historically and if there are patterns in its price movements around key technical levels.
Valuation Ratios: The P/L (Price to Earnings) ratio is 7.59, which suggests that the stock may be reasonably valued compared to earnings, assuming that the industry average P/E is in line with this. The P/VP (Price to Book Value) ratio is 1.58, which can indicate that the market values the company higher than its book value. These ratios can give some idea of how the market is currently valuing the stock.
Profitability Indicators: The ROE (Return on Equity) of 20.9% is quite strong, showing the company is generating good profits from its equity. Similarly, the ROIC (Return on Invested Capital) of 15.7% is also a strong point, indicating efficient use of capital.
Debt Levels: The Dívida Líquida/Patrim (Net Debt to Equity) ratio is 0.33, and the Liquidez Corrente (Current Ratio) is 1.62. These indicators suggest that the company is not overly leveraged and maintains a solid short-term liquidity position.
Dividend Yield: A dividend yield of 10.1% is quite attractive, suggesting that the company returns a significant amount of value to shareholders in the form of dividends. This could be appealing to income-focused investors.
Growth and Revenue: The company has a growth in revenue of 23%, which is robust and indicates that the company is expanding its business effectively.
When considering whether to purchase this asset in 2024, it is vital to evaluate not only these individual data points but also the broader context:
Market Conditions: Consider the overall stock market conditions and economic outlook for 2024. A bullish market may support growth in stock prices, while a bearish market may lead to lower prices.
Sector Performance: Since this company is in the Machinery and Equipment sector, focusing on Arms and Ammunition, it's essential to analyze the sector's performance and any regulatory or geopolitical factors that might affect it.
Company Fundamentals: Beyond the metrics, the company's management quality, strategic position, competitive advantages, and future growth prospects should be considered.
Risk Tolerance: Assess your own risk tolerance and investment goals. A company with high dividend yield and solid ROE might suit a more conservative investment strategy focused on income and stability.
Technical Analysis: The chart shows some technical analysis indicators and buy/sell signals based on an EMA (Exponential Moving Average) crossover strategy. How these indicators align with your own technical analysis strategy (if you use one) could influence your decision.
Disclaimer:
"Please note this is not a buy recommendation, merely a financial analysis based on current data."

Petrobras trend downPetrobras (PBR), The mains brazilian oil company has changed his intern policies and it caused loads of pain into its stock.. for moment its in down trend pressure.... neutral to sell side!

BBDC4 BradescoPrice reached the support zone ( R$ 13.32 ).
Possible lateralization and then look for the target (resistance zone) at R$14.80 in the long term.

VIVT3Telefônica Brasil, trading as Vivo, is a Brazilian telecommunications group, subsidiary of Spanish Telefónica. It was originally formed as part of Telebrás, the state-owned telecom monopoly at the time. In 1998, Telebrás was demerged and privatized.
Bias: Buy/Long
Strategy: Re-Emerging Momentum.

HG and VALEHG and Vale tandem in the same direction as showed in the video.
Please see video for exact points and explanation.
Thank you.

RAIL3 (Rumo)Rumo, formerly known América Latina Logística, is a Brazilian logistic company, mainly focused in the railway line logistics in Brazil, being the largest company in Latin America in this segment.
Potential swing buy/long.

Azul in the best buy scenarioAzul (AZUL4) has improved its latest quarterly results, in addition the price is at pandemic crash levels. In general, Brazilians dislike three sectors: retail, slaughterhouses and aviation. In my opinion, this is an opportunity. Targets in Fibonacci extensions: 0.618 (R$21.63), 1 (R$27.60), 1.618 (R$37.25) and 2.618 (R$52.87).

BEEF3 adjusted for Brazilian inflationMinerva Foods (BEEF3) is the largest beef exporter in South America, with access to more than 100 countries and operations in Brazil, Argentina, Chile, Colombia, Uruguay, Paraguay. Adjusted for Brazilian CPI and considering its fundamentalist indicators the stock it in one of its cheapest periods. The main concern is the company debt, leverage.


Alvo para UGPA3Nosso Robô Canio v10 do profit chart
deu entrada, a taxa de acerto de
31 operações
foi de 100%

Alvo para tims3Nosso Robô Canio v10 do profit chart
deu entrada, a taxa de acerto de
32 operações
foi de 100%

Alvo para BBAS3Alvo para BBAS3 taxa de acerto de 90% no setup de nosso RobÔ Canio V10 do profit Chart

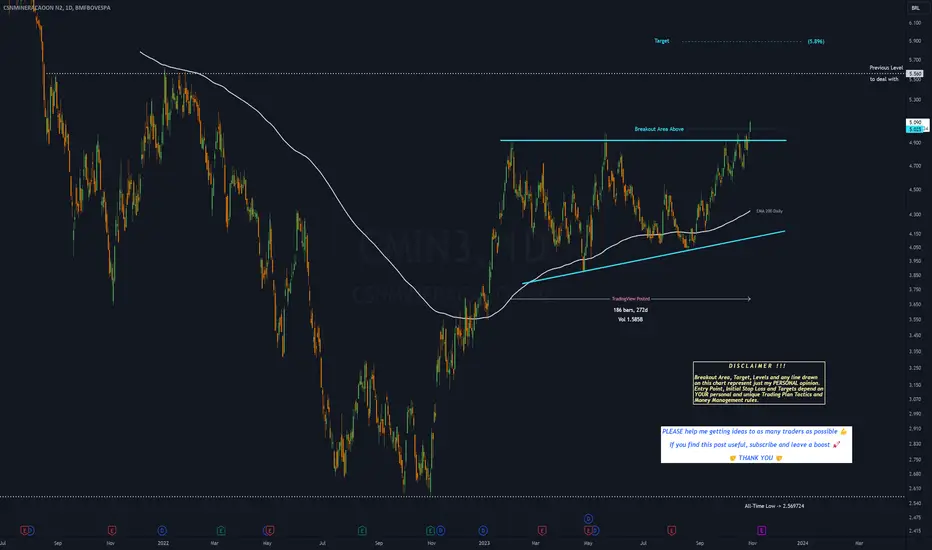
Rompimento Lindo - Beautiful Breakout !CMIN3 - Rompendo esse topo, abre espaço pra um rally!
CMIN3 - Breaking the resistence, open room to solid rally!
#CMIN3 #IBOV #BOVESPA #BRL

CMIN3 - 9 months ASCENDING TRIANGLE══════════════════════════════
Since 2014, my markets approach is to spot
trading opportunities based solely on the
development of
CLASSICAL CHART PATTERNS
🤝Let’s learn and grow together 🤝
══════════════════════════════
Hello Traders ✌
After a careful consideration I came to the conclusion that:
- it is crucial to be quick in alerting you with all the opportunities I spot and often I don't post a good pattern because I don't have the opportunity to write down a proper didactical comment;
- since my parameters to identify a Classical Pattern and its scenario are very well defined, many of my comments were and would be redundant;
- the information that I think is important is very simple and can easily be understood just by looking at charts;
For these reasons and hoping to give you a better help, I decided to write comments only when something very specific or interesting shows up, otherwise all the information is shown on the chart.
Thank you all for your support
🔎🔎🔎 ALWAYS REMEMBER
"A pattern IS NOT a Pattern until the breakout is completed. Before that moment it is just a bunch of colorful candlesticks on a chart of your watchlist"
═════════════════════════════
⚠ DISCLAIMER ⚠
The content is The Art Of Charting's personal opinion and it is posted purely for educational purpose and therefore it must not be taken as a direct or indirect investing recommendations or advices. Any action taken upon these information is at your own risk.
VALE3 Week of Oct 16 to 20 2023VALE3 in a congestion mode with possible break to the upside.
Please see video for explanation.
Thank you.
