
Consolidando no ponto de resistênciaAMAR3 Segue na onda 3 para cima após onda 2 de correção perto de 0,618 de fibo na casa dos $4,83.
Agora consolidando no topo, próximo da resistência, mas na continuidade da onda 3 que pode seguir subindo até a casa dos $7,77, confirmando o mesmo tamanho da perna da onda 1. Pode ganhar mais força rompendo uma forte resistência e chegar até 1,618 de fibo na casa dos $9,50.
Independente do tamanho da onda 3, após o rompimento da resistência ela pode vir testar a casa dos $6,55 que atuaria como suporte.
Entrada rompendo os $6,55 com stop de segurança abaixo de $6,23 e alvo em $7,78 e $9,50.
Obs: Esta análise reflete apenas minha opinião pessoal e não é uma indicação de compra ou venda, opere por sua conta e risco, mas fique a vontade para debater análise técnica.
Ótimo trade a todos!!

Rompimento de Triângulo?CSNA3 Trabalhando acima das EMAs de 13 e 26 rompendo o triângulo simétrico indicando uma possível subida.
Projeção de ganhos bastante interessantes de cerca de 36% no alvo 1 e quase 100% no alvo 2! Ohh loco bicho!!
Como ela já deu uma esticada, o stop ficaria muito longo nos 9,25. Então, acho que vale um stop baseado no gerenciamento de risco na casa dos 9,74.
Obs: Esta análise reflete apenas minha opinião pessoal e não é uma indicação de compra ou venda, opere por sua conta e risco, mas fique a vontade para debater análise técnica.
Ótimo trade a todos!!

ABEV3 - Movimento altista + volume Entrada comprado acima de 18,94
Entrada vendido somente caso venha romper o suporte 17,35 e confirmar no candle seguinte.

Buy Anim3 on bullish flagAfter freezing itself from a clear downward channel, Anim3 confirmed major inverted head and shoulders bottom pattern. Now, there may be a short swing trade buy opportunity as ANIM3 just confirmed bullish flag pattern with strong volume, continuing medium to longterm rising trend.

HYPE3TRADE AINDA NÃO ATIVADO.
Vamos observar o gráfico durante o dia para aproveitar uma possível compra na negação do suporte da Média de 21. Se não houver rompimento hoje, o que tem sido mostrado por enquanto, vamos operar a falha do 1-2-3. De qualquer modo estamos em uma tendência de alta, com as médias indicando força de compra.
Atualizarei com o prosseguimento.


Buy JHSF3 on breakout from long term negative trend lineBuy JHSF3 on breakout from long term negative trend line. Significant bottom divergences on MACD, RSI and OBV. Recent breakout from bullish flag or pennant. Target around doubling of current price at around 4.00.

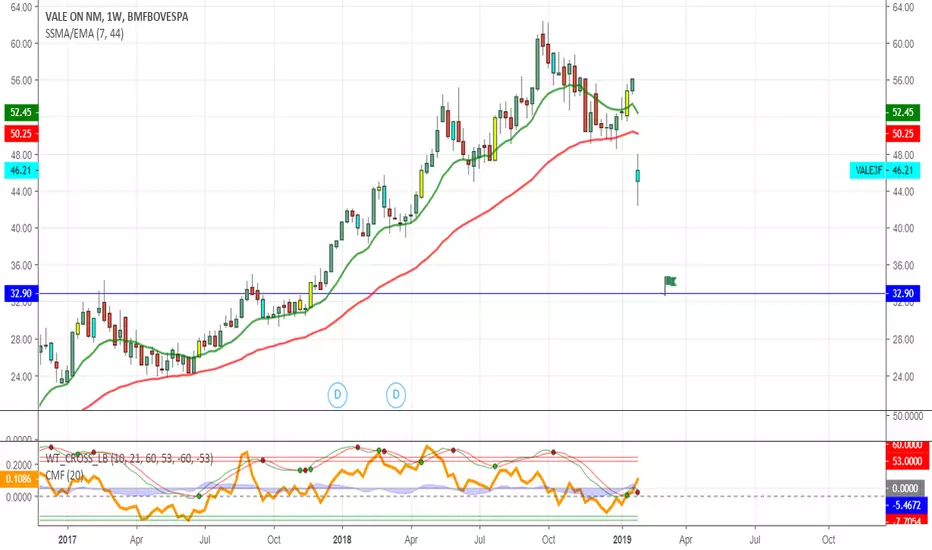
Vale Mine Disaster! I feel like the drop has just gotten underway... blue line is the target. Note: this is Brazilian chart not VALE: NYSE
Possible correction input ABCD $$thank you and follow me, this is not an investment tip but an analysis based on graphic studies

BEEF3 - Após longa tendencia de baixa pode dar compra d positionO papel iniciou essa pernada de baixa em 09/2017 e agora se escorou no fundo bem antigo, lá de 2011.
Começa a ensaiar um zig zag ascendente.
Neste primeiro momento, a projeção de 100% do "pivozinho" armado vai em R$6,38, onde tem também a média de 200. Média essa que começará a mudar a direção caso seja rompida.
Torço para que o papel encontre resistência na MM200, faça o pullback até R$6,00(ultima zona de resistência rompida), onde será possível um entrada com stop em R$5,30 e alvos parciais em R$7,50 e 10,00, e restante guardando para teste de R$13,00.
Obs.: Este é um estudo, não é call de compra ou venda.

Petrobras - PETR4 - Se romper o retângulo, pode dar entrada.Traçando uma extensão alternada de Fibonacci da ultima pernada de alta e considerando a consolidação do ultimo mês,
temos alvos de ST em 27,20 e 27,70(80).Um alvo mais longo ainda podemos considerar 29,90(100% de fibo).
Enquanto o IBOV andou 10 mil pontos em 2019, Petro andou dentro deste retângulo.
Stop curto e mais barato em 24,50.
Ponto de entrada: Talvez seja mais vantajoso entrar usando o gráfico de 60m, confirmando o rompimento do retângulo.
Obs.: Este é um estudo, não é call de compra ou venda.

EUCA4 - Oportunidade - compratrade idea
Operaçao Arrojada, atencao a liquidez do ativo
Pontos de entrada sinalizados no grafico

Queda a vista VALE3Após rompimento na barragem em Brumadinho, e munido a critérios técnicos como 1.618 de fibonacci, projeção de perna 3 e rompimento de LTA, munido de tudo isso a VALE3 tem uma gigante probabilidade de cair desenfreadamente.


BUY TCSA3 High Amplitude Inv. Head and ShouldersBUY TCSA3 on rebound after pullback to broken neckline on high amplitude inverse head and shoulders bottom pattern.

Divergencia MACD na GOLL4 - Reversão de tendência?Fala pessoal.
No gráfico diário está muito nítida a divergência entre os últimos 2 picos com o MACD 2.
Na última vez que isso aconteceu, divergência positiva, houve reversão da tendencia também.
Isso não é uma indicação de trade. É meramente para fins indicativos.

Buy VLID3 on broken downtrendBuy VLID3 on broken downtrend and important resistant levels. Good fundamentals: the company has very flexible and competent management, who has been able to reinvent the company for several times, overcoming major business model challenges.

BUY JSLG3 on Beautiful Inverse Head and Shoulders BottomBUY JSLG3 on textbook Inverse Head and Shoulders Bottom: broke out from neckline, made brief pullback, and now strongly up again. Minimum target around 13 (projected amplitude of head and shoulders figure from neckline), but fundamentally the stock may go much higher if macroeconomic conditions in Brazil improve more than expected.

PETR4 - Pullback e continuação ?Analise PETR4
No gráfico acima verificamos um canal de alta , no qual é formado por 3 linhas sendo: Suporte do canal correspondendo a LTA (linha de tendencia de alta), linha intermediaria, linha de resistência máxima no topo do canal.
Verifica-se que dentro desse canal de alta visualizado de forma "macro" observamos um outro canal. O mesmo foi rompido fazendo que o ativo tivesse uma queda acentuada buscando a MM200 que serviu como suporte para o ativo.
Acima indicado com circunferências os pontos onde ocorreu o rompimento e a retração de preço. Interessante observarmos que alem da MM200 tínhamos também a linha de 50% de Fibonacci, fazendo com que esse suporte fique mais forte e o preço retraia.
Gráfico de 1h
Já no gráfico de 1h observa-se a alta após a retração no suporte citado acima, rompimento da MM200 de 1h e no atual momento o ativo se encontra cotado na margem da resistência intermediaria, essa resistência foi testada e observado que o ativo perdeu força compradora e passou a ter uma força vendedora, onde está iniciando um possível "pull back" que pode buscar o suporte de 24,00 a 24,40.
E verificado que o ativo está desenvolvendo a onda 5 de elliot, com isso, após esse "pull back"há a grande probabilidade de ir buscar a resistência intermediária novamente e realizando rompimento da mesma pode-se dar continuidade a tendencia.

HAMMER TIME!!As seen on chart, we got that a bounce off of 0.236 to place that "a wave" and now should the downtrend should resume to complete "c". Also, volume has been declining and the MACD has turned bearish! Very nice R/R for a short right here.

