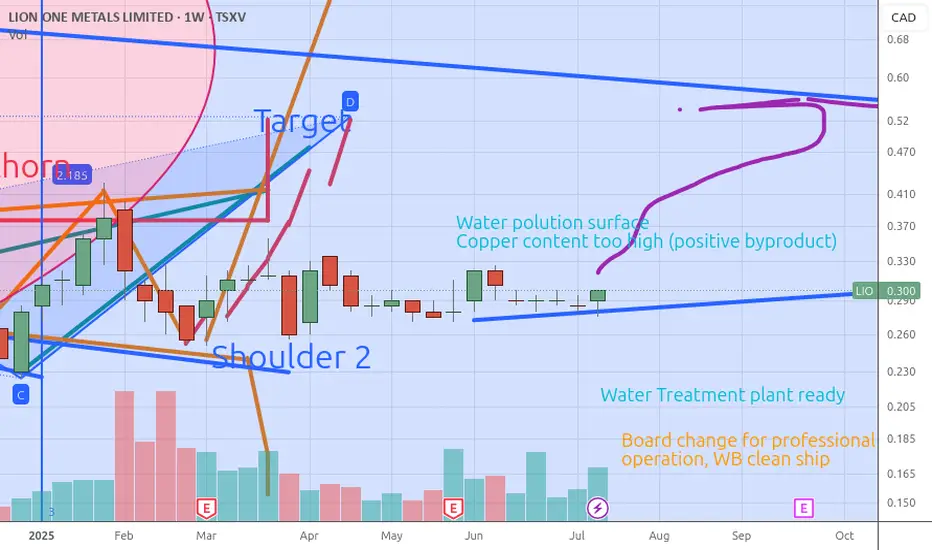
Lion one metals has their water treatment plant set up 100mSo at 10k oz per quarter production 2026, this stock is worth 0.60ct and 120 million usd

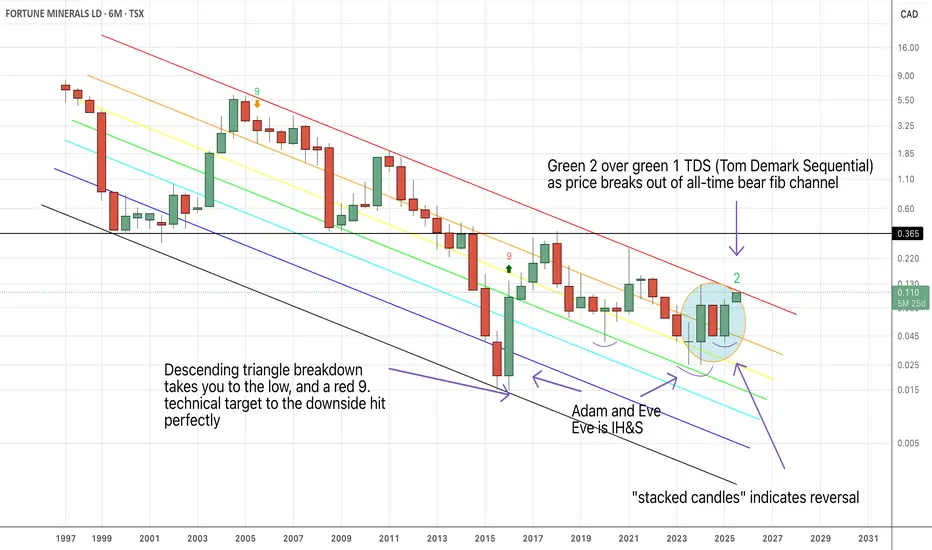
Fortune MineralsI'm sure it's nothing to worry about. The fact that the price keeps banging into the top of the bear fib channel, and breaking out from all-time inverse parabola. The price is refusing to go down, so up is the only other direction it can go.

Fortune MineralsAfter banging off the top of the bear fib, the price came down and bounced off the top of the all-time inverse parabola. We got a pretty good bounce on low volume, but a landing on the moving averages is not in the rear-view mirror. A return to the 1-level bear fib, and you start to think about do you have enough Fortune? Maybe you need more for the run to $2 USD.

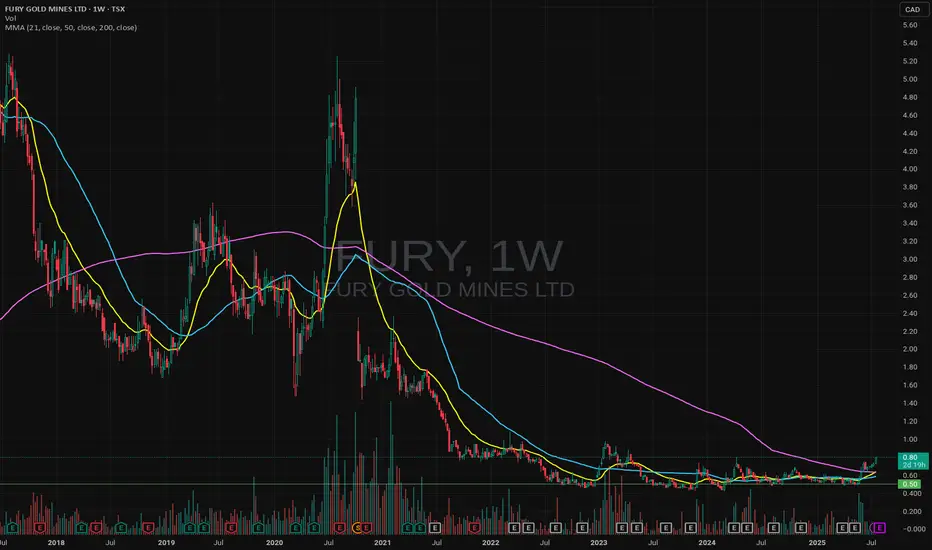
FuryFury
Well I bought this a while ago and forgot I had it. Paid $0.50 In the Canadian exchange.
I liked the base and bought it, not a tonne but some. It is finally taking shape.
I like the weekly golden cross potential here.
Jr miners tended to run in weird times.
I'm still long
Water, Clean (board) Ship and 0.50 target. for 0.30 broken lio.vWater polution 30th of May gave a storm to the share. Like an oil spil, their copper spil was seen negative. There is considerable potential for Copper as by product with 200 eu a kg. Further we see WB is making a clean ship, firing the people who were not sustainable. Finding an Operation veteran who brough another mine to 2 billion marketcap. size. All positive now there Water Treatment plant is finished.
FLT - Long Term VisionOne of my favourite stocks. Looking at this, I am taking a 3-5 year outlook. It seems the company has been on a mission to grow and generate income. I wouldn't be surprised to see a Government contract get signed. (US or Canada) Would love to see them on the TSX. Eventual long term vision is a $10 stock while I attempt to accumulate shares at each of my targets. Would love to hear other opinions on this. This is my NVDA/Amazon over the next 20 years.

BBD.B Update idea after splitLONG LONG LONG ! Company have a very good future. The company sold the part that produced the trains. And she concentrated all her attention on the production of business jets. Technically, the company's shares look very cool. We tried to hide the technical specifications behind the split, but I have an old graph in my head.)))

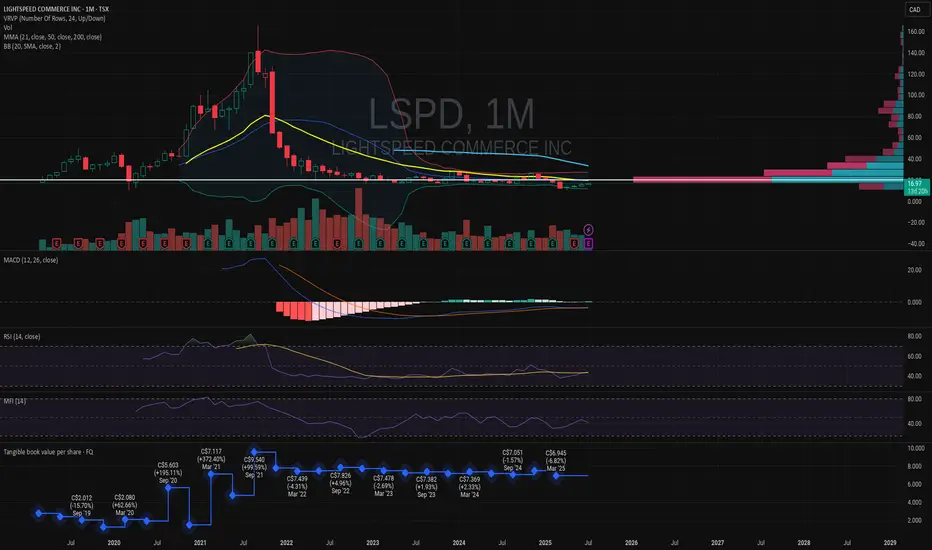
LSPD - Looks promising here. LONG. LSPD
If they can keep on keeping on, bring in cash, I think they have a good shot at carving out a market.
Of course I'm a newbie at all this and just giving my 0.00002 worth.
Same goes for all my charts. I don't profess to know a whole lot, but I'm trying.
If the last few years were tough for companies, expect more to come. IMO
So debt is a problem, staying cash positive is key, and creating a good management group is imperative. again, just thoughts.
cheers.
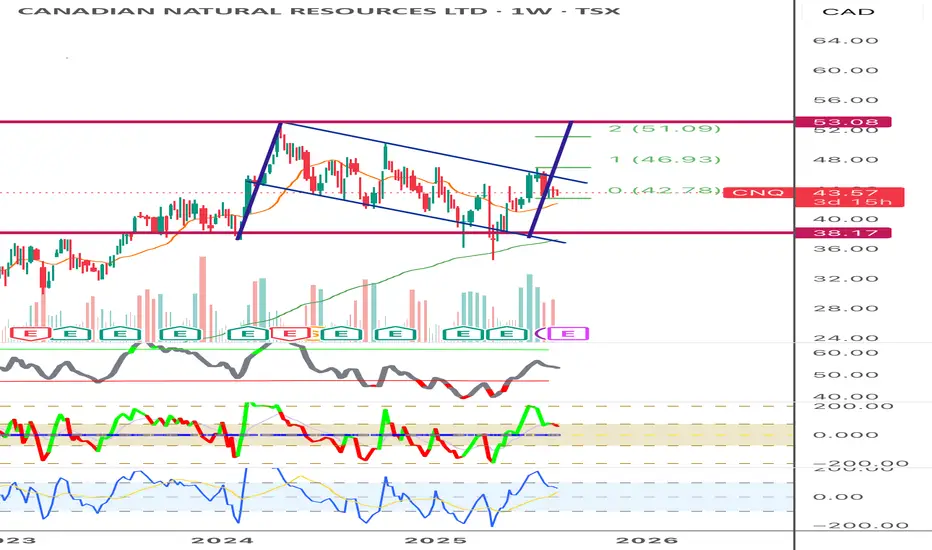
CNQ Earning Aug 7th, this to keep track of the stock for my own study to see if this works out. This is not for trading, just learning patterns
barrick, run it hotfiscal dominance adding downward pressure on dollar. long term chart look favourable with key fib levels being touched. added copper exposure in usa, abx has some legs

Empress Royalty – Undervalued Precious Metals Royalty🔹 Fundamental Outlook:
Empress Royalty offers exposure to gold and silver through a diversified portfolio of streaming and royalty agreements, with a focus on earlier-stage producers and developers. Backed by strategic partnerships with Endeavour Financial and Terra Capital, the company leverages deep deal flow and structuring expertise, while keeping overhead lean.
Cash flowing from several active royalties
EV/EBITDA (TTM): ~2.3 – indicating deep value
Free Cash Flow: ~$33M
Float: Only ~43M shares – tightly held
No major debt concerns (cash/debt ratio ~1.44)
The recent appointment of Mark Ashcroft as Business Development Advisor (North America) further boosts Empress’ ability to scale its portfolio with quality assets in the region.
✅ Undervalued vs peers on cash flow and earnings
✅ Royalty model limits operational risk
✅ Exposure to gold and silver (a rare mix)
✅ Insiders and partners with long-standing mining credentials
✅ Benefiting from a rising silver sentiment and the search for non-dilutive capital by small/mid-tier miners
🔹 Risks:
Operator dependency (as a royalty company)
Exposure to early-stage projects with potentially higher execution risk
Thin trading volume at times, which may increase volatility
📈 Conclusion:
Empress Royalty is a fundamentally solid, technically bullish small-cap royalty play. With silver sentiment turning and precious metals investors rotating into high-leverage names, EMPR offers both growth potential and asymmetric reward/risk.

AWX - Breakout from Multi-Year Cup & Handle + JV Deal with FCXArcWest Exploration (TSXV: AWX) just broke out of a 7-year cup & handle formation, hitting C$0.21 with record weekly volume (1.53M).
📉 Long-term downtrend decisively broken
📊 12W SMA (0.114) > 36W SMA (0.098)
☁️ Weekly Ichimoku turns bullish
🔻 Pullback to C$0.185 (-7.5%) may offer entry
🔎 Next resistance zone: C$0.30+
Fundamental trigger:
ArcWest Exploration is a project generator focused on porphyry copper-gold systems in British Columbia, operating under a JV-based model. The company currently has eight 100%-owned projects, several of which are already partnered with major producers.
The recent breakout follows the announcement of a joint venture agreement with Freeport-McMoRan on the Eagle project, where Freeport can earn up to 80% interest by spending C$35M over 10 years, including staged cash payments and a commitment to fund exploration.
This deal marks ArcWest's second major JV partnership, alongside Teck Resources (on the Oxide Peak project), further validating the quality of its portfolio. Both Freeport and Teck are known for targeting large, long-life copper assets, which adds strong institutional backing and long-term exploration potential.
The alignment of technical breakout + institutional interest signals a possible structural re-rating as the market begins to price in multi-asset optionality and tier-1 partnerships.
The chart and fundamentals now align, suggesting multi-year upside potential.
📌 Do your own research before investing!

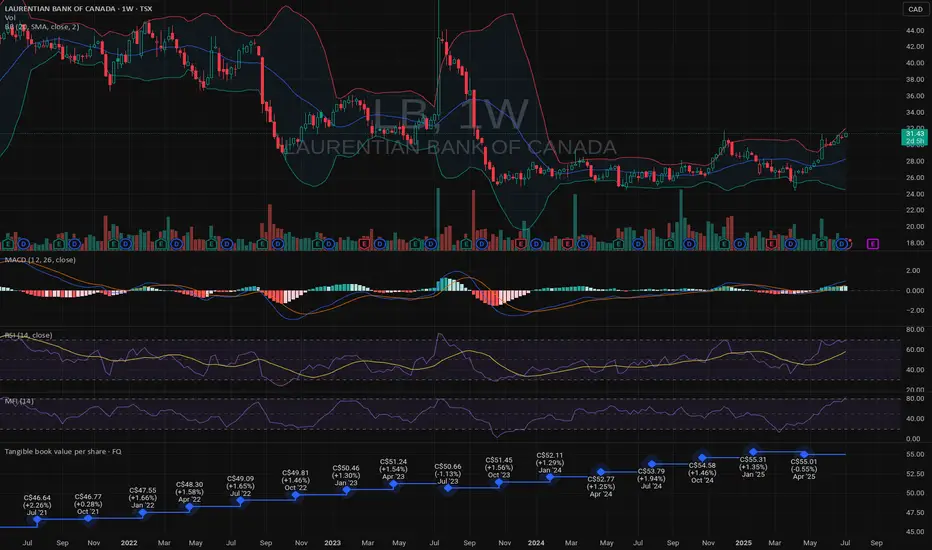
LB LONGLB laurentian Bank
LB on the TSX exchange
I am long this bank. good Tangible Book and decent chart.
our cost basis is approx $27 Canadian Dollars
I like it, and hope they stay stable.
Cheers
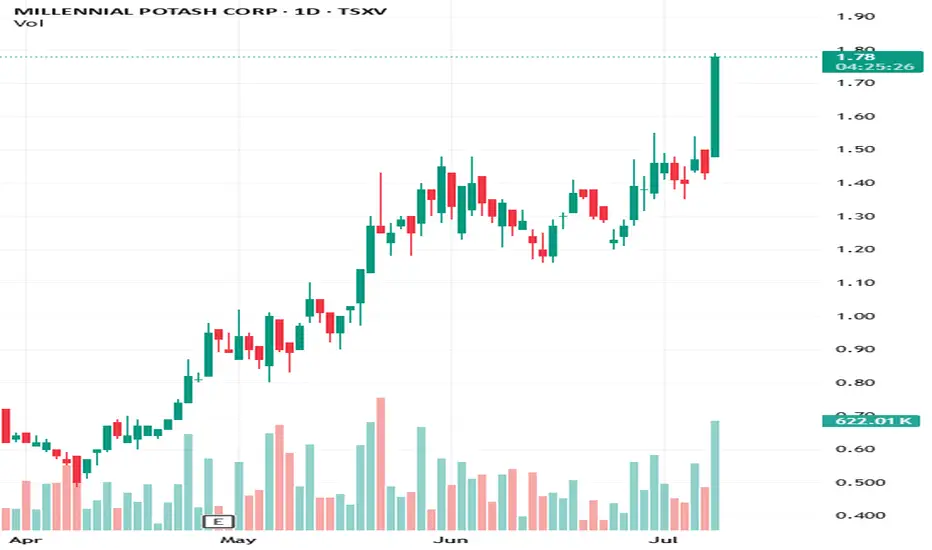
U.S. DFC Invests in $TSXV:MLP Banio Project Millennial Potash Corp. ( TSXV:MLP | OTC:MLPNF ) just announced a major development: the U.S. International Development Finance Corporation (DFC) has committed up to US$3M in project development funding for the Banio Potash Project in Gabon.
This strategic funding supports the upcoming Feasibility Study and was signed in Washington D.C. with the President of Gabon in attendance — a major signal of international and governmental backing.
Why this matters:
Potash = food security. Fertilizer is essential for crop yields, and potash demand in Africa is rising fast.
DFC backing helps derisk the Banio project and positions MLP for future development financing.
The investment arrives as Millennial moves from exploration to development — with second-stage drilling nearing completion.
Gabon's support + U.S. government endorsement puts MLP in a strong geopolitical position for long-term growth.
Follow for updates as the feasibility study unfolds and MLP potentially emerges as a cornerstone player in Africa’s potash supply chain.
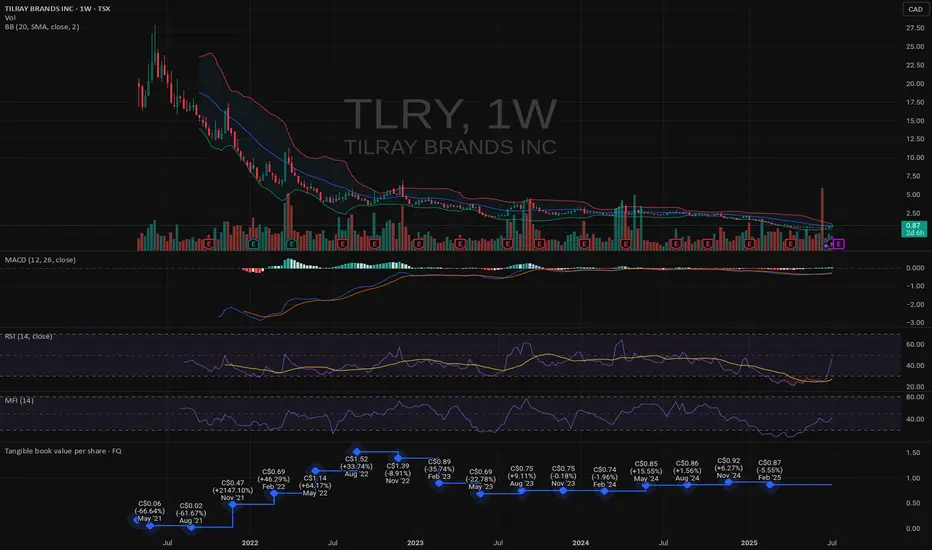
TLRY - LONGTLRY
Well I was a little too eager before and bought some at $5.00
But, I bought again.
It appears to be making a base here.
Tangible Book is not to far off the price. So decent.
I hope they can improve their earnings and continue to grow.
Cheers
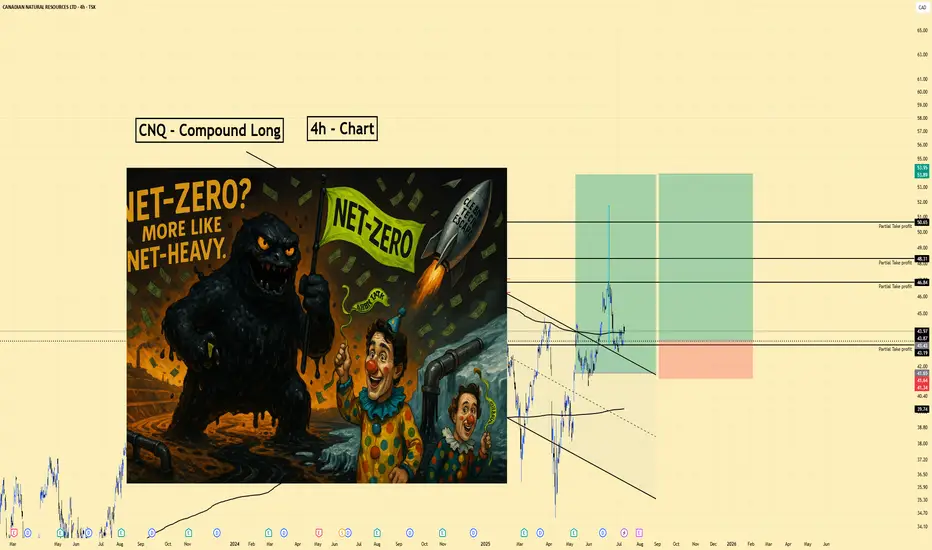
CNQ | Long | Oil & Gas Diversification Play | (July 9, 2025)CNQ | Long | Oil & Gas Diversification Play | (July 9, 2025)
1️⃣ Short Insight Summary:
Canadian Natural Resources (CNRL) is moving strong thanks to its diversified oil & gas operations, LNG expansion, and solid ESG positioning. We’re already up nicely on this move, and the setup still looks promising for higher targets.
2️⃣ Trade Parameters:
✅ Bias: Long
✅ Entry: Already in from lower (around $41)
✅ Stop Loss: Adjusted close to breakeven (~$41) to protect profits
✅ TP1: $46 — already partially hit (we took out 50% here)
✅ TP2: $50.65 — next profit-taking zone
✅ Final TP: $53.89 — extended target for the runners
✅ Partial Exits: Already 50% out, considering re-compounding at strong support zones
3️⃣ Key Notes:
We’re riding strong fundamental drivers: a major long-term LNG deal with Cheniere, increased pipeline capacity, and a robust oil sands base. The carbon capture (CCS) initiatives also support its ESG image, though they add capital costs. Oil price volatility and regulatory pressures remain risks, but the trend stays bullish as long as oil holds up and macro flows support energy stocks.
If entering fresh now, I'd watch closely and consider a tight stop around $41, as mentioned, to avoid getting caught in pullbacks.
4️⃣ Optional Follow-up Note:
I’ll continue to monitor and update this idea if major structure or price action changes.
Please LIKE 👍, FOLLOW ✅, SHARE 🙌 and COMMENT ✍ if you enjoy this idea! Also share your ideas and charts in the comments section below! This is best way to keep it relevant, support us, keep the content here free and allow the idea to reach as many people as possible.
Disclaimer: This is not a financial advise. Always conduct your own research. This content may include enhancements made using AI.
Fortune MineralsThe price is slipping away from the bears, but I don't think anyone was harmed, because there's no short interest. Even the bears are bullish. They may have wanted to buy, or convert, more shares at a lower price, but they're not upset to see higher prices. Nobody is upset to see higher prices, and so the price goes up as sell pressure eases into a vigorous pump up to the $.25USD neckline.
Most to all of the underlying metals that FT deals in is pumping, so pump in the ticker kind of makes sense. Looks to me like we're about to leave the all-time bearish fibonacci channel. Good times ahead as we turn bullish and enter into our new "bull fib channel". My own proprietary bull fib channel, which you've seen nowhere else. Guys on the blogs are getting their targets from me. Who has been saying $2 for the last two years?
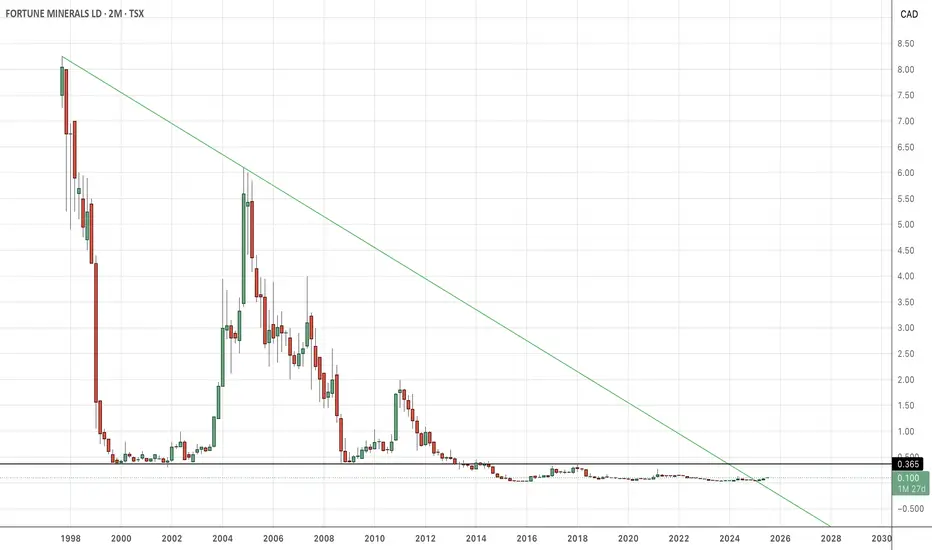
Fortune MineralsAnd here she is in log.
With OBV rising, the $.25USD pivot is in the headlights, but that's just the first step. We have a higher swing high on the dailies, but that does not make FT bullish. You need a higher-swing-high on the weeklies or a longer timeframe. So, the pump to $.25 is the pump before the pump. It's kind of like the dip behind the dip, but in reverse.
I'll see you at $2.
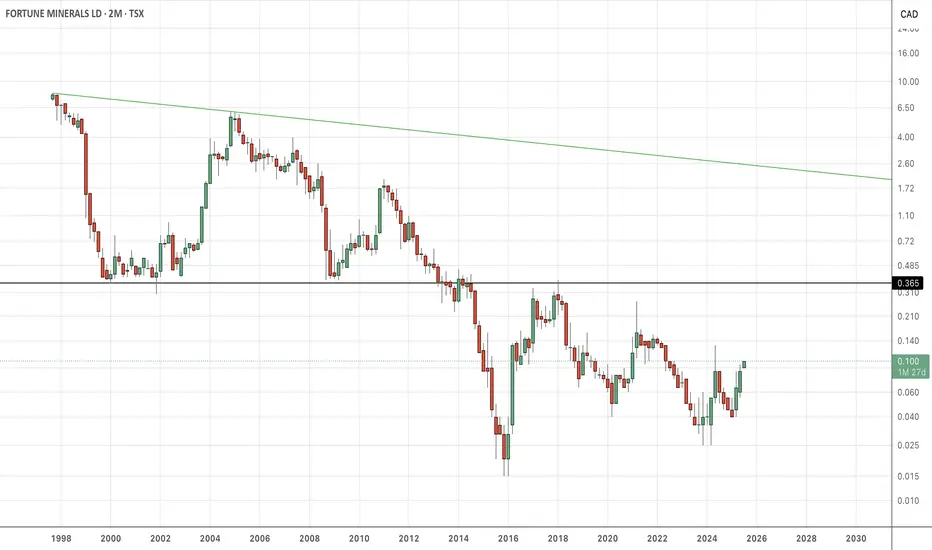
FortuneHere's the linear overhead in the rear-view mirror. The old rules no longer apply. New rules are no resistance until a twenty-five cent pivot, but really no resistance until it hits the Log overhead at $2. You think it's not going to go for $2? Watch.
Ascending Triangle With Breakout Incoming?📈 Ascending Triangle formation (bullish)
🔥 MACD crossover above signal line, bullish momentum gaining
✅ RSI at 61, showing strength but not overbought
📊 Watching for volume confirmation on breakout
Plan: Wait for daily close or strong intraday breakout above 160. If it confirms, this could be a strong swing setup. Watching closely!

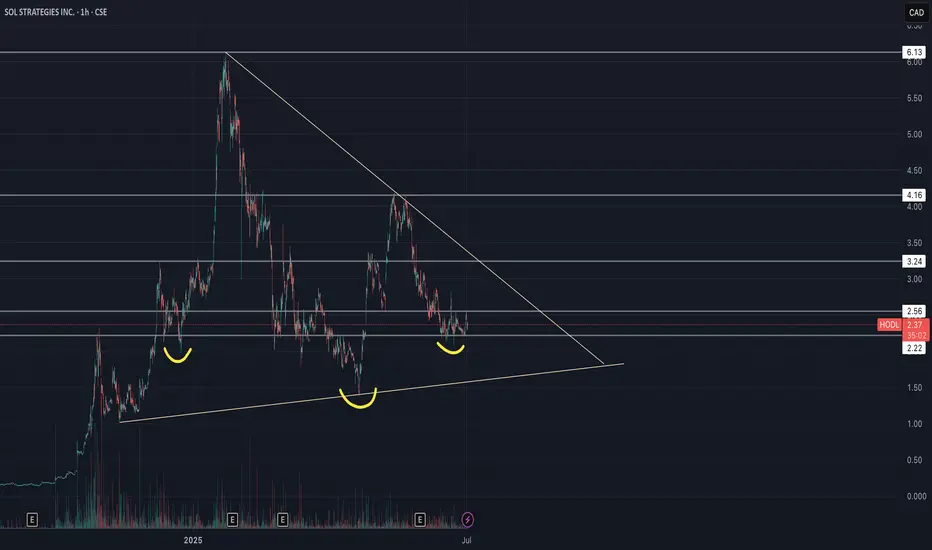
Sol Strategies Inc (HODL) - Inverse H&S🚀 SOL Strategies (HODL) – Public Market Gateway to Solana Yield
SOL Strategies (CSE: HODL) is a publicly traded company laser-focused on the Solana ecosystem. With nearly 395,000 SOL held (most of it staked) and over 3.7 million SOL delegated to their validators, they generate consistent income through staking rewards and validator commissions.
Their business model is simple:
📌 Accumulate SOL → Stake it → Run institutional-grade validators → Earn yield
📌 Expand through partnerships (3iQ, Neptune, BitGo, Pudgy Penguins)
📌 Hold strategic Solana ecosystem tokens like JTO and jitoSOL
📌 Operate with SOC 2-certified infrastructure and pursue a Nasdaq listing
SOL Strategies is not just holding crypto – they are building core infrastructure for Solana, giving equity investors direct exposure to staking economics in one of the fastest-growing blockchain networks.
📊 For traders: HODL stock offers a pure-play vehicle for Solana exposure, with an income-generating twist.
⚠️ Always do your own investment research and make your own decisions before investing.
Long Kraken Robotics PNG.V as Wave 5 unfoldsHere triangle is going to end its formation very soon and a break to the upside is expected to unfold the green wave 5.
Triangle is a type of correction that always precedes the final movement in the larger trend.
If assume that wave 5 will be the same length (as waves 1 and 3 are equal in length), the price will go above 6 CAD.
