CJR.B short term target (100% profit!)This is my idea for short term target of CJR.B : Once the price breaks out the the blue line, it will have potential to go up until the green line.


NEO!! Sometimes you don't have a large enough position and the gains seem irrelevant...they aren't. All gains are gains. I'm here in a very small way...wasted my capital elsewhere. This is a multibagger in 10yrs

DIAM long term targetsThis is my idea for long term targets. Once the price breaks out the the trend line, it will have potential to go up until the mentioned targets.

FOBI short term target (100% profit!)This is my idea for short term target of FOBI. Once the price breaks out the the blue line, it will have potential to go up until the green line.

Can DBM reach $9 range?I'm not a technical analyst, but have been observing this stock for a while.
It dipped after dividend payout as expected by speculators, but quickly recovered to the pattern.
Meanwhile, waiting for it to escape the flag so it goes up (hopefully).
Please let me know how you feel.

HML will go to 3 Billion marketcapI have done extensive research, and based on the industry sector, and the range in which these companies are worth when striking a sizable find. Ranges from 1 to 15 Billion Marketcap.

Silver Tiger False Breakout? I think Silver Tiger is having a false breakout. However, the chart below comparing its value relative to gold is telling a different story.
Im looking at 10c to 12.5c entry.

Breakout from descending wedgeVolt share price breaking out from descending wedge among recent good news that they've lowered their all-in sustaining LCE production to <$3000/tonne (this is much lower than other projects, such as Thacker Pass).
Their Rainbow Lake project NPV is $1.5B, but that is effectively the tip of the iceberg for this company, as Rainbow is just a blueprint that can be applied anywhere. They plan to be the first commercial producer of DLE. I am very bullish on this stock.

WCP ready for a rallyWhitecaps resources have cleared a valid supply and depicted appetite to move higher as shown with tightening flag pattern. Targeting the next KPOI as an initial target anticipating bullish momentum to clear bullish ranges on the move up.

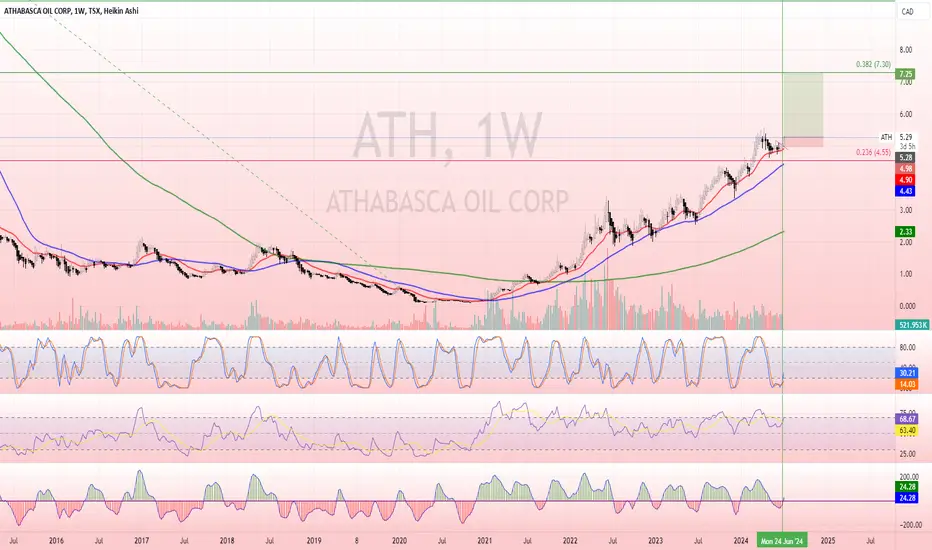
ATH LongLooking for a ride up to the 382 Fib, been watching this one a long time waiting for the consolidation to finish, left a long stop to give it wiggle room. SL will be moved up weekly.
Galaxy Digital.Galaxy Digital Holdings Ltd. is showing strong potential for growth, supported by its solid financial performance and strategic expansion in digital asset management and mining. While the current technical indicators present a mixed sentiment, the overall long-term outlook remains bullish. Investors should consider entering a long position if the price confirms an upward trend above the 10-day EMA, with a well-placed stop loss to mitigate risks. For those considering shorting, monitoring the price action around the 10-day EMA and setting a conservative stop loss is advisable. With the company's aggressive growth trajectory and favorable market conditions, Galaxy Digital remains a compelling investment in the crypto space.
1-Year Price Target:
Average: CAD 19.97 (+27.01%)
Max: CAD 23.01 (+46.34%)
Min: CAD 17.98 (+14.36%)
Long Position
Point: CAD 15.75 (just above the current price to ensure confirmation of upward momentum)
Target Price: CAD 19.97 (27% upside potential)
Stop Loss: CAD 14.05 (just below the 100-day SMA to minimize loss)
Short Position
Entry Point: CAD 15.68 (if price drops below the 10-day EMA indicating a potential downward trend)
Target Price: CAD 13.75 (next support level based on Fibonacci retracement)
Stop Loss: CAD 16.50 (just above the Ichimoku Base Line to prevent excessive loss)


ACB ready to climb !!?#ACB, a cannabies stock, seems all set to cross recent high after making base Round $6 . MACD divergence says it all. Looking for 12 to 15 range as first tgt.

RUA LongRUA has broken through the 236 again, watching here to see if it can hold, will target the 382 and 50 if it holds. Gold miners across the board have rallied, but of course watch the price of Gold.

NRX - Nurexone trend analysis since bull run commencing in 2023Having a look at Nurexone trends alongside Point of Control & Ichimoku Cloud indicators. Current bullish pennant formation detected following a successful Downward Wedge.
*Next move: Trace Fibonacci retracement, indicate loss % between ATH and support levels, future projections

Looking to 6.80 for entryIf we get a dip to confirm this channel I would be ok with jumping in at 6.80 - Bit of a risky position as SGY doesn't make money yet but they are close to their 50/50 debt ratio. The dividend is getting stronger but is nearing its ceiling

DMGI Hidden Bullish DivDmgi just formed a hidden bullish div on the weekly time frame. Bollinger bands are also getting very tight. Has a higher probability to shoot up rather than down. TA would be invalid if weekly candle closure happens beneath 0.485 price mark. Should give atleast 10% minimum gains if one decides to take a position.
Not financial advice. Follow at your own risk and after conducting your own due diligence.

Bombardier ~ 160-180After a multi-year downtrend, Bombardier is headed for a correction, in the form of an ABZ zigzag pattern
In a positive development, the target is in the range of 160 to 180

I80 Gold Corp Setup!Just keep on eye for this one! Has the potential for a large pop off given how long it's been retracing, signs shows bears are losing the momentum.
Targeting $3 on this trade - 6 month time frame.
AMEX:IAU
AMEX:IAUX

IAU.TO / IAUX (U.S.) Perfect for Bottom FishingDo your own due diligence: this is set for takeoff. All ABOARD!
@IAU.TO

DBM at bottom of 2-year-long bullish channel4 consecutive higher highs
4 consecutive higher lows
all since June 2022
I like the look of this one
and I believe in the company too (Canadian Lumber)

GLAD, LONG, it's a fire sale. GLAD, the management is top tier, the high grade ore, it's no question these guys are on the right track. So why not buy while it is on a discount.
