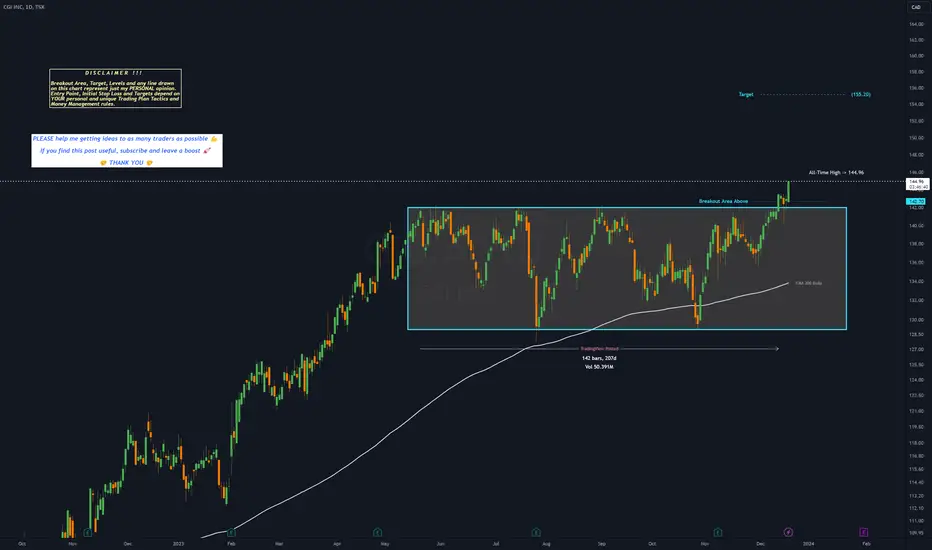
GIB.A - 7 months RECTANGLE══════════════════════════════
Since 2014, my markets approach is to spot
trading opportunities based solely on the
development of
CLASSICAL CHART PATTERNS
🤝Let’s learn and grow together 🤝
══════════════════════════════
Hello Traders ✌
After a careful consideration I came to the conclusion that:
- it is crucial to be quick in alerting you with all the opportunities I spot and often I don't post a good pattern because I don't have the opportunity to write down a proper didactical comment;
- since my parameters to identify a Classical Pattern and its scenario are very well defined, many of my comments were and would be redundant;
- the information that I think is important is very simple and can easily be understood just by looking at charts;
For these reasons and hoping to give you a better help, I decided to write comments only when something very specific or interesting shows up, otherwise all the information is shown on the chart.
Thank you all for your support
🔎🔎🔎 ALWAYS REMEMBER
"A pattern IS NOT a Pattern until the breakout is completed. Before that moment it is just a bunch of colorful candlesticks on a chart of your watchlist"
═════════════════════════════
⚠ DISCLAIMER ⚠
The content is The Art Of Charting's personal opinion and it is posted purely for educational purpose and therefore it must not be taken as a direct or indirect investing recommendations or advices. Any action taken upon these information is at your own risk.
A nice looking base continues for Outcrop!A base has been building for 5-6 years while some diagonal lines are starting to squeeze this base. If we see 50 cents again -- then expect much higher prices shortly thereafter.

FFH is going to bounce like a basketball! H&S pattern too!It appears as though FFH is showing two alternatives, an H&S breaking down, or, sideways trading in a horizontal channel, with a breakout likely happening early 2024.
A horizontal channel is a neutral chart pattern that marks investor indecision. Buyers and sellers fight, and it is only at the exit of the horizontal channel that they agree on a direction; either there are more buyers than sellers or there are more sellers than buyers; hence the strong force of the movement at the horizontal channel’s exit.
This train has left the station.

TargetsWe should wait for a breakout. If it is occurred the price will go up to 0.200$ and if this level is broken the price could touch 0.340$.

Similarities between MJ & Mushroom Markets - There are alot of similarities between mushroom and Mj markets - pop offs and cool downs. currently alot of distractions from this market, but should have big opportunities going from $3.00 to $20 in the next two years

📈 BUY SETUP ON CPCP has created a pattern and has broken out for bullish up side.
Manage your risk and take profits at target levels!

European Energy Metals Corp. trend analysisEuropean Energy Metals Crop. a Lithium and rare earth miner that has a strong trend

Long entry detectedIf price were to drop again around the low 100s again id suggest a long entry to a price target of 135-140. The need for time sensitive premium overnight air cargo services is now.
this company has been recently added to new fund made up by 30 companies from north americas three nations, Canada, United States and Mexico. tied together through the USMCA trade pact and seeking to take advantage of nearshoring.


$43 targetBased on the performance of the last bull market for precious metals, I peg a target at $43. This may be conservative, as the company has less competition that it did in the 2000's.

BITFARMS #BITF did you buy?I know I told u to buy #BITCOIN miners
not #BTC
the miners will make u the money in a bull run
still got multiples left in it.
how many multiples left in bitcorn
2.5X? 3X?

HWX: Buy PotentialTechnical target around 7.6 USD, analyst target at 9.5 USD. Areas plotted to look out for, combined with daily and weekly moving averages.

TVE: Buy PotentialI'd see Tamarack Valley Energy have potential reversal point around these levels. Expecting a break/retest if this fails. Areas plotted to look out for, combined with daily and weekly MAs to be used as S/R confluences.

Potential Long on ITR
ITR is currently in a descending wedge with bullish RSI divergence. Wait for a break of upper trendline for entry, stoploss below last swing low and will be moving SL to BE when safe to do so.

ADDITIONAL CNR ENTRYWe are following the original idea perfectly. With last weeks close we have confirmed a bullish bias. Great time to buy for a pump all while still collecting dividends.

Spartan Delta Corp. TargetsRSI turning to bullish trend, strong support levels below, and positive analyst sentiment makes me believe Spartan Delta Corp. could be a good buy with a first target of 3.66 CAD.

Long trade to $0.35-0.40 (CAD) and watch for higherNevada Lithium Resources continues to add to and refine their economics. Recent drilling show a dramatic increase in Li-ppm (approx 2x) in their minable zone, and the team is now testing for Li-bearing brines. The Bonnie Claire deposit was ranked #3 world's largest Li-bearing sediment deposit in the world, and they continue to grow and will likely take the #1 spot with infill drilling.
nevadalithium.com
Current PA demonstrates strong positive CDV and RSI correlating with recent price increase. It is reasonable to expect a rise back to recent highs. This will make the 3rd test of the $0.35CAD resistance level. If and when this level breaks, it could be a blue skies run to $0.71CAD ($150M market cap) and beyond.
Considering their NPV of ~$3 billion USD, a 20% market valuation equates to approximately $2.84USD per share or $3.83CAD.

CHR(Chorus Aviation) Short Term Investing 1I estimate that CHR share will reach a value of 3.5+- Canadian Dollar within one year (3-12 months), this is a increase of 35%+-
Stop loss is around 2.25 CAD
Despite the last quarter earnings release being negative, which is the biggest cause for the share dropping to a 2.36 low, the company still looks healthy, the liquidity still good enough (filled my order with 10 seconds just 0.01 above current market price) and debt still firmly managed.
I guess there are certain factors that need to be considered, I personally do not know the lifetime of planes in Chorus Aviation's fleet, I will do some research if the lifecycle of these planes are not nearing end of service, could be a red flag but otherwise I see no reason why this share won't reach at least 3.50 CAD.
Also at this point its the most deviated from the SP500 trend, very deviated, a reversion might occur.
Book value is more than twice current market value.
Long-term debt to total equity has decreased in the last 3 years and is better than the industry average.
Income covers debt payments.
Profit margin in the green.
Analysts are on average estimating that the share will hit above 4 CAD, the low estimate is 3.3+- CAD
I have bought 2000 shares at 2.64 CAD, that is 3000-4000 dollars, will attempt to hold for one year.
We have a nice double bottom forming.
Share might be oversold.
USA interest rate hikes likely to only increase minimally or slowly from this point if it does increase.
Might just leave money even if stock price goes lower than 2.25 CAD, just shift holding term to 3-5 years

LIFT may be developing a floorLIFT may be developing a floor in the stock the company had news today on mining Lithium in Northwest Territories


NTR(Nutrien LTD) Short Term Investing 1I estimate that NTR share will reach a value of 100+- Canadian Dollar within one year (6-12 months), this is a increase of 30%+-
Stop loss is around 67.00 CAD for one share.
I see the market in general that will likely experience more of a uptrend in one year's time because of the USA interest rate hike cycle ending.
I see Nutrien performing better because of the war in Ukraine stagnating and farmers slowly returning to their crops, alongside a somewhat easing of geopolitical tensions.
The share value is very undervalued or it is at a bargain price.
Analysts are on average estimating that the share will hit above 100+ CAD, the low estimate is 100+- CAD
The company has had a bad year or so in the past, I see a potential bottom.
I have bought 100 shares at 73.70 CAD, will attempt to hold for one year or more or if target price is reached.

Hive hit key support?Hive may have just hit long standing support.. could be a good spot to start a position

WNDR restabilized and trending upWonderfi's 2 standard deviation bollinger band on a 233 SMA pinched within the previous two months. After a positive surprise earnings a few days ago (2023-11-14), the price is now back above the 55 SMA and for the first time above 233 SMA while pushing the upper bollinger band on the 21 SMA. This suggests the price has finally stabilized around the low teens and now moving upwards on both strong technicals and positive news. The next 2-3 weeks will determine if the price will continue to push the upper on the 21 SMA band and if so will target ~0.25 by mid Dec and ~0.30 by Feb '24 or the price will trend horizontally again remaining in the 0.15-.0.20 channel by Feb '24.
Looking a few quarters out, if this company can integrate its recent acquisitions and start to turn a profit it has a chance to rise to the 0.50-0.80 range. Wonderfi currently benefits from a dominant position in the Canadian crypto market having multiple regulated exchanges. Moreover, Wonderfi will continue to benefit from the expected strong inflows into digital assets. However, as more exchanges become regulated in Canada (i.e. Kraken, Coinbase, Gemini, etc), Wonderfi will face tough competition unless it is able differentiate itself to customers and outperform its peers.
