Lion One Metals, Just in production 4000 oz/quarter SOLID 2.00Lion One Metals, Just in production 4000 oz/quarter SOLID 2.00
Solid target from 0.3 to 2 !

FTThe price is above the moving averages, and the moving averages are all stacked bullish. The situation is a royal flush from a technical perspective. You have these long-standing overheads, with the key linear overhead having already been breached. In Log, we still have the 1-level "bear fib" to clear and then land on top of. Once that lifts off, we run into the .236 "bull Fib" (which I have hidden for simplicity). After we clear the .236 bull fib, it means we are truly bullish in FT for the first time in the chart history. Then come's the $.38CAN level, and higher. It in the states here, I'm looking for $2.
This is the first time the price has come to be supported by the moving averages. First time in chart history. The Bollinger Bands are widening. The OBV is near record high levels. All hell is about to break lose.

ERNERGY FUELS TAKE OFFhello, fine ? Me yes, Tahnks god, for the emperor.
Commodities is the next bullrun.
Energy will rise, energy is absolute.
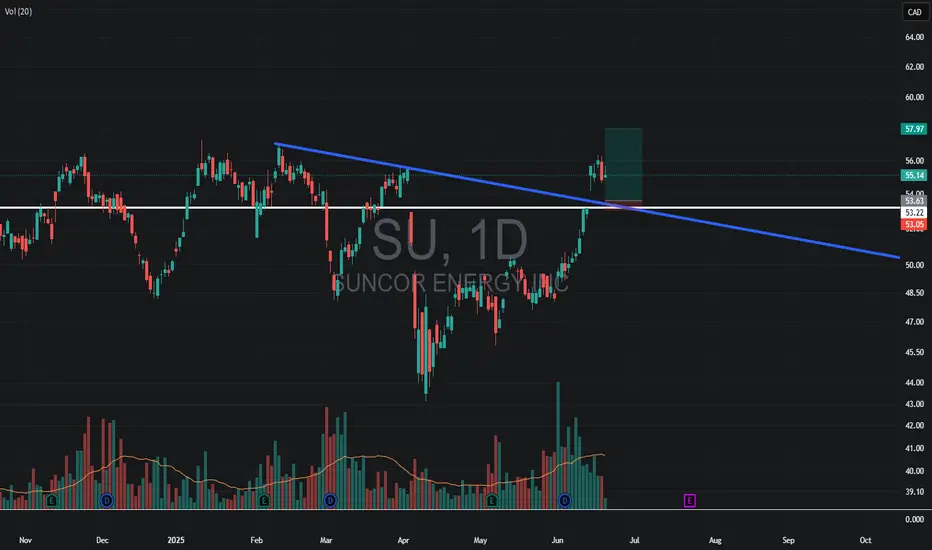
BIG H&S inverted. Target 57 dollars and more. x7 to here.
When enter ? When white line is break.
Look RSI indicator at the bottom. bullish confirmation when Monthly RSI is break

SU on WatchWatching for a pull back
Why:
Gap fill
The price to close the gap lines up with upper channel
Above average green volume on the uptrend
Zac will explode WHEN above 10 cents. If silver explodes above $40 dollars, Zac should explode above 10 cents. If so, 28 cents can be reached.

NDA 1.1 -0.8 BUY TRAGET - INVALIDATION 0/.65Correction in progress. Buy targets 1.1 - 0.8. INVALIDAITON if close weekly below 0.65
TP target : 3.9 5.6 8.4
Gael, for Yahia

***Technical Analysis of the GOLDEN NUGGET TMX Group Limited (X)Fundamental and Technical Analysis of TMX Group Limited (X) 🚀
Fundamental Analysis 🚀
TMX Group Limited, the operator of the Toronto and Montréal stock exchanges, is a key player in the Canadian financial sector. Its role in managing equity markets and derivatives trading positions it strategically, supported by steady growth and a diversified range of services.
Recent financial reports highlight increasing trading volumes, especially in derivatives, reflecting growing investor interest. The company continues to show strong organic growth, with rising revenues and an expansion of its business, particularly through its VettaFi division.
Technical Analysis 🚀
The technical chart for TMX Group reveals a solid upward trend, with a current price of 56.16 CAD and sustained growth momentum. Technical indicators show a positive outlook, with upward-moving averages and increasing trading volume.
- Target Sell Price: 63 CAD – This level represents a realistic target based on historical trends and growth projections. A breakout above this point could signal further appreciation.
- Key Support: Previous support levels have demonstrated strong demand, potentially offering buying opportunities in case of a temporary pullback.
Conclusion 🚀
TMX Group Limited presents strong fundamentals and technical indicators. With a 63 CAD target sell price, investors can monitor market signals to optimize their strategy. Revenue growth and business expansion reinforce confidence in the stock’s bullish potential.
If you want to refine this analysis or explore other scenarios, I'm here to dive deeper into key points! 🚀 Subscribe! TSXGanG
I hold a CCVM and MNC (Certificate of Competence to become a securities broker anywhere in Canada) and have been working as a trader for five years.
It’s a pleasure for me to help people optimize their trading strategies and make informed financial market decisions. Thank you for subscribe! 🚀

Fortune MineralsFT is primed to pamp back to $.25USD. Price is consolidating at the .786 "bear fib", and is being compressed under what I believe is a kind of inverse parabola. We shall see, but a return to 1-level bear fib, and $.25 is a fait accompli.
I hate to see guys bailing right as the party gets underway. You sell, and it pumps 16% the next day. That's how it's going to be.

Ivanhoe Mines - a 50% discount opportunity !The share price of this mining monster has suffered a 50% price decline in the last 6 months.
One of the main reasons for the share price decline is the suspension of underground operations at the Kakula mine due to seismic activity. This suspension has led to a withdrawal of production and cost guidance for 2025, causing investor uncertainty and a subsequent drop in share price 1,2,3 Additionally, the company has faced challenges with its smelter, including a fire that damaged onsite generators and caused a three-month delay in commissioning. These issues, combined with power constraints and grid instability in the Democratic Republic of Congo (DRC), have contributed to a more conservative production outlook.
However there are lots of positive catalysts for Ivanhoe Mines: the upcoming rise in precious metal prices, especially the wake up of the severely undervalued PLATINUM prices.
Platreef PGM project in South Africa contains 7 million ounces of gold (0.25 gpt) and 50 million ounces of AuEq. About 90% of annual production (1 million ounces) will consist of PGMs (platinum group metals), making it the largest PGM mine in the world ! Platreef is expected to have low all-in production costs, though more precise figures will become available after the ramp-up phase, scheduled for the second half of 2025.
Platreef PGM, Kakula-Kamoa (massive copper mine, the largest high grade mine globally) and Kipushi (a high-grade zinc operation); With all three of their mines expected to be in production, 2025 could be a pivotal year for them.
Chart wise, the price is still rising in a long term rising wedge. Price just found support on the lower resistance and is bouncing strongly. OBV on balance volume is still on a steady rise. I own Ivanhoe Mines since I got in at sub 1$ (thanks to Rick Rule's reccomandation - God may bless him). and I am not willing to let go before we reach 50$, which is my long term target.


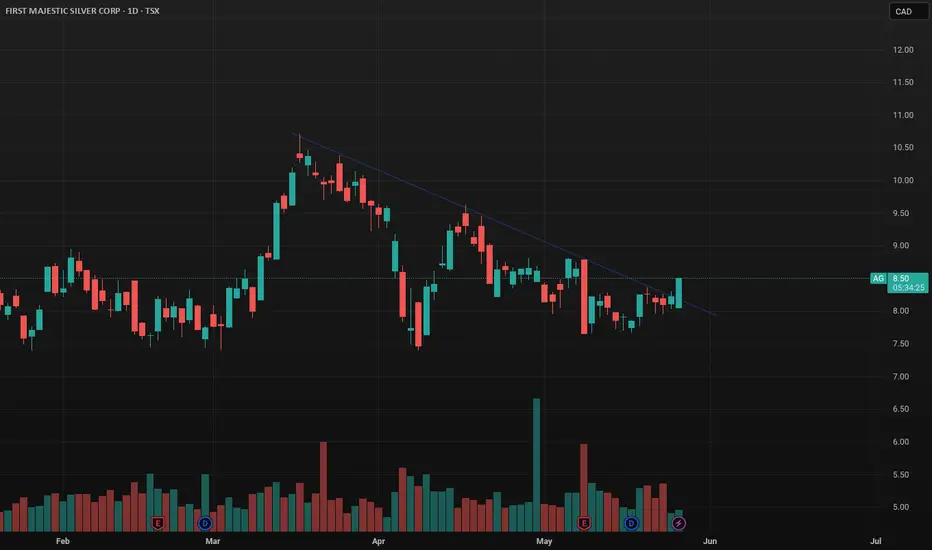
AG just broke wedge pattern.As yo can see AG just broke wedge, Silver also over 34 adn new discovery yesterday.

AG just broke wedge As you can see AG just broke above wedge pattern. Silver price also above $34. This will be very interesting how it plays out

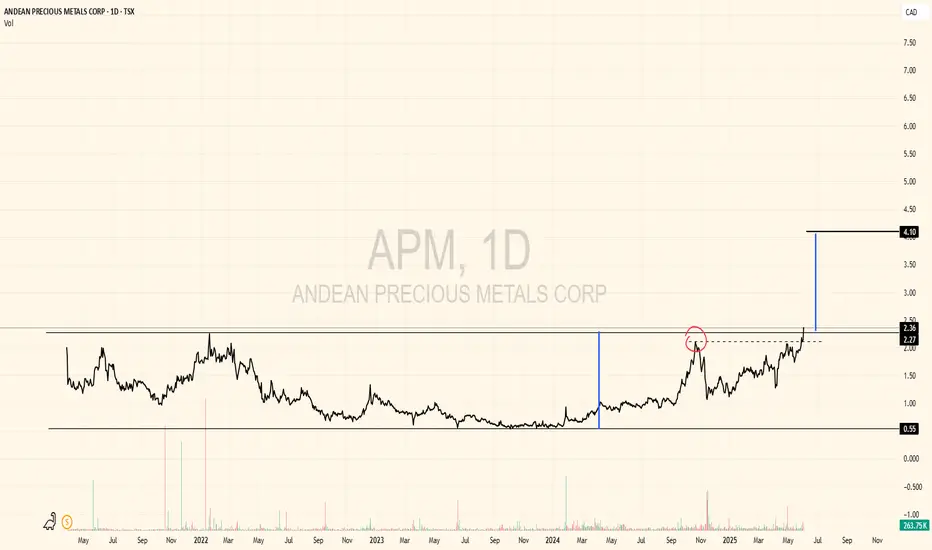
Measured-move target $4?After a massive base like this, and the macro lining up positively for this name, I think an initial $4 target as a result of the huge inverted head and shoulders is very likely.
What comes up must come downIt is going up on news of further cooperation with a company. As we have seen before, it goes on up on good news then people forget and it goes back down. Buy on the dip, do not buy now at 100% rise from the bottom. Buyer beware now

First Majestic Silver is breaking out todayFirst Majestic may be breaking out today from a trend that started on March 18, 2025. Good volume on the hourly time frame for that pump.
Canopy Growth: Further UpwardThe WEED stock has already realized considerable increases during the current green wave B, which we credit with even more upward potential. However, we primarily expect the top of this movement to be marked below the resistance at C$3.11, and subsequently, the price should move deeper into our magenta Target Zone between C$2.96 and C$0.90 to complete the larger wave ii in orange. The following wave iii should then lead WEED out of the magenta zone and peak above the mentioned C$3.11 resistance. If the stock already rises above this mark during the current movement, we will have to assume that wave alt. ii in orange has already concluded (probability: 37%).

AAV $13.2 TPSeeing a potential breakout at this $11.15 level. I'm expecting a run to at least $13.2 in the coming week(s)

BB 40$ jan / feb 2026 ?
Back to 17/20$ ( bottom around summer 2027 )
On to test ATH , make a cup & handle pattern on the way ?
Copied pattern from last run to ATH , seems to line up pretty decently.

Riverside Resources: Value Dislocation from Upcoming Spin-Out?RRI is down over 30% this week, despite no negative news. This may be a classic case of value dislocation ahead of a corporate event.
📦 What’s happening?
Riverside is spinning out its Ontario gold assets into a new company, Blue Jay Gold Corp. Every RRI shareholder will receive 1 Blue Jay share for every 5 RRI shares held. These new shares are expected to be listed soon.
🧠 Why it matters:
Spin-outs often unlock hidden value by allowing each entity to focus on a clear strategy. The market sometimes misprices the parent company temporarily, creating an opportunity for informed investors.
📉 The recent decline could reflect:
Confusion around the transaction;
Weak hands exiting during the restructuring;
Lack of immediate liquidity for the spin-out shares.
⚒️ Riverside retains multiple strong projects in Mexico, significant working capital, and a royalty on Capitan Silver’s asset — another successful spin-out.
📊 With a market cap of only CAD $16.8M, the risk/reward appears skewed to the upside, especially if technicals confirm a reversal.
🔍 Worth watching as Blue Jay listing approaches. This setup reminds me of other profitable spin-out plays in the junior gold space.


Analyzing the Phenomenon of Crypto Investments through Meme CultIntroduction
Memecoins constitute a unique subcategory of cryptocurrencies that developed not out of technological necessity, but from internet culture. Despite lacking groundbreaking features, they’ve become a multibillion-dollar market niche.
Key Features
Lack of Utility: Most memecoins don’t provide technical innovations like smart contracts or custom blockchains.
Social Capital: Their success hinges on influencer hype and community memes. Dogecoin, for example, soared after Elon Musk’s tweets.
Virality-Driven Growth: Their market behavior mirrors internet trends — sudden and unpredictable.
Market Statistics
Dogecoin hit over $80 billion in market cap (May 2021).
Shiba Inu grew more than 40,000,000% in 2021 alone.
Risks and Outlook
Volatility: Pump-and-dump schemes are rampant.
Regulatory Risk: Projects with no real utility may face SEC scrutiny.
Media-Dependent: Without hype, memecoins can quickly lose value.
Conclusion
Memecoins function more as speculative instruments than serious investments. However, they offer insights into retail investor behavior and internet-driven financial phenomena.

TELUS CORP FOR LONGMarket structure, new bullish trend, entry into SMT according to the W chart pattern, bullish weekly timeframe, seek entry and financial risk.

Barrick Gold Corporation ($ABX): Golden Opportunity or Risky
Barrick Gold Corporation (ABX): Golden Opportunity or Risky Prospect? 🏆💰
1/10
Barrick Gold TSX:ABX has seen a solid financial performance recently. EPS for the last quarter hit C$0.42, with next quarter estimates at C$0.63. They beat estimates 75% of the time in the past year. 📈
2/10
Analysts are bullish! The average price target is C$33.57, implying a potential upside of 50.13% from the current C$22.36 price. Strong Buy ratings dominate: 10 Buy, 2 Hold. 🔍 What do analysts know that the market doesn’t?
3/10
However, ABX is facing operational challenges. A suspension in Mali due to government intervention highlights geopolitical risks in mining. 🛑 Regulatory challenges are part of the gold mining game.
4/10
Stock price check: ABX currently trades at C$23.15. That’s 20.94% below its 52-week high of C$29.28 but 21.59% above its low. What does this tell us? Room for recovery, but risks loom. 📊
5/10
Valuation time! Compared to sector peers, Barrick offers an attractive price level, especially given the 50% upside target. Analysts love undervalued plays like this, but what about the risks? 🤔
6/10
Strengths: Barrick operates across multiple countries, ensuring diversified production. That’s crucial in a volatile gold market. 🌍 Diversification is a key defensive strategy here.
7/10
Challenges: High operational costs are always a concern. Pair that with political instability, like the Mali suspension, and ABX faces a steep uphill climb. 🏔️ How much risk are you willing to take on?
8/10
Opportunities: Expansion is always on the table. With gold prices looking stable, Barrick could capitalize on new projects or mines. But timing matters in this market. ⛏️
9/10
Threats: Regulatory and political risks never sleep. Changes in mining laws or political unrest can hit Barrick hard—Mali’s situation is a prime example. Always know your risks. ⚠️
10/10
What’s your take on Barrick Gold TSX:ABX ? Will it strike gold again? Vote here! 🗳️
Buy for the long term 📈
Hold and watch growth 🔄
Too risky, avoid 🚫
