Curaleaf: Setback for a Comeback 🌪️The price of Curaleaf has set back significantly since its impressive rise in September. Soon, however, it should continue, as the price has now reached the green target zone between CAD 5.50 and CAD 4.33, where we locate the low of the green wave 2. Following the low, there should then be significant gains again with the further green five-wave move, reaching CAD 12.

CVE BUYHi, according to my analysis. CVE stock. There is a very good buying opportunity as the stock has broken the downward trend. It also breached the sideways channel and the resistance at level 24. good luck for everbody

Pushing into a Point Plan BThesis:
-Top of Channel
-Inside Distribution Zone
-After a sizable markup
-LowCap Stock
GNG: 24h
-Breaks support
-2 Entry Short
...

Pushed into a point!Thesis:
-Upward to a channel or possible break
-Markup phase several months
-Good earnings
-Testing and rejected sup
GO no Go: 5m
-2 entry
-signal bar
...

$AC Long buy Alerts SetPatience pays off.
Looking to average down during a consolidating down trend.
This is not a quick play - looking long term. 12-18 months.

Watching Lab into the fall. This is a pretty beat up Junior Miner.
I'm watching for either a dead cat bounce, or legitimate breakout.
I'll be starting a position between .13 & .145.


SPLY: Safe Supply worth a bet"Safe Supply" or "Company"), the first company investing in and incubating companies at the forefront of the third wave of drug policy reform. It is currently placed where the mushroom companies were and the weed companies before them. Looks worth a bet long to me


Undervalued Bitcoin minerCBIT is lagging the Bitcoin bounce. In historical support area (.09 - .10) with Bollinger Bands squeezing. Increasing volume. Prone to sudden moves.

FT Fortune MineralsHi, it’s is “FT” chart converted to USD. Monthly candle close engulfing on Rio Tinto collab news is a good sign. The timing of it is right off of the zero level “bull fib” - which is my projected fib channel for the upcoming bull run. The chart to date has been net bearish, but now that the mine seems to have govt. support, I believe our first bull run is here. I own over 3.5 million shares. Let’s go!

GOLD MINE-Expansion GEM, ABX: The WAVE-EXPANSION Will be Epical!Hello There!
Welcome to my new analysis about a Major Gold-Mine Gem I recently spotted forming worthwhile underlying dynamics that have the potential to transform the whole chart price-action into a massive expansion-dynamic to elevate the volatility to levels not far from the moon. Gold has been around for several thousands of years and with gold also the exploration that already created many historical expansion-waves in which gold mines and exploration facilities could expand over 1,000-4,000% in the shortest period of time. Especially, when new explorations proceeded in territories where gold has never been explored before making the source of a continued worthwhile exploration even greater.
The Glorious Past of Gold-Mine Stocks and What Can be Derived From it For Today:
Today, a time has emerged in which a gold-backed currency system could emerge again similar to the gold-backed systems and trademarks in the 20st century. Such a implementation of a gold-backed currency system is going to accelerate the exploration of gold massively and especially in such times where more and more gold is being explored this will be a transformational expansion act for companies like ABX, Barrick Gold Corporation as the gold-backed system needs to find the sources of gold to back the legal tender capital. This will be available in the mining facilities and when a large demand meets a not fully maxed out supply this will be a huge driver of price-expansions towards the upside.
The Implementation of a Gold-Backed Currency System and the Effects on Gold-Mine Stocks:
If a major gold-backed currency system is going to be implemented as there are many plans to this currently this will raise the demand in gold exploration literally over night and only out of this perspective it is going to setup the structure for a massive volatility expansion-wave for gold mining exploration stocks as only a small demand-increase even in a moderately sized economy-field it is going to raise the market-cap of exploration stocks to levels not seen since the gold bull-market with the peaks in 2011. Many conversion of the fiat currency into the gold-backed currency are going to drive the price of a the stock massively.
The Massive Price-Expansion-Potentials to Accelerate With a Gold-Backed System Implementation, Technical Chart Price-Action:
Considering the chart price-action now Gold moved on to form several important dynamic in this whole structure. Firstly it created a gigantic descending channel-formation with a momentous inverse head-and-shoulder-formation forming coherently within the channel. This is from where the gold exploration gem had the origins bouncing both within the lower boundary of the channel and the lower boundary of the inverse head from where the price-action already bounced to solid levels and is now boiling up for a much larger move and breakout dynamic to accelerate the price-action into expanding spheres.
What is so important here in this whole chart is the fact that the price-action is already greatly bouncing above the 20 level where several important indications have their origins. The most important indiciation of this level is the fact that within this level the major Golden-Ratio Trend-Acceleration-Bounce-Zone is allocation. This zone is the zone between the 50% and 61.8% Fibonacci-Level as it is marked in my chart. Especially, when the new gold-backed currency system is going to be accelerated in the implementation within the next times the breakout of the inverse H-S-Formation as it is marked in my chart will be almost inevitable.
Prospects and Previsions of a Gold-Backed Currency-System Implementation With the Preceeding Price-Action and Transformational Price Level:
The next times will be highly important to watch out here especially when the gold-backed system should accelerate the mining facility production the completion of the first breakout as marked will move on even faster than expected, determining this, what follows once the breakout has emerged are the next accelerations of the price-action into the further spheres till the second breakout and trend-acceleration is going to shoot the price-action to major levels with the targets at at least 302.5-310 as it is marked.
Also the meetings of the economies that are looking to implement the gold-backed system are extremely important to watch out especially when the gold-backed currency is being finally implemented and the demand meets the mining facilities this is likely to transform the price-action into the major expansion-phase. The meetings of those economies will be held throughout the year especially in October to November there are likely to be major news into this direction. Remember, that even the implementation of the gold-backed system in a moderate economic field is going to accelerate the price-dynamics heavily as the demand will be around 140 times more than the present unexplored supply.
In this manner, thank you everybody for watching the analysis, support from your side is greatly appreciated.
VP

Could a Breakout Finally be Near?!?I can't help but wonder if this chart is telling us something?!? It's been a slow grind down, but this positive divergence on the RSI leads me to believe something is about to happen one way or another. As I've said before, nothing happens here without a massive pop in the spot silver price.
STAY TUNED!
Side note: Likely nothing to read too much into; but I visited their website and it's much improved from recent years. Sounds crazy, but sometimes the look and quality of a company (even online) can say a lot about what's to come.

Blue Sky Uranium is getting ready for something BIG!This is looking like a beautiful setup and aligns well with a uranium bull run. Let's keep an eye on this one for the remainder of the decade ;).

Canadian TireA long term possible scenario for Canadian Tire can be labeled According to the attachment chart.The time to reach the goal is the next 4 years

MTAMTA is oversold.
A good opportunity from $4.20 for a 20% swing back to the $5.18 gap-fill.
Starting a position here.
Will add if it drops lower.

Aurora: Electrified ⚡Aurora continues its electrifying trajectory. The price dipped further into its inactive target zone during the last trading week and is now visibly striving to resume the primarily expected uptrend. These efforts should soon yield bullish results. Aurora’s next target, the resistance at C$1.59, lies approximately 60% away. This resistance must be surpassed to grant wave (1) in magenta, its well-deserved peak a bit higher. An intermediate correction is expected to pull the price back slightly.

Update on Enbridge Stock This is just a quick video I have made for some of the followers. For some odd reason I wasnt able to reply, so here are my thoughts out loud.
I havent yet purchased Enbridge stock and waiting for the first to test the trend again and of course the supports mentioned on my video.
Please note that I am not an expert so share your thoughts ideas and let us all work together

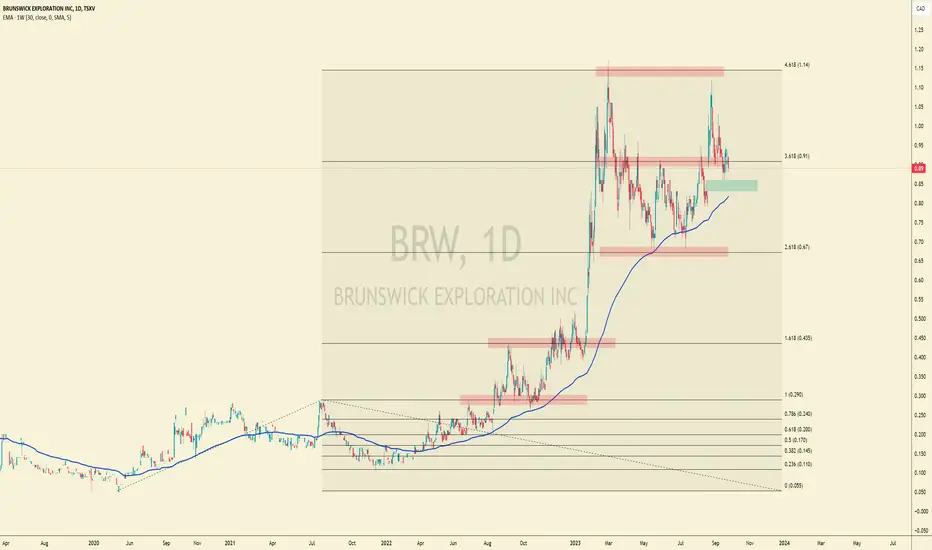
late stage double top collapseThis heavily pumped stock suffered a colossal double top, after hitting that big 4.618 extension.
See my recent BRW.v chart for a similar set up.

whats thisGiven the number of red days in a row here, I think that it's probable to assume that a {double-bottom} may provide a bounce to reverse the trend. If it fails, then one could look for placing a bid at around the $9 mark.
$lun.to


feels good$gato.to looking good, now back above weekly EMA30. Price bounced last week at a point that was a previous resist. Super bullish if it makes a sideways bull flag here.
