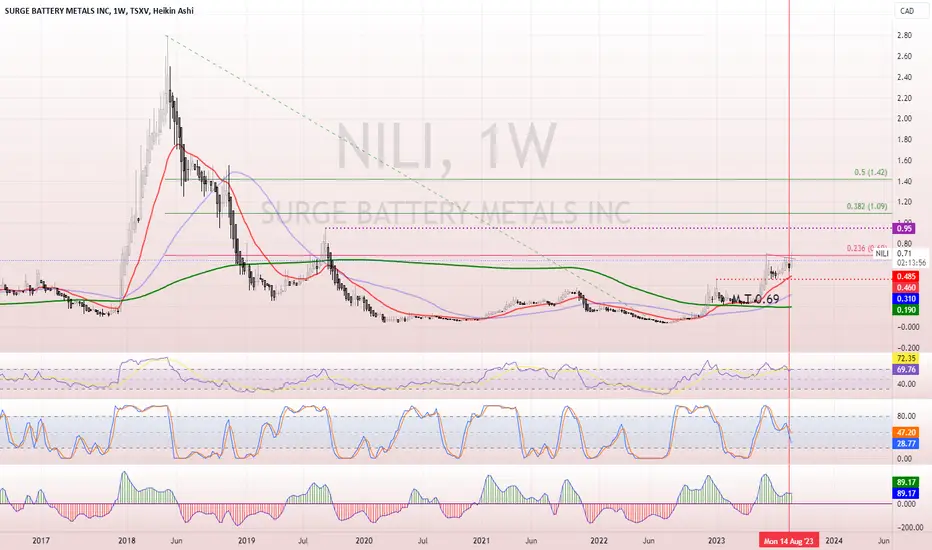
sellers leaving the buildingI just love this chart. Look how each capitulation event is met with max pain for the bears the very next day, many times in a row along that rising support line.
Selling volume is waning. Looks set for a probable breakout past 72 cents next time.

Short TDWeekly bear flag
Weekly 200 week SMA being tested too many times
Weekly under Red Ichimoku cloud
Volume spike at the top of the daily green ichimoku cloud suggesting heavy selling
TP1: Daily level identified
TP2: 100 month SMA

Is RY forming a head-and-shoulders?* Big support between 125-127
* now reaching previous resistance (135) from November 2022
* It broke through this before (February 2023) but retreated back to support.
* Will it rally to a new high or stall out?
Honestly I don't know. Would love to hear your comments.
NYSE:RY TSX:RY

Air CanadaLooking juicy.
Weekly chart shows higher highs and higher lows, and when RSI hits 40, reverses trend from down to up.
Broader marker is the only unknown, and will get in when weekly shows consolidation.

AOI LongWe have held the 236, targeting the 382. My main concern with this trade is the recent high. I've allowed some wiggle room for a retest. Usual stop loss MGMT of taking profit in 3rd's and riding weekly HK candles.

I've got a golden ticket.There is no place I know that compares to pure imagination. Living there, you'll be free, if you truly wish to be.

Risk to Reward Ratio is the key to constant wins at tradingI love writing those articles on my Blog, mainly because I learn from reviewing my trades & secondary for the value it gives back to the trading community.
I been preaching Trading is simple but not easy. It is based on following a winning trade plan. & how do you find such a plan? Try & fail, Try & succeed there is no other way. There is the possibility of a generous soul teaching how a winning strategy & thats what I hope to do in this article. I will share 2 rules
Rule number 1 Always trade the bigger picture.
Find out what the bigger picture chart is doing & trade based on that. In this trade am placing my trade decision in the (W) chart the top chart in white. My bigger picture chart is the monthly (M) not shown. And the chart I use to time my enter & exit is the Day chart (D) below in Black
Rule number 2 Risk to Reward ratio,
This should be rule #1 but I placed it as number 2 to add importance to the rules of trading the bigger picture. Aim for a Risk to Reward ratio of 3 to 5. This means you asses the Risk (how. much money you can loose) before you asses the Reward (how much money you can win).
In this trade, the bigger picture chart (M) is in a downtrend. The trading chart (W) comes into untested Supply Zone (SZ) with a Risk of less than a dollar. I take my SHRT in the red Circle
The reward is 4-5 dollars per share, mostly due to a price free fall zone, with little Demand zone (DZ) to challenge the price. I took profit at two point marked by the red X in the Daily chart.
There are odd enhancers as to why I took this trade, but they are outside the scope of this blog. If you like to learn more about my winning trading strategy that I been practicing for 11 years. Follow my Blog & learn to trade smarter.

Marijuana Stocks Running, is BLO next?Marijuana stocks have been ripping lately.
There's a correlation between MSOS and Cannabix Technologies.
Will the next boom happen with the marijuana breathalyzer stock?

AE at challenging levelWatching here to see is AE can break through this level. MA's are there for support on 4 hr.

BHCA little sideways still on the 4 hour, watching here to see if we can get moving, 4 hour STOCH RSI alarm set.

Curaleaf: Rocket launch 🚀Curaleaf's stock price has experienced a rapid increase, surpassing the resistance level at C$5.68. It appears highly likely that the stock is currently within the orange wave iii, which is anticipated to extend beyond C$8. However, this upward movement might not be as meteoric and could follow a more gradual trajectory.

Neo Battery Materials uptrend Neo Battery Materials is on a strong uptrend the blue arrows is giving a buy signal


SOUTHERN ENERGY - Value Investing In Small Cap Co.This is a chart analysis based on history and news. This is a great small cap growth company which has invested in texas area collaboratived with Energy Co. It is supposed to sell through a new built natural gas pipeline and the long high priced oil will bring this company to the first line of earners! Check this out! Do your DD

How do you like them channels?Strong channel from the pandemic lows. Not getting the volume yet, but this may be early. Key is the 55 EMA as it has been strong support along the way. Not oversold daily and running sell divergence monthly. Shorts in this market need to be choosy but this wouldn't be the worst choice.

Telus WEEKLY VOLUME PROFILE Touched! UP WE GO 🚀 Updated I will be buying more shares tomorrow. It will be just rounding it up and then DCA if/when it touches the green lines (POC lines) under the white line ( My average cost)
I expect it to go up from here for a couple of weeks. This may take a year to play out to reach these two red lines. One is a POC line within the golden range using Fibonnaci and second is simply another area I will DCA out if I still have shares left and judge that it can keep going up.
Expected profit from doing this trade after a year from aug 3 is near 25% + dividend of 5-6%. Total expected reward after a year, 30% from current average price.
Max time horizon to reach ATH if green lines are reached: 5 years. But it can happen sooner. This is worth holding onto for that time period. Especially for long term investor who enjoys 5-6% dividends.
Happy trading and investing.

Telus Volume profile tested. Up we go!I suspect we have reached the bottom here. Time to accumulate and hold on. I will decide later on when it's time to sell. But some TP areas can be the 200 MA and DCA out from there in section each time an exit trigger is met. I expect a 30% gain from here on out within a year.

Oversold Bitcoin miners is poised for a breakoutWith Bitcoin reversing from oversold conditions on favourable court ruling for Grayscale ETF, this BTC miner is poised for a big move. It was at .20+ when Bitcoin was at 30K.

Canopy Growth: C'mon, Do Something 👉The price of Canopy Growth is currently relatively flat. However, we believe a significant setback is needed to complete the white wave II in the turquoise target zone between CAD 0.430 and CAD 0.265, as expected. Only then should a significant move higher occur in the form of the turquoise wave 1, which should extend to around CAD 1.20. Alternatively, we see a 47% probability that the price is already in this wave. This scenario would occur if the price breaks the resistance at $0.8000 without reaching our target zone

CNQ - 10 months HEAD & SHOULDERS CONTINUATION══════════════════════════════
Since 2014, my markets approach is to spot
trading opportunities based solely on the
development of
CLASSICAL CHART PATTERNS
🤝Let’s learn and grow together 🤝
══════════════════════════════
Hello Traders ✌
After a careful consideration I came to the conclusion that:
- it is crucial to be quick in alerting you with all the opportunities I spot and often I don't post a good pattern because I don't have the opportunity to write down a proper didactical comment;
- since my parameters to identify a Classical Pattern and its scenario are very well defined, many of my comments were and would be redundant;
- the information that I think is important is very simple and can easily be understood just by looking at charts;
For these reasons and hoping to give you a better help, I decided to write comments only when something very specific or interesting shows up, otherwise all the information is shown on the chart.
Thank you all for your support
🔎🔎🔎 ALWAYS REMEMBER
"A pattern IS NOT a Pattern until the breakout is completed. Before that moment it is just a bunch of colorful candlesticks on a chart of your watchlist"
═════════════════════════════
⚠ DISCLAIMER ⚠
The content is The Art Of Charting's personal opinion and it is posted purely for educational purpose and therefore it must not be taken as a direct or indirect investing recommendations or advices. Any action taken upon these information is at your own risk.

ISO longOne to watch. Still has a bit of work to do. Squashed between the 200wkly and heavy resistance. Has captured the Daily 200. Watching for it to break and hold the 236.

TD at resistanceLooks good for entry if we can hold the 236 - capture the 200MA and get through the trend line.
Fairly plan sailing!
