The infamous Trend Reversal Trade The Trend Reversal Trade, can it work? I have been trading the market for 10 years & the statistics in NOT in your favour, this type of trade has a low probability & trading is a game of stacking the probabilities in your favour. this is to be distinguished from investing; which is a whole different game.
Back to the infamous Trend Reversal Trade. This is the trade where most average home managed investors loose their money.
Lets put this into practice. Imagine following: A good name stock price is over
selling or maybe crashing with over balanced selling right into a demand zone. like WEED in this example on a (W) chart.
The investor buys a LNG position & thinking he purchased a Good company stock for a good price,
isnt that what balance & income sheet based fundamental trading teaches.
Now, all one have to do is wait for the trend to reverse price goes up & big profit. expect that a big pay off does not come, hope is mislead by a bounce in price due to the demand zone. before the prevailing trend continues its down fall beyond your ENTR price, the emotions kicks in & you are in the red profit zone.wtf.. I hope you had a stop loss in place. If you are following me those far, those trades are dangerous..learn from my many mistakes..Fuc*king Hope
What was my mistake? expecting a DZ to reverse the dominant trend & while this does frequently happen, and it is how market is created. but the futility is in the assumption that you can gauge the top or the bottom before the trend changes. I learned to wait for the trend to change without me then i ride the new trend. much like surfing a wave. ride the wave & trade the trend.

Reversal off oversold conditions ahead of May 30 financialsECOM is staging a strong comeback from oversold area ahead of what are expected to be strong financials next Monday, May 30th. Bullish MACD cross (technical buy signal). Bullish Engulfing candle and a move above EMA 9 for the first time since April 1st. Trading at significant discount to peers. Q4 2021 saw $14.9M in revenue, adjusted EBITDA of $1.4M, cash flow from operations of $2M. 2021 annual revenue: $34.8M. Market cap: $28M.
CEO's Twitter post appears to suggest we can expect solid numbers next week:
"No secret, it's been a brutal market, especially for tech stocks. Some warranted, and some unwarranted.
We report Q1 results on Monday. It will be our first full Q with all acquisitions included. Another chance for shareholders to judge our performance..."
twitter.com
Analyst price target: $1
"(Raymond James) is now calling for EMERGE to hit full 2022 revenue and adjusted EBITDA of $64 million (unchanged) and $7 million (unchanged), respectively, and for 2023 revenue and EBITDA of $72 million (unchanged) and $8 million (previously $10 million), respectively.
With the update, Li has reiterated his “Outperform 2” rating for ECOM while lowering his target price from $2.25 to $1.00 per share, which at press time represented a projected one-year return of 127.3 per cent.
“With e-commerce peer valuations down substantially in the last three months (down by ~20 per cent on average), we have lowered our target multiple to 2.0x (from 2.5x) NTM revenues, still at a discount to other e-commerce companies. Our target moves lower to $1.00 based on 2.0x NTM revenues"

Shopify... Fill Your Cart ??Short term trade suggestion on Shopify (SHOP) on the TSX Exchange.
Confluence of a Harmonic pattern and a Pitchfork (secondary bounce off of the outer channel.)
Nasdaq showing signs of a short term bottom. This is key !
$410 -$414 would be my preferred entry level on a point D retest.
Don't be greedy. Use a tight stop.
Do your own due diligence and respect overall market sentiment.
S.

ADZN UpsideHello beautiful people,
Back with another opportunity.
Looking for an upside move approx. the 50% mark ($1.05); stop loss set for 0.44 (stock has not gone lower than $0.51 in its history);
Reward : Risk is about 2-2.5:1; look to take profit around $1.
Friendly remembering:
Embrace the discomfort of failure; this opportunity has presented itself and could go either way.
Managing one's risk is helpful in embracing the discomfort.
Take care.

Still behind pandemic gains!35% increase from pre pandemic has not priced in the growth and expansion thats coming DOL's way for sure and that along inflation and belt tightening times and 5$ prices can easily push DOL past the 80$ mark , on technical side a long time channel has been broken upwards signaling a new lower and upper bands

TC Energy Corpstock I have been watching for two years on wealthsimple---
will continue watching
as well I will be posting two more energy corporations that I am invested into

Lucara Diamond Corp I love diamonds investing in diamonds especially canadian diamonds or america company owned diamond companyes- my names is lucas and lucara rings a bell so I will invest and wait for lucara to find lots of diamonds and this stock goes to 1.00 it was at 77 cents when i bought shares on wealthsimple two years ago---but I havent seen a new all time high since then or even 80 cents a share.

HEXO to 0.10$ then rally to 50$ + ?I think that HEXO is close to a bottom. 0.10$ possible aka 2.618 fib level possible as it coincides with a 1.618 projection of the AB segment.
I think that HEXO would rally from there if it doesn't rally before.

First Majestic: There it is!There it is! First Majestic actually did it – it has advanced into our turquoise zone between $12.36 and $6.89. Now, things are getting interesting. As First Majestic has reached the middle of the turquoise zone and thus has tapped its ideal target point for wave 2 in turquoise, it could already start to move upwards, crossing the resistance at $19.41. However, there lurks a 45% chance that First Majestic could fail to turn and could fall through the turquoise zone instead. In that case, it could drop further below the support at $5.30.

Quizam Media Corporation Canada Sun Storm Investment Trading Desk & NexGen Wealth Management Service Present's: SSITD & NexGen Portfolio of the Week Series
Focus: Worldwide
By Sun Storm Investment Research & NexGen Wealth Management Service
A Profit & Solutions Strategy & Research
Trading | Investment | Stocks | ETF | Mutual Funds | Crypto | Bonds | Options | Dividend | Futures |
USA | Canada | UK | Germany | France | Italy | Rest of Europe | Mexico | India
Disclaimer: Sun Storm Investment and NexGen are not registered financial advisors, so please do your own research before trading & investing anything. This is information is for only research purposes not for actual trading & investing decision.
#debadipb #profitsolutions

Bigg Digital Asset Canada Sun Storm Investment Trading Desk & NexGen Wealth Management Service Present's: SSITD & NexGen Portfolio of the Week Series
Focus: Worldwide
By Sun Storm Investment Research & NexGen Wealth Management Service
A Profit & Solutions Strategy & Research
Trading | Investment | Stocks | ETF | Mutual Funds | Crypto | Bonds | Options | Dividend | Futures |
USA | Canada | UK | Germany | France | Italy | Rest of Europe | Mexico | India
Disclaimer: Sun Storm Investment and NexGen are not registered financial advisors, so please do your own research before trading & investing anything. This is information is for only research purposes not for actual trading & investing decision.
#debadipb #profitsolutions

Cresco Lab USA Sun Storm Investment Trading Desk & NexGen Wealth Management Service Present's: SSITD & NexGen Portfolio of the Week Series
Focus: Worldwide
By Sun Storm Investment Research & NexGen Wealth Management Service
A Profit & Solutions Strategy & Research
Trading | Investment | Stocks | ETF | Mutual Funds | Crypto | Bonds | Options | Dividend | Futures |
USA | Canada | UK | Germany | France | Italy | Rest of Europe | Mexico | India
Disclaimer: Sun Storm Investment and NexGen are not registered financial advisors, so please do your own research before trading & investing anything. This is information is for only research purposes not for actual trading & investing decision.
#debadipb #profitsolutions

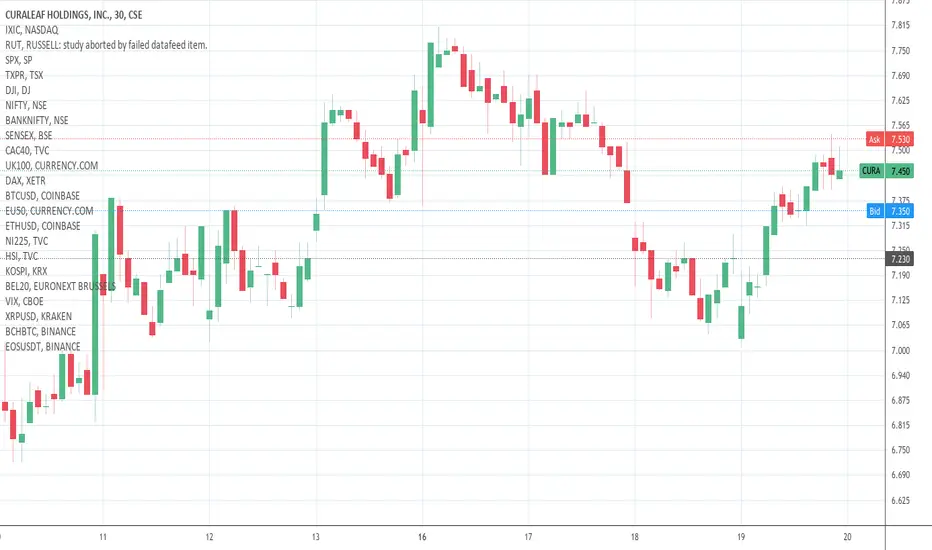
Curaleaf Holding Canada Sun Storm Investment Trading Desk & NexGen Wealth Management Service Present's: SSITD & NexGen Portfolio of the Week Series
Focus: Worldwide
By Sun Storm Investment Research & NexGen Wealth Management Service
A Profit & Solutions Strategy & Research
Trading | Investment | Stocks | ETF | Mutual Funds | Crypto | Bonds | Options | Dividend | Futures |
USA | Canada | UK | Germany | France | Italy | Rest of Europe | Mexico | India
Disclaimer: Sun Storm Investment and NexGen are not registered financial advisors, so please do your own research before trading & investing anything. This is information is for only research purposes not for actual trading & investing decision.
#debadipb #profitsolutions
Green Thum Industries CanadaSun Storm Investment Trading Desk & NexGen Wealth Management Service Present's: SSITD & NexGen Portfolio of the Week Series
Focus: Worldwide
By Sun Storm Investment Research & NexGen Wealth Management Service
A Profit & Solutions Strategy & Research
Trading | Investment | Stocks | ETF | Mutual Funds | Crypto | Bonds | Options | Dividend | Futures |
USA | Canada | UK | Germany | France | Italy | Rest of Europe | Mexico | India
Disclaimer: Sun Storm Investment and NexGen are not registered financial advisors, so please do your own research before trading & investing anything. This is information is for only research purposes not for actual trading & investing decision.
#debadipb #profitsolutions

Revive Therapetics Canada Sun Storm Investment Trading Desk & NexGen Wealth Management Service Present's: SSITD & NexGen Portfolio of the Week Series
Focus: Worldwide
By Sun Storm Investment Research & NexGen Wealth Management Service
A Profit & Solutions Strategy & Research
Trading | Investment | Stocks | ETF | Mutual Funds | Crypto | Bonds | Options | Dividend | Futures |
USA | Canada | UK | Germany | France | Italy | Rest of Europe | Mexico | India
Disclaimer: Sun Storm Investment and NexGen are not registered financial advisors, so please do your own research before trading & investing anything. This is information is for only research purposes not for actual trading & investing decision.
#debadipb #profitsolutions

Tenet Fintech Group Canada Sun Storm Investment Trading Desk & NexGen Wealth Management Service Present's: SSITD & NexGen Portfolio of the Week Series
Focus: Worldwide
By Sun Storm Investment Research & NexGen Wealth Management Service
A Profit & Solutions Strategy & Research
Trading | Investment | Stocks | ETF | Mutual Funds | Crypto | Bonds | Options | Dividend | Futures |
USA | Canada | UK | Germany | France | Italy | Rest of Europe | Mexico | India
Disclaimer: Sun Storm Investment and NexGen are not registered financial advisors, so please do your own research before trading & investing anything. This is information is for only research purposes not for actual trading & investing decision.
#debadipb #profitsolutions

Turivie canabies Group CanadaSun Storm Investment Trading Desk & NexGen Wealth Management Service Present's: SSITD & NexGen Portfolio of the Week Series
Focus: Worldwide
By Sun Storm Investment Research & NexGen Wealth Management Service
A Profit & Solutions Strategy & Research
Trading | Investment | Stocks | ETF | Mutual Funds | Crypto | Bonds | Options | Dividend | Futures |
USA | Canada | UK | Germany | France | Italy | Rest of Europe | Mexico | India
Disclaimer: Sun Storm Investment and NexGen are not registered financial advisors, so please do your own research before trading & investing anything. This is information is for only research purposes not for actual trading & investing decision.
#debadipb #profitsolutions


$HEM has announced the closing of debentures
Hemostemix has announced that it has closed the previously released non-brokered convertible debenture in accordance with offering $1,000 principal amount of each debenture.

Thomas Smeenk, the CEO of Hemostemix, on the new appointment new
For settling all the financial transactions of the company, Hemostemix has appointed a special advisor, Mr. Richard Groome, to the CEO, who believes that he’s a great addition to the team.

Hemostemix $HEM has an agreement with Aspire Health Science.
Hemostemix (TSXV: $HEM) primarily deals with developing and commercializing innovative blood-derived stem cell therapies. Is now entered into an agreement with Aspire and has agreed to settle the dispute of data stealth and intellectual property infringement regarding ACP-01.

The closing of the settlement agreement by $HEM
In connection with the previous agreement dispute, Hemostemix has recently announced the closure of the agreement and the settlement of all prosecution with Aspire Health Science in a very recent news release by the company itself.

Descending Triangle for WEED?wow, hard to believe canopy is getting near my entry point in 2016-2017.
This stock has been a rollercoaster since rec legalization in Canada.
A Potential trading range is highlighted in green. Any price movement that is sustained below or above the green lines is noteworthy.
If WEED doesn't hold the green line of support a gap down to CAD $2.80 is highly probable.
If WEED breaks to the upside out of the downward sloping resistance of the broadening wedge go long, set your stop loss above the resistance line, and trade accordingly. If the top of the broadening wedge doesn't hold as support a decline back down to the baseline support is likely and it was a fake-out.
