GMGLong entry for a run to the 50% retrace. Only 1/3rd of a position, markets are messy and trying to get my head back in the game after a time away.
Watching for 15min entries. Flipped the MA's yesterday with the big spike, if it can keep its head up ill keep buying.

BNS (Bank of Nova Scotia) – 30-Min Short Trade Setup!📉 🚀
🔹 Asset: Bank of Nova Scotia (BNS)
🔹 Timeframe: 30-Min Chart
🔹 Setup Type: Bearish Breakdown Trade
📌 Trade Plan (Short Position)
✅ Entry Zone: Below $68.92 (Breakdown Confirmation)
✅ Stop-Loss (SL): Above $70.82 (Invalidation Level)
🎯 Take Profit Targets:
📌 TP1: $66.37 (First Support Level)
📌 TP2: $64.21 (Extended Bearish Move)
📊 Risk-Reward Ratio Calculation
📉 Risk (SL Distance): $70.82 - $68.92 = $1.90 risk per unit
📈 Reward to TP1: $68.92 - $66.37 = $2.55 (1:1.34 R/R)
📈 Reward to TP2: $68.92 - $64.21 = $4.71 (1:2.48 R/R)
💡 Favorable Risk-Reward Ratio – Aiming for a 1:2.48 R/R at TP2.
🔍 Technical Analysis & Strategy
📌 Bearish Descending Triangle Breakdown – Price has been forming lower highs, indicating weakness.
📌 Weak Buying Pressure – The price is failing to break out and is consolidating near the $68.92 support level.
📌 Volume Confirmation Needed – A strong increase in selling volume below $68.92 will confirm bearish momentum.
📌 Momentum Shift Expected – If the price remains below $68.92, further downside toward $66.37, then $64.21 is expected.
📊 Key Resistance & Support Levels
🔴 $70.82 – Stop-Loss / Resistance Level
🟡 $68.92 – Breakdown Level / Short Entry
⚪ $66.37 – First Target / TP1
🟢 $64.21 – Final Target / TP2
📉 Trade Execution & Risk Management
📊 Volume Confirmation – Ensure strong selling pressure below $68.92 before entering.
📉 Trailing Stop Strategy – Move SL to breakeven ($68.92) after hitting TP1 ($66.37).
💰 Partial Profit Booking Strategy:
✔ Take 50% profits at $66.37, let the rest run to $64.21.
✔ Adjust SL to breakeven ($68.92) after TP1 is hit.
⚠️ Fake Breakdown Risk:
❌ If price moves back above $68.92, exit early to limit losses.
❌ Wait for a strong bearish candle close before entering aggressively.
🚀 Final Thoughts
✔ Bearish Setup – Breakdown signals downside potential.
✔ Momentum Shift Possible – Watch for volume confirmation.
✔ Favorable Risk-Reward Ratio – 1:2.48 R/R to TP2.
💡 Stick to the plan, manage risk, and trade smart! 📉🔥
🔗 Hashtags for Engagement:
#BNS 📉 #StockTrading 📊 #TradingNews 📉 #MarketUpdate 🔥 #Investing 💰 #ShortTrade 📉 #Stocks 📈 #ProfittoPath 🏆 #SwingTrading 🔄 #DayTrading ⚡ #TechnicalAnalysis 📉 #StockSignals 📊 #FinancialFreedom 💡 #MarketTrends 📊 #StockAlerts 🔔 #TradeSmart 🤓 #Bearish 📉 #RiskManagement ⚠️ #TradingCommunity 🤝 #SmartTrading 💰 #MarketAnalysis 📊 #TrendBreakdown 🚀

SHOULD BE SIMPLEAIR CANADA looking like it's gearing up for a turnaround on the weekly timeframe, based on the stochastic levels, and dragonfly doji, symboling the end of the downtrend. Wait for a conformation hopefully next week with a nice candle to the upside and hopefully trump stays out of the headlines (he won't)

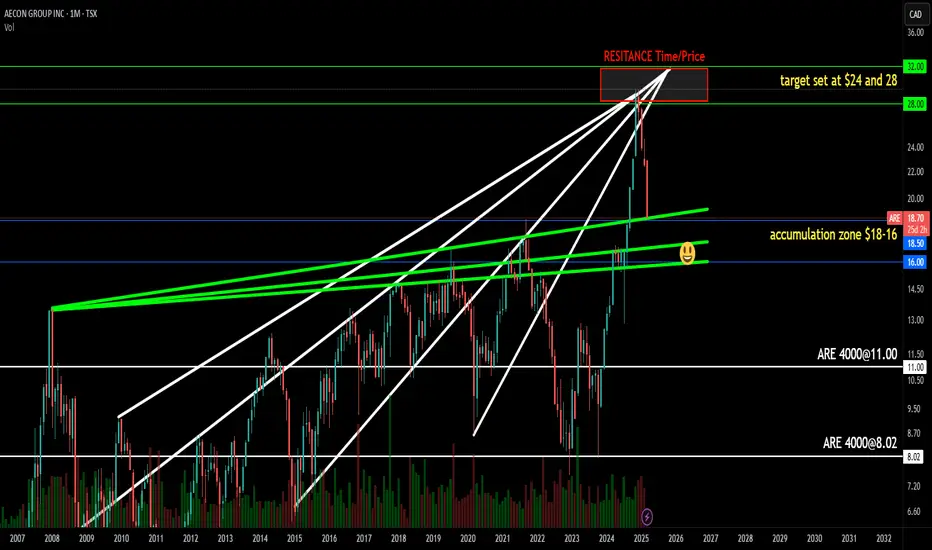
ARE - Dip BUYThere are not too many opportunities like these but I feel we are in for some choppy times this year before the final higher of the 2025 cycle. This is one of them!

AMD TSX LONGTERM TRADE SETUP.Would love to hear thoughts on this idea based on macd , volume profile and solely based on a confirmation of reversal.
Not financial advice but I think there's opportunity here.


**Buy Trade Strategy for NDA: Capitalizing on Growth Potential****Description**:
This trading idea focuses on **NDA**, a stock positioned in a high-growth sector with strong fundamentals driving its long-term potential. **NDA** benefits from strategic market positioning, innovative product offerings, and increasing demand within its industry. With a solid financial outlook, expanding partnerships, and a commitment to innovation, **NDA** has the potential to capture market share and deliver value to investors. As global trends shift towards its core business model, the company is poised for sustained growth, making it an attractive asset for long-term investors.
However, it is essential to consider broader market conditions, regulatory impacts, and macroeconomic factors that could influence **NDA**'s stock performance. Stock investments carry inherent risks, and price movements can be affected by external events, requiring a well-planned risk management strategy.
**Disclaimer**:
This trading idea is for educational purposes only and should not be considered financial advice. Investing in stocks like **NDA** carries risks, including potential capital loss. Always conduct thorough research, assess your financial position, and consult with a professional financial advisor before making any investment decisions. Past performance is not indicative of future results.

Lion One Metals doing the zigzag 0.41 target GOLD PRODUCERLion One Metals doing the zigzag 0.41 target GOLD PRODUCER
This producers will aim at 500 tonnes per day crushing in 2025
When each tonne deliver 3gr + gold => 1500 gram => 50 ounce worth a day.
With each ounce at a 2800+ this money machine is in the top league of gold producers.
50% is their margin and dilution has taken place, hence the low entry
From 0.3 -> 0.4 = 25% return in a short amount of time 1-3 months for speculators
SPECULATION A PROFITABLE PROFESSION
EHMAC

Patience I think medipharm is a decent company they have a lot going for them and they are on the verge of profitablity, and when call you have Pierre Poilievre in office in Canada all Canadian stocks that aren't terrible are going to be bullish for sure. My average buy in is 7 cents Canadian and if your a US citizen you can literally buy way more then canadains if you have an average salary pos. My price target is 60 cents Canadian but I know this company is going to a couple of dollars here.

$AC under valuePrior to COVID dilution AC's saleable assets equated to just over $18 per share. Dilution was what? 60 million shares?
I very much like Air Canada under $17 and grabbed a whole bunch today at $16.70. Planning on dropping right before/after summer flying is reported Nov/Dec.
Aren't cyclical industries great?!

Long SOL Strategies at 2.64CADYou know what to do...
Enter a 1/3rd position immeditely.
Then DCA weekly around 2.64CAD/share.
(DCA remaining 2/3rds on meaningfull pullbacks or 50% retracements.)
Sell HODL when ETHEREUM hits new ATH in 2025. There may be a lot more upside, but better safe than sorry, IMO.
Cryptmando
Jan 07, 2025

massive retest?Is $cco.to NYSE:CCJ going to retest the MASSIVE important level that goes back 18 years?
#uranium #u308

Bullish on $MFI with food insecurity Be sure to click that follow button and check out all my linked socials for more elite signals and market insights!
MFI – Maple Leaf Foods Inc. (TSX)
Key Stats:
• Current Price: ~$21.73
• Market Cap: ~$2.7B
• P/E Ratio: ~18
• Dividend Yield: ~4.3%
• Next Earnings Date: Feb 25, 2025
• Recent Analyst Sentiment: Upgraded to Outperform
Technical Reasons for Upside:
1. 50MA Bounce: MFI has found solid support at its 50-day moving average—proof that the bulls are holding the line and ready to push higher.
2. Volume Surge: Increasing trading volume on up days signals that smart money is stepping in, setting the stage for a breakout move.
3. Resistance Test & Breakout Potential: The stock has been flirting with resistance around $21; a decisive break could propel it swiftly to the $22 target.
Fundamental Reasons for Upside:
1. Stable Earnings & Dividend Profile: Maple Leaf Foods boasts consistent earnings and a healthy dividend yield, underpinning long-term investor confidence.
2. Operational Efficiency Improvements: Recent quarterly results show tighter cost controls and steady revenue growth, highlighting robust operational performance.
3. Analyst Upgrades & Positive Outlook: With several analysts recently upgrading the stock and citing margin expansion potential, the fundamentals are aligned for a modest rally.
Potential Paths to Profit:
1. Option 1 (Low-Risk): Buy shares at current levels and hold until the $22 target is achieved.
2. Option 2 (Moderate-Risk): Purchase LEAP call options (expiring in early 2027) at a strike near the current price, then sell as MFI nears your target.
3. Alternative Strategy: Consider a bull call spread—buy a call at a lower strike (e.g., $21) and sell a call at a higher strike (e.g., $22)—to lower your net cost while capitalizing on the expected upward move.
Please LIKE, FOLLOW, SHARE, and COMMENT if you enjoy this idea! Also, share your ideas and charts in the comments section below! This is the best way to keep this signal relevant, keep the content free, and allow the idea to reach as many people as possible.
Disclaimer: We are not a brokerage or investment firm. We do not offer financial advice or investment advice and/or signals. This is not certified financial education. We offer access to the daily thought process of an individual and his experiences. We do not offer refunds. All sales are final.

$AC LONG - Enter 16.50-17.00, Exit 20-22 into Q2, Risk 16TSX:AC LONG - No monthly bounce or even weekly bounce since the highs, 36% drop, daily RIS oversold to historical lows, very good risk reward entry here at 17 area.16.00 16.50 massive support.
Entry: 16.50-17.00
Exit: 20-22 into Q2
Risk: 16
10 year AVG Forward PE = 7.34 , would put AC at 20.80 for 2.8 earnings 2025
Oil trending down to 60
CXY Canada dollar monthly bounce underway
Entered 17 break, expect retest back to 21 area, drop with zero bounces..
Q2 tends to be best quarter for airlines.
Suggest holding Long for 2-3 Months. Thank me later


BCE weekly macd buy signalFollowing a huge sell off and post-earnings flush signs of life emerge as the daily Macd followed by the weekly Macd turn positive. A lift into the high 40's looks possible. Anyone who wanted to sell BCE has been washed out already. Dividend cut is already discounted in the action imho.In fact any sign of improving balance sheet will likely fuel the upside

Nexgen Short Opportunity ? I entered a medium-sized short position on NexGen for several reasons, as the probability of revisiting the range lows appears high from this point:
1-The price briefly broke above the range highs but quickly reversed back inside, indicating a failed breakout.
2-A classic Head and Shoulders pattern has broken down and is currently retesting the neckline.
At the end of the day, trading is all about probabilities, and to me, this setup looks highly valid. Let’s go!

SOL Strategies: The Next MSTR Sol Strategies Inc. (CSE: HODL) is a Toronto-based Canadian investment firm specializing in cryptocurrency and blockchain-related assets. The company’s primary focus is on treasury management through activities such as lending, staking, and liquidity provisioning. Additionally, Sol Strategies actively invests in early-stage companies operating in decentralized finance (DeFi) and blockchain technologies while also engaging in Bitcoin mining and serving as a validator for the Solana blockchain.
Formerly known as Cypherpunk Holdings Inc., the company rebranded in September 2024 to better align with its strategic focus on the Solana blockchain ecosystem. In a manner reminiscent of MicroStrategy’s Bitcoin-centered investment approach, Sol Strategies has opted to use Solana (SOL) as its principal digital asset.
Given that the altcoin season has yet to fully materialize, Solana retains significant growth potential, which could result in substantial returns on investment (ROI) for Sol Strategies. My Elliott Wave analysis of this stock suggests that it is on the verge of initiating the next leg of a five-wave macrocycle. The first wave, characterized by a five-wave impulse, was followed by a significant correction—a common feature of Elliott Wave theory—resulting in a 50% decline at the end of January. Such corrective phases are typical in low-cap stocks, where retracements tend to be more pronounced.
As indicated by my technical chart, Sol Strategies is breaking out of its local downtrend, with a daily close above the resistance trendline potentially signaling renewed bullish momentum. Given these technical and macroeconomic factors, I plan to "HODL" this stock for the long term as altcoin season progresses. I will continue to monitor the next impulsive wave structure to identify an optimal exit strategy.

50 cents is the number we want!This puppy has been fighting its way sideways for years.
Based on this chart, 50 cents might be the launching pad.
However, for now - STEP 1 - break the downward channel.

Bitfarms - Now or neverIf Bitfarms closes below 1.37 on a weekly candle it would be a major sign that Bitcoin has peaked.
I don’t think this is likely but I do think this will be the final chance to go long on Bitfarms as this is a major support level between 1.37 and 1.75.
The opportunity is a 1:17.5R trade.
Trade quality:
Chance of success 70% (assuming market moves into the zone with the confines of the wedge pattern shown)
Risk to reward rating: 7/10
Overall rating: 7/10

CIBC Risk Adversity*Not Trading Advice. (of course)
Historically CIBC has not performed well along this Fibonacci Channel.
While it could be years before the stock returns to the lower trend, it would appear that there is significant risk with little reward in buying in this area.

HWX--BullishIt is making the bullish flag. The green line is entry point and Blue line is to book profit.
