Wyckoff gives positive signNo SC, no apparent secondary testing. But price action at support and resistance still justifies the direction of the big-money's preference and bias of our market. The most important basis for bullish accumulation comes from the moderate decline at the top without volume, in addition the shocking behavior of the bottom telling a rebound. Combining the above events, we have reason to believe that big capital is trying to control the low-priced selling chips, ready to bring the price to a higher level...

000009 Has significant accumulation biasThe supply continues to shrink. After the low-bottom test, it shows that the last support of LPS is currently being built, and the profit-loss ratio of long-term entry is excellent. After the previous volume broke through and returned to the range, the volume decreased twice, and then was swallowed by the positive line with volume, indicating that the demand was rising. Although it is currently under the suppression of multiple moving averages, the method on the left can still judge that the accumulation behavior below is being established. Once the accumulation is completed, the volume breaks above the moving average and is very optimistic.

2022-02-23 601633January data report. In the case of some friends who are more bright, it will appear slightly less beautiful, which must be admitted. And we also said that it doesn’t matter if the overall is bad, the market share has not lost, but this is the time to fight for market share. Hope that the Great Wall will continue to work hard. I suspect that there may have been a bit of pressure on sales in December, considering the reasons for equity incentives.
However, important or high-margin models such as Euler, tanks, and guns, and even the newly launched brand beasts are all good, indicating that the explosion effect is still there. In the second month of listing, the beast became an explosion.
Lack of core should be the reason. In fact, this wave city is not very lucky. The factories and production capacity are laid out in advance against the trend, but due to the lack of cores, the production capacity that should have made contributions in grabbing shares is not as good as imagined. But from a dialectical point of view, for the chip, Mr. Wei will definitely take action in supply chain management.
If you believe in him, then the opportunity to increase the technical position is about to come.
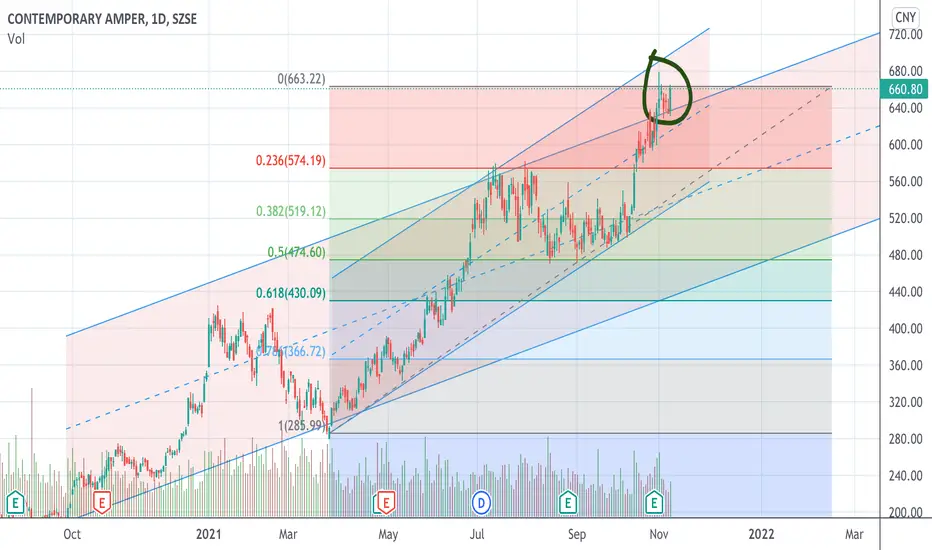
With the support of 0.618, continue to increase positions and do more

2022-02-23 002415Hikvision's performance forecast is slightly higher than expected. How to wait for the annual report to see the specific composition. Today, I will use this performance forecast to sort out the valuation.
Let's talk about the logic of our model first. Usually our manufacturing companies do not easily do ten years in the cash flow discount model, but we think that Hikvision is a company of the bell maker level. In the history of Hikvision, it has been as good as a day for decades, and it is currently the visual AI entrance. , digitalization and other softening areas have a large space, so we believe that Hikvision's model will be fine for ten years.
Technically, there is currently a bullish Gat force. Let's keep going long.

002408 has potential wyckoff accumulationDetails are involved in the chart.If it close with low volume and smaller candle,it's an opportunity to go long and observe more.

shandong fengyuanlets see how it gonna unfold..
i expect a bear market soon down to 0.618 support of last bull run..
once touching there hope to see another bull run begin to the moon.

Shenghe Resources Holdings - a potential buy Read article here
After a year of consolidation, it is almost time to rebound to its glorious days. It has fallen almost 50% from its peak to the current support level at 15.20.
The breakout seems feeble and I expect it to be a false alarm and is likely to fall further.
So, let's wait and see how it behaves next week.......

601888 has potential wyckoff accumulationA completed SC as well as spring revealed the strength of demand below 200, we are now in the process of 'Sign of strength', perhaps it will become a JOC soon, Let's see.

2022-02-10 300750Today, the Ningde era seems to have become a hot spot, so where are we worth buying the dips?
There is currently a potential harmonic worth doing so much more.
Admission 480
Stop Loss 450
target 530
Goal 2 580

Is it just a shake out in this irregular box? Code:300491
CM didn't choose to sell the share in the previous box, the supply failed to break out the channel. Perhaps the same thing will happen again soon!

HOW-TO use Sextan Strategy Backtesting FrameworkBacktesting of technical indicators and strategies is the most common way to understand a quantitative strategy. However, the complicated configuration and adaptation work of backtesting many quantitative tools makes many traders who do not understand the code daunted. Moreover, although I have written a lot of strategies,
However, I am still not very satisfied with the backtest configuration and writing efficiency. Therefore, I have been thinking about how to build a backtesting framework that can quickly and easily evaluate the backtesting performance of any indicator with a "long/short entry" indicator, that is, a "simple backtesting tool for dummies". The performance requirements should be stable, and the operation should be simple and convenient. It is best to "copy", "paste", and "a few mouse clicks" to complete the quick backtest and evaluation of a new indicator.
Luckily, I recently realized that TradingView provides an "Indicator on Indicator" feature, which is the perfect foundation for doing "hot swap" backtesting. My basic idea is to use a two-layer design. The first layer is the technical indicator signal source that needs to be embedded, which is only used to provide buy and sell signals of custom strategies; the second layer is the trading system, which is used to receive the output signals of the first layer, and filter the signals according to the agreed specifications. , Take Profit, Stop Loss, draw buy and sell signals and cost lines, define and send custom buy and sell alert messages to mobile phones, social software or trading interfaces. In general, this two-layer design is a flexible combination of "fixed and flexiable", which can meet the needs of most traders to quickly evaluate the performance of a certain technical indicator. The first layer here is flexible. Users can insert their own strategy codes according to my template, and they can draw buy and sell signals and output them to the second layer. The second layer is fixed, and the overall framework is solidified to ensure the stability and unity of the trading system. It is convenient to compare different or similar strategies under the same conditions. Finally, all trading signals are drawn on the chart, and the output strategy returns. test report.
The main function:
The first layer: "{Sextan} Your Indicator Source", the script provides a template for personalized strategy input, and the signal and definition interfaces ensure full compatibility with the second layer. Backtesting is performed stably in the backtesting framework of the layer. The first layer of this script is also relatively simple: enter your script in the highlighted custom script area, and after ensuring the final buy and sell signals long = bool condition, short = bool condition, the design of the first layer is considered complete. Input it into the PINE script editor of TradingView, save it and add it to the chart, you can see the pulse sequence in yellow (buy) and purple (sell) on the sub-picture, corresponding to the main picture, you can subjectively judge that the quality of the trading point of the strategy is good or bad.
The second layer: "{Sextan} PINEv4 Sextans Backtest Framework". This script is the standardized trading system strategy execution and alarm, used to generate the final report of the strategy backtest and some key indicators that I have customized that I find useful, such as: winning rate , Odds, Winning Surface, Kelly Ratio, Take Profit and Stop Loss Thresholds, Trading Frequency, etc. are evaluated according to the Kelly formula. To use the second layer, first load it into the TrainingView chart, no markers will appear on the chart, since you have not specified any strategy source signals, click on the gear-shaped setting next to the "{Sextan} PINEv4 Sextans BTFW" header button, you can open the backtest settings, the first item is to select your custom strategy source. Because we have added the strategy source to the chart in the previous step, you can easily find an option "{Sextan} Your Indicator Source: Signal" at the bottom of the list, this is the strategy source input we need, select and confirm , you can see various markers on the main graph, and quickly generate a backtesting profit graph and a list of backtesting reports. You can generate files and download the backtesting reports locally. You can also click the gear on the backtest chart interface to customize some conditions of the backtest, including: initial capital amount, currency type, percentage of each order placed, amount of pyramid additions, commission fees, slippage, etc. configuration. Note: The configuration in the interface dialog overrides the same configuration implemented by the code in the backtest script.
How to output charts:
The first layer: "{Sextan} Your Indicator Source", the output of this script is the pulse value of yellow and purple, yellow +1 means buy, purple -1 means sell.
The second layer: PINEv4 Sextans Backtest Framework". The output of this script is a bit complicated. After all, it is the entire trading system with a lot of information:
1. Blue and red arrows. The blue upward arrow indicates long position, the red downward arrow indicates short position, and the horizontal bar at the end of the purple arrow indicates take profit or stop loss exit.
2. Red and green lines. This is the holding cost line of the strategy, green represents the cost of holding a long position, and red represents the cost of holding a short position. The cost line is a continuous solid line and the price action is relatively close.
3. Green and yellow long take profit and stop loss area and green and yellow long take profit and stop loss fork. Once a long position is held, there is a conditional order for take profit and stop loss. The green horizontal line is the long take profit ratio line, and the yellow is the long stop loss ratio line; the green cross indicates the long take profit price, and the yellow cross indicates the long position. Stop loss price. It's worth noting that the prongs and wires don't necessarily go together. Because of the optimization of the algorithm, for a strong market, the take profit will occur after breaking the take profit line, and the profit will not be taken until the price falls.
4. The purple and red short take profit and stop loss area and the purple red short stop loss fork. Once a short position is held, there will be a take profit and stop loss conditional order, the red is the short take profit ratio line, and the purple is the short stop loss ratio line; the red cross indicates the short take profit price, and the purple cross indicates the short stop loss price.
5. In addition to the above signs, there are also text and numbers indicating the profit and loss values of long and short positions. "L" means long; "S" means short; "XL" means close long; "XS" means close short.
TradingView Strategy Tester Panel:
The overview graph is an intuitive graph that plots the blue (gain) and red (loss) curves of all backtest periods together, and notes: the absolute value and percentage of net profit, the number of all closed positions, the winning percentage, the profit factor, The maximum trading loss, the absolute value and ratio of the average trading profit and loss, and the average number of K-lines held in all trades.
Another is the performance summary. This is to display all long and short statistical indicators of backtesting in the form of a list, such as: net profit, gross profit, Sharpe ratio, maximum position, commission, times of profit and loss, etc.
Finally, the transaction list is a table indexed by the transaction serial number, showing the signal direction, date and time, price, profit and loss, accumulated profit and loss, maximum transaction profit, transaction loss and other values.
Finally, I will explain that this is just the beginning of this model. I will continue to optimize the trading system of the second layer. Various optimization feedback and suggestions are welcome. For valuable feedback, I am willing to provide some L4/L5 technical indicators as rewards for free subscription rights.

How to use pandas_ta library to build R-Breaker indicatorToday is the first day of 2022. I hereby wish all my friends a smooth transaction in the new year, and your account will be N times profitable.
The reason why I write this article is not to simply introduce the R-Breaker strategy itself. I think many of my friends may have used this strategy for intraday short-term trading operations. And I hope to use this case to introduce how to use the pandas_ta library I just released for indicator and strategy design.
Many friends who are familiar with Python may find: Is the pandas_ta library not an open source library for Python? How can it be directly used in Tradingview? In fact, I spent some time and energy to convert the Python version of the pandas_ta library file into Tradingview's Pine v5 script, and used the latest library functions released in v5 to encapsulate most of the functions.
The pandas_ta library is a public library file containing functions that can be reused in Pine indicators, strategies or other libraries. They are useful for defining commonly used functions, so their source code does not have to be included in every script that requires them. The pandas_ta library is a public and open source Pine script library, so it is referenced in another script. In fact, according to Tradingview's release policy, all libraries must be released as open source before they can be publicly cited. In other words, public scripts can only use public libraries, and they must be open source. Private or personal scripts saved in the Pine editor can use public or private libraries. A library can use other libraries, or even its own previous version (Tradingview requires that the version number of the library must be noted when importing).
If you want to use the pandas_ta library, it is done through the import statement in the following format:
import //
Among them, the path // will uniquely identify the library. must be specified explicitly. In order to ensure the reliability of scripts that use the library, there is no way to automatically use the latest version of the library. Each time the author of the library updates, its version number will increase. If you plan to use the latest version of the library, you need to update the value in the import statement. The as part is optional. When used, it defines the namespace that will reference library functions. For example, if you import a library using the allTime alias as we did in the example below, you would call the library's function allTime.(). When no alias is defined, the name of the library becomes its namespace. To use the panadas_ta library, our script will need an import statement:
import blackcat1402/pandas_ta/2 as pta
The above is an introduction to the usage of the Tradingview library. Next, let me talk about the realization of the intraday short-term strategy R-Breaker.
The R-Breaker strategy is a short-term intraday trading strategy that combines trend and reversal trading methods. High, Close and Low PreClose are respectively the highest price of the current K-line, the closing price of the current K-line, the lowest price of the current K-line and the closing price of yesterday. Through these prices, a pivot point (Pivot Point) can be set, and many people in China also refer to it as the "pocket pivot." With the "pocket pivot", we can calculate the support and resistance levels for buying and selling. They are:
-Breakthrough buying price = Observing selling price + 0.25 * (Observing selling price-Observing buying price)
-Observe the selling price = High + 0.35 * (Close – Low)
-Reversal selling price = 1.07 / 2 * (High + Low) – 0.07 * Low
-Reversal buying price = 1.07 / 2 * (High + Low) – 0.07 * High
-Observe the buying price = Low – 0.35 * (High – Close)
-Breakthrough selling price = Observing the buying price-0.25 * (Observing the selling price-Observing the buying price)
R-Breaker trading strategy details:
-1) When the intraday highest price exceeds the observed selling price, and the intraday price falls back and further breaks below the support line constituted by the reversal selling price, a reversal strategy is adopted, that is, at this point (backhand, open position) ) Short;
-2) When the intraday lowest price is lower than the observed purchase price, and the intraday price rebounds and further exceeds the resistance line constituted by the reverse purchase price, a reversal strategy is adopted, that is, at this point (backhand, open position) ) Long;
-3) In the case of a short position, if the intraday price exceeds the breakthrough buying price, a trend strategy is adopted, that is, open a long position at that point;
-4) In the case of a short position, if the intraday price breaks below the selling price, a trend strategy is adopted, that is, open a short position at that point.
R-Breaker indicator usage
-Generally used in short periods such as minute periods (I generally use 30 minutes and 1 hour periods, taking into account the response speed and stability), or the T+0 varieties with strong shares.
-It is best to perform double verification based on other indicators such as volume, price, market, and sector.
-The green label B is for early warning and buying.
-The red S label is short warning and sell.
Use pandas_ta library file to build R-Breaker
At the beginning of script writing, you need to use import to import the pandas_ta library, as follows:
//@version=5
indicator(" L2 Intraday R-Breaker Indicator", overlay = true)
import blackcat1402/pandas_ta/2 as pta
After naming the pandas_ta library as pta, you need to use "pta." as the prefix when referencing functions in it, for example:
preclose = callsec(syminfo.tickerid, "D", close, false)
nn = ta.barssince(dayofmonth!=pta.xrf(dayofmonth,1))+1
hh = pta.xrf(pta.xhh(high,nn),nn)
ll = pta.xrf(pta.xll(low,nn),nn)
Do not use pta.xrf, pta.xll, pta.xhh to reference the functions in the pandas_ta library.
In summary, this is the whole content of the tutorial. The tradingview library is very convenient to use, which can greatly improve coding efficiency and focus on the development of core strategies.

Nice buy here Strong buy signal on 601857 (PETROCHINA COMPANY LIMITED)
- Strong support
- Bearish trendline breakout
Contact me to manage your portfolio

Battery power aheadIf the inner bearish trend line is broken out, then we can see the price action moving towards 18 (plus minus) in the coming months. Let's wait and see.

Faw Group in a downtrendThe stock has been moving slightly downside in this area. Hongqi plans to launch the E-HS9 SUV in more European countries, starting the deliveries in Denmark this December. This could give a boost to this stock, but right now I would expect more downside.
Not financial adivce.

Chinese condiments market is HUGE !!!Read this latest article
As Chinese, my wife and I eat this every now and then especially with porridge. They have many varieties available in the supermarket, spicy and non-spicy. Much like the West who likes to eat pickles and olives, this zha cai is a local delicacy in China.
And with the inflationary costs of raw materials, we can expect a higher demand of this staple product (Winter now in China) and people switching to eat more hot food like soup and porridge.
Let's see its performance down the road...

002271Tough call... the channel formed since 2020 will be a macro-view channel that the market is eyeing on (for technical analysis). I would say we should put in 60% of the target sizing at RMB34 and the rest of the target sizing at RMB26 (the likelihood of hitting that is not low).
(i) Act when it hits ~RMB34
(ii) Act when it hits ~RMB26

Recommend to buyI think it will gonna go up to Fibbo 1.618% because it already break Fibbo 1.272% already.

Analyse not prediction- Surfing on WavesS/L and Target is Highlighted
if we go for prediction, we would expect things to happen in our favor, and it is the beginning of mistake, one day we would get big loss,
we just collet more probbility on our favor , make strategy for lower rick and higher reward,
Then Surfing on Waves


BOE Reached CNY 20 billion in Net Profit as of Q3 2021In the first half of 2021, BOE continued to rank first in the world in terms of display shipments in the five application areas of smartphones, tablets, notebook computers, monitors, and TVs.
BOE released its Q3 earnings report for the period ended September 30, 2021, on October 28.
· Operating income was CNY 56 billion, a 46.8% year-on-year increase.
· Net profit was CNY 7.3 billion, a 441.1% year-on-year increase.
· Debt ratio was 13.88%.
· Gross margin reached 44.32%.
· Financial expenses were CNY 99 million.
The First three-quarter financial reports for the IoT firm are as below:
· Revenue was CNY 163.3 billion, a 72% year-on-year increase.
· Net profit was CNY 20 billion, a 708.4% year-on-year increase.
BOE issued the "Announcement on Provision for Asset Devaluation in the First Three Quarters of 2021." The company’s provision for inventory depreciation in the first three quarters of 2021 was 3.949 billion yuan, transferred back 1.24 billion yuan, and resold 792 million yuan. Inventory impairment losses in the first three quarters of 2021. The total profit is 1.918 billion yuan.
The company also released the investment project – "BOE Chengdu vehicle display project" with CNY 2.5 billion. The project strives to start production at the end of 2022, with an annual output of approximately 14.4 million onboard display screens after reaching full capacity.

SF Holding’s Net Profit Drops by Nearly 70% in the 1st 3Q 2021The acquisition of Kerry Logistics assets reached CNY 200 billion.
SF Holding released its Q3 earnings report for the period ended September 30, 2021, on October 28.
· Operating income was CNY 47.5 billion, a 23.5% year-on-year increase.
· Net income was CNY 1.0 billion, a 43.5% year-on-year decrease.
· Gross margin decreased by 6.8%.
· Completed 51.5% shares of Kerry Logistics, followed by a 71.4% increase in SF holding’s total asset
The First three-quarter financial reports for the logistics firm are as below:
· Operating income was CNY 135.9 billion, a 23.97% year-on-year increase.
· Net income was CNY 1.8 billion, a 67.9% year-on-year decrease.
· Shipments reached 7.7 billion in the first three quarters, with 36.39% growth.
· The government subsidy included in the profit reached CNY 630 million.
Through the acquisition of Kerry Logistics, the improvement of SF holding’s international business layout will continue to accelerate its operating capabilities for the foreseeable future. Therefore, the recovery of SF Holdings' profitability is expected to rise in the future.
