Orpha bearish - sellAll moving averages bearish.
RSI close to 30, but no buyers picking it up
MACD bearish
Broke last support on fibonacci.
Strong sell.

Genmab - 2000 DKK must holdAfter the royalty issue with Janssen announced today we have seen a sudden decrease. I would say 2000 DKK is a buying zone/support level and it must be held if the stock price should rise to new ATH again.

Down we go! but how fare ? Danish bank
Trick code: Danish
Danskebank is in decline and does not seem to stop 🧐
As you can see, all MA lines are negative and especially MA 200 and that means Danskebank is still in decline.
RSI - is oversold and is about to have some new energy, however, it may well continue yet.
MACD - is on a downtrend with negative momentum and has plenty of give of yet.
Friday's trading day ended with a red candlestick with good momentum and landed right on the support line (it is not drawn in, but that's where the price is right now) and I do not take that as a positive sign for Monday, but it can also jump up from here, but I do not think so - we'll see.
But where is it going?
where should it find its next support: candlesticks / news / support lines who knows but I have drawn the next support lines into the chart where I can see it has the opportunity to turn - If it should come under the last support line, is it well on its way to all time low in 2009 "course 31" - But let's take one week at a time :)
Hope you have a good Friday night 🍷
Trade with care 🙏

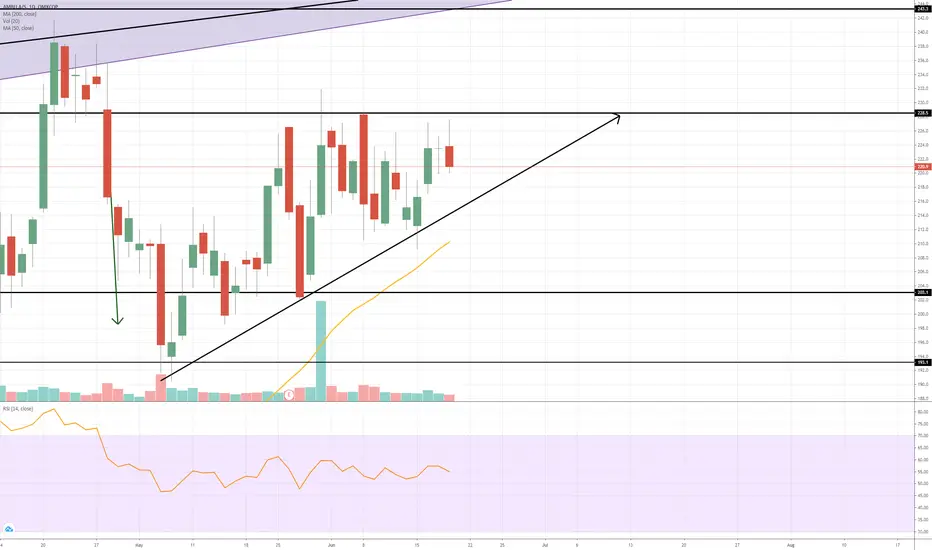
AMBU close to downtrendBuy/Sell oppitunities = Orange
MA 200 line = Blue
Are AMBU going to turn into a downtrend ?
Are MA 200 gonna hold ?
There is only one small resistance left befor we go bearish.
Disclaimer: Im not in AMBU


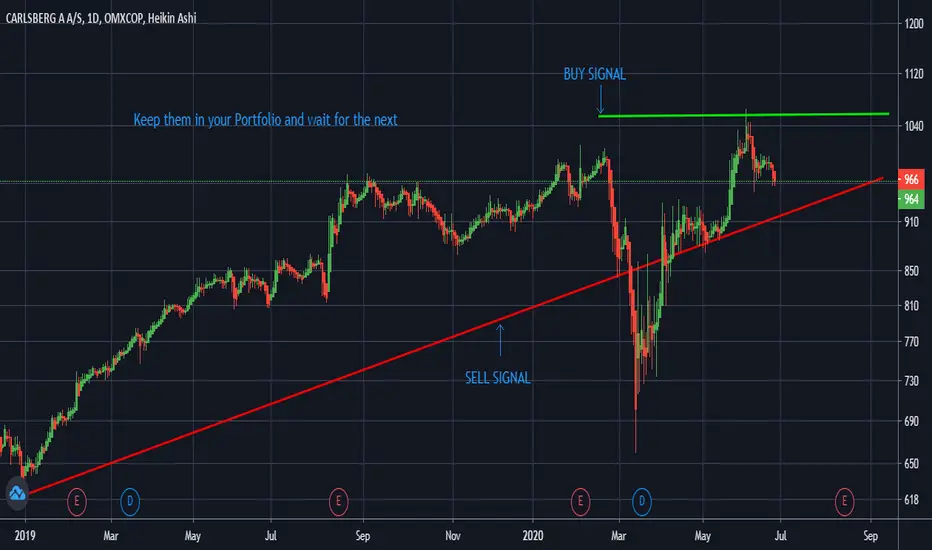
keep it or double your investment !CARL A Will RIse next week !
keep it in the portfolio
Buy Or double Your investment
T 1 : 1062 DKK
T2 : 1130 DKK
SL : 900 DKK


Bounce to the trendline beat with B&O!Ok, I’m moving in! From the trendline drawn from 2009 we see a possible bounce incoming. I’m fully aware that B&O barely avoided bankruptcy back in June and the share issue that saved them. But from a technical view this is looking far too juicy to just let go. A Long position is established here today. Might not happen just now, but potentially soon. Look at MACD and trendline for triggers.

Novo Nordisk UpdatedThe last anaylsis of Novo Nordisk was successful at its prediction. Heres an updated one of where i see it in the short term future


Breakout of wedge - AMBU looks bullishAMBU has broken this slightly bearish wedge in a stron bullish uptrend during corona. One could wait to see that this week closes over the indicated wedge.

Chemometec - Breakout of top of trend channelCould maybe fall back to 370 DKK for a good buying spot for longs

Orsted getting near to fibo resistance zoneIt's approaching a resistance zone and we expect it to reverse and go down to the first support shown on the chart

A tail wind for OrstedHaving made the all time high at the beginning of June, Orsted has been consolidating for the whole month to have another crack at the ceiling. It's now breaking out and will go easily beyond 800.

Wait for the coming daysThe time is not right to make a decision
I advise you to wait for the coming days
If we cross the green line with a green candle, I advise you to double your investment
In case we cross the red line with a red candle, I advise you to sell
I Recommend SELLING Technical indicators( candles ; volume ; ligne ; fbonaci ..) indicate a decline in the market during the next week; I advise you to sell and wait for the next buying signal

I recommend buying again Technical indicators( candle ; volume ; ligne 1 ligne 2 ) indicate that the market will rise in the coming days

ALK-Abelló - plenty of room towards the top of its trend channelSolid allergy company in the healthcare sector. Roof of trend channel is app. at 2330 DKK and bottom of the trend channel is at 1740 DKK.

BAVA Bullished 2nd attempt BAVA Bullished 2nd attempt,
Remember to follow volume and news about Bava.

Last chance at reaching going higher short term?I see the current weeks movement as a ascending triangle, hopefully it makes it our upwards, but be aware of a breakdown, it is still frying quite high, about 50% over 200MA daily.
Take care, happy trading.

Watch for break of resistance level at 230 DKK in AMBU AMBU has taken a break since april 2020 after a very nice rally in 2020 due to hospitals mass buy of AMBU's respiratory equipment. The trend is still up and if it can break 230 DKK the next days/weeks, it would signal further increase in the stock price. Maybe all the way to the top of the trend channel at 330 DKK

