Novo Nordisk hit my target this week and I have started to buy The head and shoulders pattern successfully played out, with OMXCOP:NOVO_B reaching my full target at 670.
Check out my original post:
The stock experienced a significant drop, falling as much as 27% on the Friday before Christmas. This was triggered by test results for their obesity drug, CagriSema, which showed patient weight loss of 22.7% - below the anticipated 25%.
I believe this reaction is an overcorrection and have taken advantage of this rare opportunity to purchase OMXCOP:NOVO_B , first at 680 and again at 600. I now plan to hold patiently, expecting Novo Nordisk to reach new all-time highs in the coming years.

Novo completely oversold🐂 Trade Idea: Long - NOVO
🔥 Account Risk: 20.00%
📈 Recommended Product: Stock
🔍 Entry: +/- 750.00
🐿 DCA: No
😫 Stop-Loss: 675.00
🎯 Take-Profit #1: 1,000.00 (50%)
🎯 Trail Rest: Yes
🚨🚨🚨 Important: Don’t forget to always wait for strong confirmation once possible entry zone is reached. Trade ideas don’t work all the time no matter how good they look. Do not get a victim of FOMO, there is always another trade idea waiting. 🚨🚨🚨
If you like what you see don’t forget to leave a comment 💬 or smash that like ❤️ button!
—
Novo Nordisk is completely oversold (in fear of RFK) and so is the rest of the Pharma sector as well. Nevertheless, Novo is still printing money and trial results for a new product should come in end 24 or beginning 25 for the oral version of the weight loss drug. The fear over political decisions in the US should be used to buy the Pharma sector. For me, it is Novo and Regeneron.
—
Disclaimer & Disclosures pursuant to §34b WpHG
The trades shown here related to stocks, cryptos, commodities, ETFs and funds are always subject to risks. All texts as well as the notes and information do not constitute investment advice or recommendations. They have been taken from publicly available sources to the best of our knowledge and belief. All information provided (all thoughts, forecasts, comments, hints, advice, stop loss, take profit, etc.) are for educational and private entertainment purposes only.
Nevertheless, no liability can be assumed for the correctness in each individual case. Should visitors to this site adopt the content provided as their own or follow any advice given, they act on their own responsibility.

Orsted daily bottomLook for signs of reversal between 300-325. AB=CD to possible channel bottom/doubling of earlier channel and zone.

Multi year breakoutLeading financial bank with multi year breakout. You can clearly see VCP pattern.

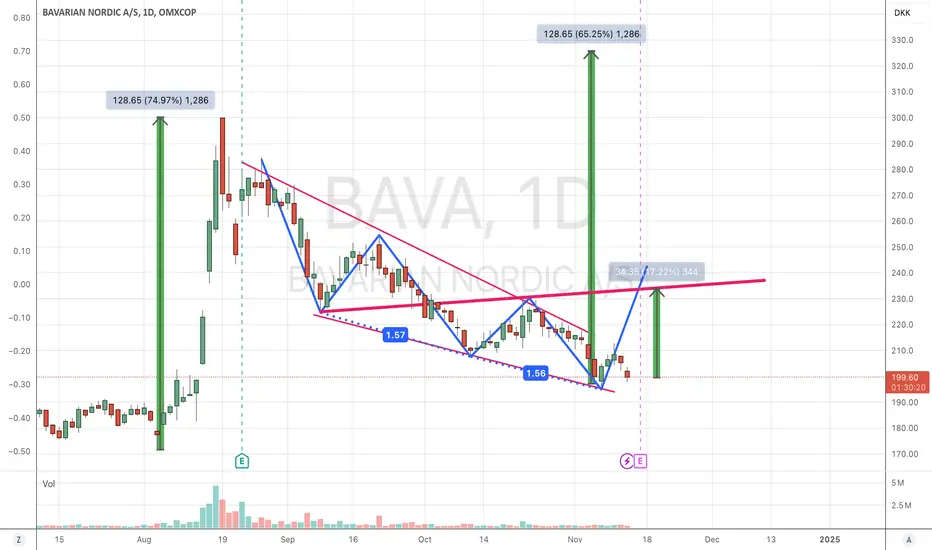
BAVA: finally a breakoutAccording to analysts the average Target is 319 whereas the max Target us 373. Happy trading Folks

MAERSK UptrendTREND
According to the wave structure, it is still in the downtrend
However, head and shoulders formation is a powerful reversal indicator.
It also formed a blue channel , now targeting the upper band
Moving Averages
20-day (Red) crosses 50-day (Orange) from down to up (powerful indicator supporting uptrend)
100-day (Turquoise) is below the current price (so supports uptrend)
200-day (Blue) is right below the current price (it becomes support now)
SUMMARY
Based on this analysis, a price action following the blue arrow is highly probable.

NOVO Up TrendTREND
We may be at the end of the correction, namely the 3 ABC waves within the downward (orange) channel.
It may form a reversal formation with the blue harmonic pattern.
At the same time, the TOBO formation will also be formed.
MA
In this case, the 100-day (turquoise) will have worked as support.
The last 100-day was seen in 2021.
Thus, the upward trend can continue without breaking the 20-day to 50-day.

NOVO Down TrendTREND
The red trend line from 2022 has been broken. It may be doing a pullback for confirmation.
It continues its movement within the orange channel that started in 2024. It may be the 3rd of the 5-wave.
The green trend line from 2021 is the first target before the purple main support.
The purple support formed in 2023 is the strongest level. It is also Fibo 0.618.
MA
20-day (Red), 50-day (Orange) is cutting down from the top.
100-day (Turquoise) has been working as support since November.
200-day (Blue) intersects with the weekly main support (Purple).
SUMMARY
It is in a downtrend in the weekly and a typical reversal pattern is not seen.
It may continue its movement in the direction of the blue arrow.

Carlsberg 2h first PB?IHS at weekly channel low. AB=CD/possible first pullback to zones and channel low. Take it at least to gap close.

New Zealand dollar eyes RBNZ rate announcementThe New Zealand dollar is in positive territory on Tuesday, after a four-day losing streak. In the European session, NZD/USD is trading at 0.5850, up 0.09% on the day. Earlier, the New Zealand dollar fell as low as 0.5797, its lowest level since Nov. 1.
The Reserve Bank of New Zealand makes its rate announcement on Wednesday and the markets have priced in a jumbo rate cut of a 50 basis point for a second straight meeting. This would bring the cash rate to 4.25%, its lowest level since November 2022.
The RBNZ has done a good job of lowering inflation, which fell to 2.2% in the second quarter. This is the first time in over three years that inflation is within the target band of between 1 and 3 percent. Still, elevated rates have taken a heavy toll on the economy, as GDP declined 0.2% in the second quarter and likely fell in Q3 as well, which would mark a recession. The central bank’s aggressive rate-cutting is aimed at providing the economy with a much-needed boost.
The New Zealand dollar stands to be the big loser from an oversized rate cut. The currency plunged around 1% after the 50-bp chop in October and we could see another sharp drop on Wednesday if the central bank cuts again by 50 basis points.
The Federal Reserve releases the minutes of the November meeting later today. At the meeting, the Fed lowered rates by 25 basis points. Investors will be looking for insights about what the Fed may have planned for the Dec. 18 meeting. A few weeks ago, a second straight 25-bp cut appeared likely but with the US economy remaining strong, the Fed may opt to pause. Interest-rate future markets are currently pricing in a cut at 59% and a pause at 41%, according to the CME’s Fed Watch.
NZD/USD is testing resistance at 0.5857. Above, there is resistance at 0.5898
There is support at 0.5793 and 0.5752

BAVA: bullish 3 drives18 % Upside potential with little risk since earnings are coming out on friday
Revising the head and shoulders pattern on NOVOSince my previous analysis on Novo Nordisk OMXCOP:NOVO_B , the price has nearly reached the original target of 700.
However, I have made slight adjustments to the head and shoulders pattern, which has consequently led to a revised target at the value area low of the range from late 2023 at around 670.
At this point, I would not consider this an ideal time to initiate a short position on OMXCOP:NOVO_B . Instead, it appears to be more of a profit-taking opportunity for those who entered short positions near the levels indicated in my earlier post.

You can buy it here.. Its fineOMXCOP:VWS
Recent pullback is a fine buying opportunity.
Maybe we bottomed and break the downtrend now,
Maybe we have a leg lower to ~120 - a chance to back up the truck.
In any case this one will AT LEAST double in value over the next 3 years.
Europe will make a lot of windmills in the next 3 years, it is vital for the future of European energy independence, so if you believe there is a future - then this is a good company to build a position in this winter.
Cheers.

NOVO NORDISKBearish trend with a Shoulder-Head-Shoulder pattern with price target around 630DK. However, could fall a bit more if it tests support around 620DK.

Novo Nordisk Correction: Key Levels & Opportunities for InvestorNovo Nordisk, Europe’s largest publicly traded company, has experienced exceptional growth, especially in the diabetes and obesity treatment markets. Known globally for its expertise in insulin production, Novo Nordisk has also recently expanded into the obesity treatment market with products like Wegovy, which have seen rapid adoption and driven substantial revenue gains. Strong financials and a robust R&D pipeline make it a leading global player, well-positioned for future growth in metabolic health.
From a technical analysis perspective, Novo Nordisk faced resistance at the significant psychological level of €1000, struggling to break above this for several months. Eventually, the stock began a correction phase. Yes, it happens with large market-cap stocks as well. Such pullbacks provide strategic buying opportunities, particularly at former resistance levels where the stock previously consolidated, which are now potentially acting as support.
Examples like Apple, Microsoft, and Google in 2022 show similar patterns, where prior minor resistance points offer ideal entries during corrections. Currently, Novo Nordisk is approaching an initial support level around €725, which may present a first entry point for those looking to add it to their portfolios gradually. This level allows for a cautious position, leaving room for additional buys if prices dip further. Should the stock decline, the next support zone lies between €500-€600, marked by a significant psychological level (€500) and a 50% drop from the peak. Kind of an ideal scenario for adding to the position.
This approach sets a flexible plan for entering Novo Nordisk with room for adjustments based on market movements.
Regards,
Vaido

DFDS weekly/monthly repeatI've been looking at the scenario for over a year, but it just seemed too extreme... Not anymore though. Let's see. Should at least move up to the quarterline if successful, which is about 60%!

NOVO NORDISK: recovering from sicknessThe current market setup for Novo shows a clear consolidation within the larger trend structure, indicating key decision points ahead for traders. If the resistence breaks and stays over it the stock should have a good time. It could be that the price falls to DKK750-710 but should recover from this point on.
Thank you for taking the time to read my analysis. I look forward to hearing your thoughts.
Best regards,
Mattner.
no investment advice

Novo Nordisk could be dropping 15% from hereLooking at Novo Nordisk and the fundamental I have a hard time thinking Novo would drop further at this point. However the technical setup indicates that if we don't hold the current level we could drop more than 15% from here.
- The head and shoulder is complete now we just need to see if we can get a follow through.
- Closing price Friday was below the 200 daily moving average.
The recent price drop is caused by a dissapoint in early trial results of their pill Monlunabant.

Ørsted broke multi-year downward trendlineSince 2021, Ørsted has been in a bearish trend overall. A trendline drawn from then to now shows that the stock price has just climbed over it. Looking at the support levels, the price has just claimed the last one at around 420.
Next level sits at 548.

MAERSK Inverse Head and ShouldersMaersk is potentially bottoming and forming an inverse head and shoulders. Price has also retraced to the 0.618 retracement of the move up from end of March.
PT: 13380, 16180

BAVARIAN NORDIC - 1000% pumpI expect a very strong increase in this company’s stock due to the impending monkeypox problem. Therefore, it is a very good idea to buy it. Wishing everyone health and prosperity.

Tryg 4h short to longLooks like middle symmetry in a bigger move down to possible channel low and a pitchfork C-point.

Novo Nordisk: Analyzing a Potential Pullback and Key levelsLong-Term Overview (3M Timeframe)
Looking at the 3-month timeframe, we can observe that OMXCOP:NOVO_B
has maintained a consistent bullish trend channel since 1990, characterized by higher highs and higher lows.
Medium-Term Analysis (1M Timeframe)
On the one-month timeframe, since the last significant pullback in 2016, OMXCOP:NOVO_B
has surged by approximately 1000%. Recently, the stock touched the upper resistance trend line and then experienced a sharp downward move, suggesting an impending pullback, which could be followed by another significant bullish run.
Key Levels (1W Timeframe)
Focusing on the one-week timeframe, we can identify crucial levels at 590 DKK, 735 DKK, and 930 DKK. Historically, these levels have acted as key resistance and support zones, making them critical areas to watch moving forward.
Fibonacci Analysis
Using Fibonacci retracement, the stock has respected the 0.236 level, reinforcing the validity of these levels as potential reversal points during the pullback. The relevant Fibonacci levels to monitor are 810 DKK, 670 DKK, and 560 DKK.
Outlook and Strategy
Given the recent price action, I anticipate that OMXCOP:NOVO_B
may form a reversal pattern, such as a double top or head and shoulders, leading to a more pronounced pullback. This pullback could have a reversal at one of the identified key levels or the lower support line within the long-term bullish trend channel.
How to Capitalize:
To capitalize on this potential move, consider monitoring smaller timeframes for signs that the pullback is concluding at the key levels. Once you identify such signals, a strategic entry could be made, with a stop loss placed just below the key support level to minimize risk.
