bullish with signs of accumulation and Tweezer Bottom Yes! The chart is showing **bullish potential** with signs of **accumulation in a sideways range**.
### **Bullish Scenario & Accumulation Zone**
- The price is trading within a **sideways range (accumulation phase)** between **0.339 EGP (support) and 0.411 EGP (resistance)**.
- **High volume near 0

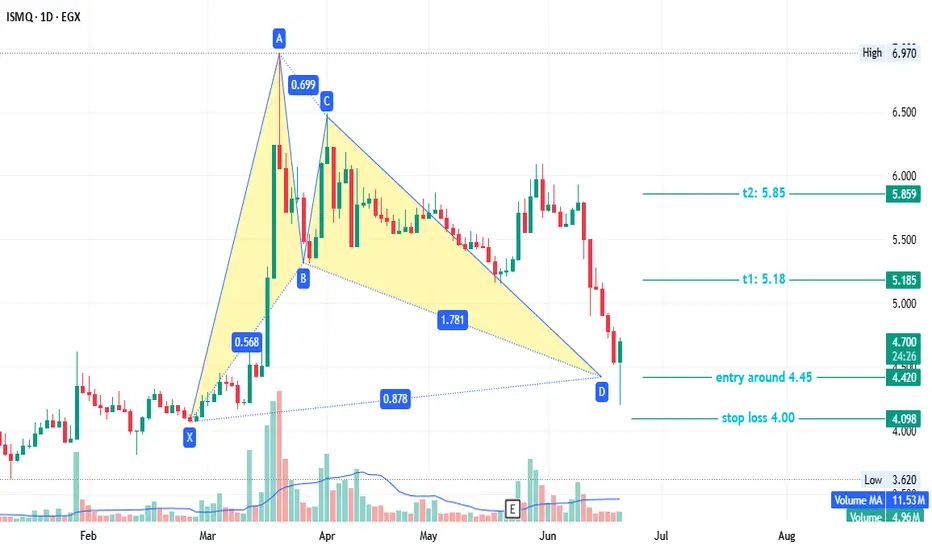
ISMQ - interested EGX:ISMQ timeframe 1 day
Created Bullish Gartley pattern, so we can see action price in this point .
Entry level around 4.45
Stop loss 4.00
First target at 5.18
Second target 5.85
NOTE : this data according to timeframe 1 day.
Its not an advice for investing only my vision according to the data
SWDY Decrease AnalysisSWDY stock is in a decreasing zone. It reached the lowest support line at 73.011. In case of rebounding up which is highly expected, it'll reach the resistance line 75.011 to reach the 75.215 then the 3rd at 75.338

MASR is currently below its 200 SMA.MASR is currently below its 200 SMA. Given its tendency since 2023 to quickly reverse after crossing this line, it's best to await clearer price action before considering a safe investment.

See all popular ideas
Community trends
Stock collections
All stocksTop gainersBiggest losersLarge-capSmall-capLargest employersHigh-dividendHighest net incomeHighest cashHighest profit per employeeHighest revenue per employeeMost activeUnusual volumeMost volatileHigh betaBest performingHighest revenueMost expensivePenny stocksOverboughtOversoldAll-time highAll-time low52-week high52-week lowSee all
Sector 10 matches | Today | 1 week | 1 month | 6 months | Year to date | 1 year | 5 years | 10 years |
|---|---|---|---|---|---|---|---|---|
| Finance | ||||||||
| Process Industries | ||||||||
| Producer Manufacturing | ||||||||
| Consumer Non-Durables | ||||||||
| Non-Energy Minerals | ||||||||
| Technology Services | ||||||||
| Industrial Services | ||||||||
| Transportation | ||||||||
| Communications | ||||||||
| Consumer Services |