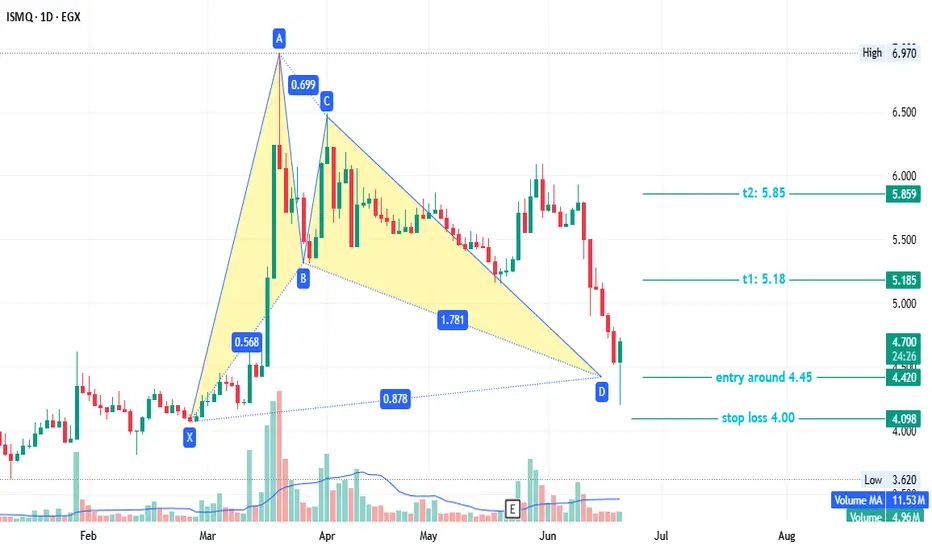
ISMQ - interested EGX:ISMQ timeframe 1 day
Created Bullish Gartley pattern, so we can see action price in this point .
Entry level around 4.45
Stop loss 4.00
First target at 5.18
Second target 5.85
NOTE : this data according to timeframe 1 day.
Its not an advice for investing only my vision according to the data on chart
Please consult your account manager before investing
Thanks and good luck
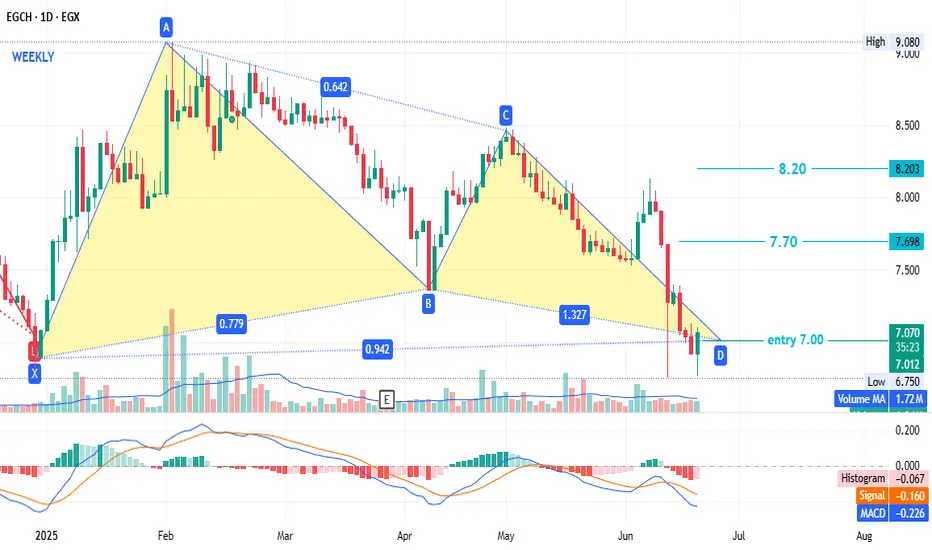
EGCH - old enemy - low riskConsider a long position with the following parameters:
Entry: 7.00
Stop loss: 6.80
Targets: 7.70 (T1), 8.20 (T2)
This is not investment advice but my analysis based on chart data. Consult your account manager before investing. Good luck.
SWDY Decrease AnalysisSWDY stock is in a decreasing zone. It reached the lowest support line at 73.011. In case of rebounding up which is highly expected, it'll reach the resistance line 75.011 to reach the 75.215 then the 3rd at 75.338

TMGH Chart AnalysisTMG Holding trend has unfortunately reached a lower region than before. Despite its continuous projects' updates, it reached the mentioned support line 51.233, if it continued decreasing it might reach the support line 51.142 then 51. On the other side, this decrease isn't expected to be long. It is expected to rebound to reach the resistance line 51.386, then the resistance line at 51.631, then the resistance line 51.806

#ASCM - Egyptian stock - great opportunity, high financial risk#ASCM time frame 1 DAY
Note : before technical analysis the financial position of the company isn't in the best condition , there isn't any cash flows from operations activity , in anther hand the company work in MINING so that may cost the company lot of expenses and time before achieving any Mining discovery .
We have here a great Gartley Bullish pattern with 2 positive diversions at MACD and RSI in addition the prices in critical point ( stop loss of the pattern ) so :
Entry level at 34.00 ( price now is 32.85 ) so we can wait to close daily over 34.00 or start from this point ( consult your account manager )
Stop loss 32.70 ( estimated loss -4% ) or estimated loss from this point is 0.50 %
First target at 37.50 ( estimated profit around 14% )
Second target 40.70 ( estimated profit around 23% )
Third target 42.70 ( estimated profit 30% )
NOTE : this data according to time frame I DAY , it`s may take period up to 3 months to achieve targets , you must study well the Alternative opportunities before invest in this stock .
Its not an advice for investing only my vision according to the data on chart
Please consult your account manager before investing
Thanks and good luck

ICDI - save your profits and capital#ICDI timeframe 4 hours and also 2 hours
Created a bearish Gartley pattern
Sell point around 3.72 ( prices now is 3.74 )
Stop loss / reentry 3.80 (estimated loss -2.00%)
First target at 3.53 (estimated profit 4.87%)
Second target 3.80 (estimated profit up to 9.24%)
Third target 3.20 (estimated profit up to 13.90%)
NOTE: this data according to timeframe 4 hours and also 2 hours.
It's not an advice for investing, only my vision according to the data on chart.
Please consult your account manager before investing.
Thanks and good luck.

ADRI - Egyptian stock market - good for medium term investing #ADRI timeframe 1 DAY
Created Gartley Bullish pattern.
Entry level at 1.08 ( price now 1.07)
Stop loss 1.02 ( loss may go to up -5.50% ) - support 1.05
First target at 1.24 ( with profit around 14.49% ) resistance 1.15
Second target 1.37 ( with profit around 26.60% ) resistance 1.28
Third target 1.52 ( with profit around 40.84% ) resistance 1.45
NOTE : this data according to time frame I DAY , so its may take time up to 3 months .
Its not an advice for investing only my vision according to the data on chart
Please consult your account manager before investing
Thanks and good luck

$MPRC - Beware of the bears trap** EGX:MPRC - 1-Day Timeframe**
A highly complete bearish Gartley pattern is forming.
- **Sell Point:** Around 26.50
- **Stop Loss/Reentry:** 28.17 (estimated loss: -7.00%). A close above 28.17 would signal continued upward momentum.
- **First Target:** 23.70 (estimated profit: 10.40%)
- **Second Target:** 22.00 (estimated profit: up to 16.87%)
**Notes:**
- The RSI shows weakness but remains above 70, indicating strength. A close below 70 would signal a halt to the upward trend. Until then, the stock remains positive for the long term.
- This analysis is based on the 1-day timeframe.
**Disclaimer:** This is not investment advice—only my interpretation of the chart data. Consult your account manager before making any decisions. Good luck!

#EAST - great fundamental - positive long term #EAST timeframe 1 hour
Created Bullish Gartley pattern, so we can see action price in this point .
Entry level around 30.20
Stop loss 29.70
First target at 31.65
Second target 32.50
Third target 33.20
NOTE : this data according to timeframe 1 hour.
Also MACD show positive diversion that may support our idea.
Its not an advice for investing only my vision according to the data on chart
Please consult your account manager before investing
Thanks and good luck

MASR is currently below its 200 SMA.MASR is currently below its 200 SMA. Given its tendency since 2023 to quickly reverse after crossing this line, it's best to await clearer price action before considering a safe investment.

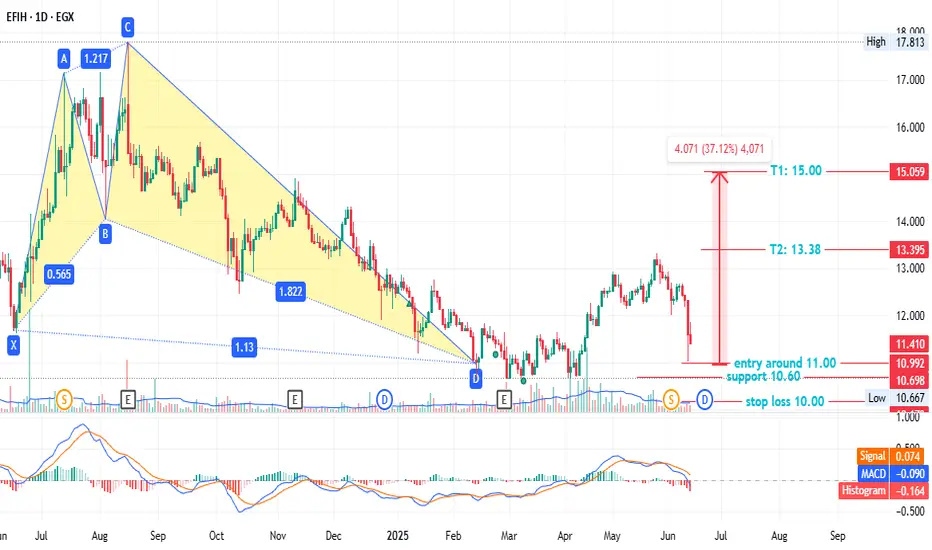
EFIH - anther chance - low risk EGX:EFIH - 1-Day Timeframe
A bullish pattern emerged on Feb 13, but prices adjusted after the 3/2 stock split on Jun 02. Key levels:
- Entry: ~11.00
- Stop loss: 10.00 (7.00% loss)
- Support: 10.60 (6-month low)
- Targets:
- T1: 13.38 (22.24% profit)
- T2: 15.00 (37.12% profit)
This is not investment advice—only my analysis based on chart data. Consult your account manager before investing. Good luck!
LUTS - out of box ( T1 10% VS SL 2% )EGX:LUTS timeframe 1 day
Created Bullish Gartley pattern, so we may see action price in this point.
Entry level around 0.573 ( prices now at 0.557 )
Stop loss 0.54 ( estimated loss 5.55% )
First target at 0.629 ( estimated profit 10.00% )
Second target 0.702 ( estimated profit 22.50% )
Third target 0.754 ( estimated profit 31.55% )
NOTE : this data according to timeframe 1 day.
Also MACD show positive diversion that may support our idea.
Its not an advice for investing only my vision according to the data on chart
Please consult your account manager before investing
Thanks and good luck

SWDY Neutral Zone AnalysisSWDY stock is in a neutral zone. There is a semi double bottom at the support line 80.742 that might encourage a bullish reversal pattern. In case of increasing it's expected to breach the resistance line 81.139 to reach the 81.209 then the 3rd at 81.420. In case of being a fake sign it'll break the support line at 80.742 to reach the 2nd at 80.578 then the 3rd at 80.531 points.

TMGH Rebound AnalysisTMG Holding trend is reaching a new peak zone at the resistance line 58.624. Historically, it is expected to rebound to the support line at 58.538, then the support line 58.452 and finally 56.734. In conclusion, it increased by 0.17%.

TMG Long UpdateHey everyone,
The chart shows bullish flag and held strong support at 47-48 price level. One thing that worries me is the liquidity below 47.5 (in green circle), because the price always makes big moves after a liquidity sweep, which in this case didn't happen yet.
So i expect one of two scenarios that might happen, either the price will go briefly below 47 to sweep the liquidity, create a wick and move to the upside from here or the price will just breaks the trend line, retraces and then continue upwards.
so my advice (do your own research before you take any position) is to DCA into position, meaning, every time the stock drops 1 Egp, buy and increase your buying power, every time the price goes lower (example, buy 1 share at 54, 2 shares at 53, 3 shares at 52 and so on), and for all your buying positions have a stoploss at 45 EGP.


#MOIL - Be cautiousBe cautious: MACD disagrees with recent price highs. While the price action suggests a rise, the MACD is forming a lower high than its previous peak, signaling potential weakness in the upward momentum.

ECAP - Egyptian stock#ECAP timeframe 1 DAY
created 2 Bullish pattern ( Gartley and AB=CD ) , so we can see action price in this point .
Entry level at 22.70 ( price now 22.40 )
Stop loss 22.00( loss may go to up -3% )
First target at 24.45( with profit around 7.60% )
Second target 25.97( with profit around 14.70% )
NOTE : this data according to time frame I DAY ,
Its not an advice for investing only my vision according to the data on chart
Please consult your account manager before investing
Thanks and good luck

#COMI - ACTION IN THE WAY - all market will rising soon or ??!!EGX:COMI is showing a potential triangle pattern.
BB support is at 79.15, making it a good entry point for a long position.
Prices are currently trading below the middle BB line (80.16), which has acted as resistance since the start of the month.
As long as prices stay above 78.60, they are likely to reach 83.20 eventually.
At June market may go to moon , just remember who told you first .
But still be caution more than optimistic or hopeful
At this point market may achieve new historical levels from anther hand EGX30 tray many times to close over 32200 but is failed.
No one is bigger than the market and remember Technical analysis is not an accurate science .
This is not financial advice, just our analysis based on chart data. Please consult your account manager before investing.
Thanks and good luck!

TMGH's New PeakTMG Holding trend is reaching a new peak zone at the resistance line 56.884. Historically, it is expected to rebound to the support line at 56.324, then the support line 55.2 and finally 55.165. In conclusion, it increased by 0.09%.

SWDY Double Bottom AnalysisSWDY stock has rebounded back from the resistance line of 81.97, to reach the support line at 81.163. It shows that the double bottom wasn't a true sign to encourage a bullish reversal pattern.

PHDC Loading for a Massive Breakout – Hidden Bull Flag Inside!Palm Hills (PHDC) is gearing up for a powerful move! 📈
After months of respecting a clean ascending channel, price just bounced perfectly off lower support.
📊 Indicators flashing green:
StochRSI bullish cross ✅
MACD turning positive ✅
Squeeze Momentum showing early pressure build-up ✅
I’m buying between 6.70–6.85 EGP with a tight stop at 6.50 EGP.
🎯 Targets:
TP1: 7.50 EGP
TP2: 8.00–8.20 EGP
A clean breakout above 7.00 EGP could trigger explosive upside. Watch closely! 🚀
(DYOR – Not financial advice)
