#ISMQ#ISMQ created a bullish Gartley pattern at time frame 30m
entry level around 4.22
stop loss 4.19
first target at 4.35
second target 4.42 up to 4.48
NOTE : this data according to time frame 30m
note : MACD and RSI show positive diversion may support our idea
also may prices go down to 4.15 then it will active anther Gartley pattern at time frame 1 hour and then the stop loss will be 4.10 ( targets still the same )
Its not an advice for investing only my vision according to the data on chart
Please consult your account manager before investing
Thanks and good luck

#TAQA#TAQA created a bullish Gartley pattern at time frame 1 hour
entry level around 12.81
stop loss 12.65 up to 12.60
first target at 13.20
second target 13.20 up to 13.50
NOTE : this data according to time frame 1 hour
note : there is anther bullish Gartley pattern at time frame 1 day giving higher targets up to 14.00
Its not an advice for investing only my vision according to the data on chart
Please consult your account manager before investing
Thanks and good luck

#TAQA#TAQA created a bullish Gartley pattern at time frame 1 day
entry level around 12.81
stop loss 12.60
first target at 13.30
second target 13.40 up to 14.00
NOTE : this data according to time frame 1 day
Its not an advice for investing only my vision according to the data on chart
Please consult your account manager before investing
Thanks and good luck

#SKPC#SKPC time frame 30m
created a bullish Gartley pattern
entry level around 20.20
stop loss 20.00
first target at 20.45
second target 20.65 up to 20.80 (there is higher targets for anther bigger patterns up to 23.00)
NOTE : this data according to time frame 30m
Its not an advice for investing only my vision according to the data on chart
Please consult your account manager before investing
Thanks and good luck

#EKHOA#EKHOA time frame 15m
created a bullish Gartley pattern
entry level at 31.80 TO 31.90
stop loss 31.75
first target at 32.10
second target 32.30 up to 32.45 , 32.60
MACD indicator show positive diversion , may that is support our idea.
NOTE : this data according to time frame 15m
Its not an advice for investing only my vision according to the data on chart
Please consult your account manager before investing
Thanks and good luck

#ABUK#ABUK time frame 30m
created a bullish Gartley pattern
entry level at 51.90
stop loss 51.40
first target at 52.80
second target 53.65 up to 54
MACD indicator show positive diversion , may that is support our idea.
NOTE : this data according to time frame 30m
Its not an advice for investing only my vision according to the data on chart
Please consult your account manager before investing
Thanks and good luck

#OFH Egyptian stock#OFH time frame 1 hour
created a bearish Gartley pattern
sell point at 0.38
stop loss / rebuy 0.386
first target at 0.37
second target 0.362 UP TO 0.355
NOTE : this data according to time frame 1 hour
Its not an advice for investing only my vision according to the data on chart
Please consult your account manager before investing
Thanks and good luck

ASPIRE Egypt has a positive uptrendWeekly chart,
The stock EGX:ASPI is trading in an ascending broadening channel.
The target is the upper resisitance line R, at around 0.395, expected in 4 months.
Technical indicators RSI and MACD are supporting this positive view.
Consider a near stop loss / profit protection level - as the stock is volatile.

Emaar Egypt is positively bullishDaily chart,
The stock EGX:EMFD has been consolidating between 7.3 and 8.7 in sideways movement. The current technical indicators RSI and MACD are signalling a positive bullish direction.
After a resistance breakout and stabilizing above 8.7 for 2 days, the target will be 10.11
Consider keeping a near profit protection / stop loss level.

#ICID Egyptian stock#ICID time frame 15m
created a bullish Gartley pattern
entry level at 3.60 to 3.58
stop loss 3.58
first target at 3.66
second target 3.70 up to 3.75
NOTE : this data according to time frame 15m
Its not an advice for investing only my vision according to the data on chart
Please consult your account manager before investing
Thanks and good luck

#ELWA Egyptian stock#ELWA time frame 1 hour
created a bullish Gartley pattern
entry level at 0.638
stop loss 0.618
first target at 0.700
second target 0.739 up to 0.764
MACD indicator show positive diversion , may that is support our idea.
NOTE : this data according to time frame 1 hour
Its not an advice for investing only my vision according to the data on chart
Please consult your account manager before investing
Thanks and good luck

#MCQE Egyptian stock#MEQE time frame 15m
created a bullish Gartley pattern
entry level at 25.40 to 25.60
stop loss 25.30
first target at 26.40 to 26.60
second target 27.00 up to 27.20 and 27.60
accumulation and distribution line indicator show positive diversion , may that is support our idea.
in addition at time frame 1 hour showed the same pattern with same results
NOTE : this data according to time frame 15m
Its not an advice for investing only my vision according to the data on chart
Please consult your account manager before investing
Thanks and good luck

#GDWA Egyptian stock#GDWA time frame 1 day
created a bullish Gartley pattern
entry level at 4.80 to 4.85
stop loss 4.75
first target at 5.40
second target 5.80 up to 6.00 and 6.40
MACD indicator show positive diversion , may that is support our idea.
NOTE : this data according to time frame 1 day
Its not an advice for investing only my vision according to the data on chart
Please consult your account manager before investing
Thanks and good luck

#ATQA Egyptian stock#ATQA time frame 1 hour
after achieved targets of bullish gartley there is anther pattern was created as follow :
created a bearish Gartley pattern
sell point at 5.50
stop loss / rebuy 5.55
first target at 5.35
second target 5.25
NOTE : this data according to time frame 1 hour
Its not an advice for investing only my vision according to the data on chart
Please consult your account manager before investing
Thanks and good luck

Time analysis for EKHOBased of the arc and the time mirror effect. We can detect the end of the sideway area near to one of the lines of the chart Or between them . then if we started up trend we can expect the top near to the right lines.
you will need normal technical analysis to support it when the time come.

AIH to target 0.92Weekly chart, the stock has crossed the resistance line of the triangle pattern.
Target is 0.92 passing through the shown resistance levels.
Stop loss should be considered.
Technical indicators RSI and MACD are supporting this view.

#MPRC Egyptian stock#MPRC time frame 1 HOUR
created a bullish Gartley pattern
entry level at 24.80
stop loss 24.24
first target at 27.00
second target 27.75
MACD indicator show positive diversion , may that is support our idea.
NOTE : this data according to time frame 1 HOUR
Its not an advice for investing only my vision according to the data on chart
Please consult your account manager before investing
Thanks and good luck

#ATQA Egyptian stock#ATQA time frame 15m
created a bullish Gartley pattern
entry level at 5.15 to 5.18
stop loss 5.14
first target at 5.35
second target 5.45
MACD indicator show positive diversion , may that is support our idea.
NOTE : this data according to time frame 15m
Its not an advice for investing only my vision according to the data on chart
Please consult your account manager before investing
Thanks and good luck

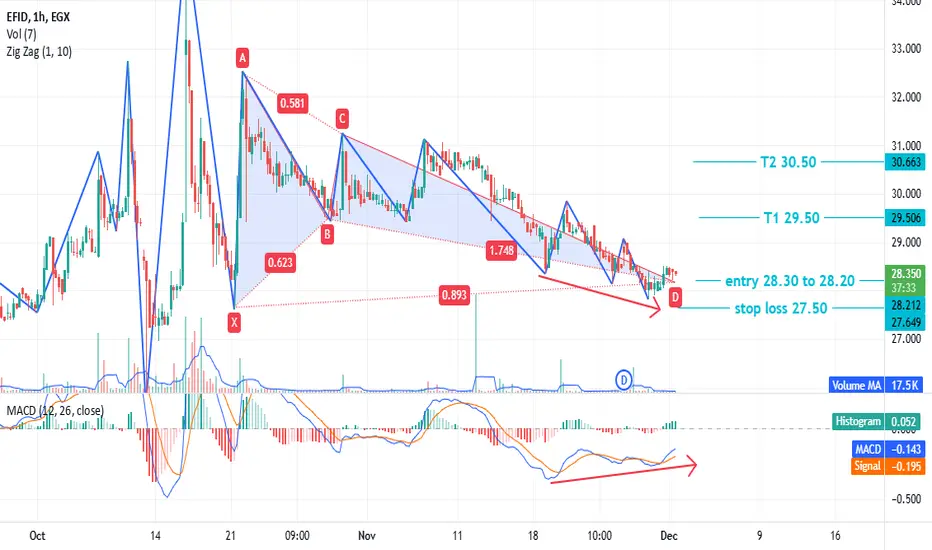
#EFID Egyptian stock#EFID time frame 1 HOUR
created a bullish Gartley pattern
entry level at 28.20 TO 28.30
stop loss 27.50
first target at 29.50
second target 30.50
NOTE: if prices closed under 30.00 (1 HOUR frame)
MACD indicator show positive diversion , may that is support our idea.
NOTE : this data according to time frame 1 hour
Its not an advice for investing only my vision according to the data on chart
Please consult your account manager before investing
Thanks and good luck
MM group We notice a decline in the volume highs as they reach the low volume today, and the sideways movement and stability above the gap all show that we are close to the bottom. Support 6.8
Stop 6.55 with close
Resistance 7 Goals 7.25, 7.5 and 8 are the final goal.
I expect a strong movement this week.

#AFDI Egyptian stock#AFDI time frame 1 DAY
created a bullish Gartley pattern
entry level at 30.60
stop loss 30.00
first target at 32.65
second target 34.20
NOTE: if prices closed under 30.00 (1 DAY frame) may go down to 27.00
MACD indicator show bottom less than last bottom unlike the data on chart , may that is support our idea.
NOTE : this data according to time frame 1 hour
Its not an advice for investing only my vision according to the data on chart
Please consult your account manager before investing
Thanks and good luck

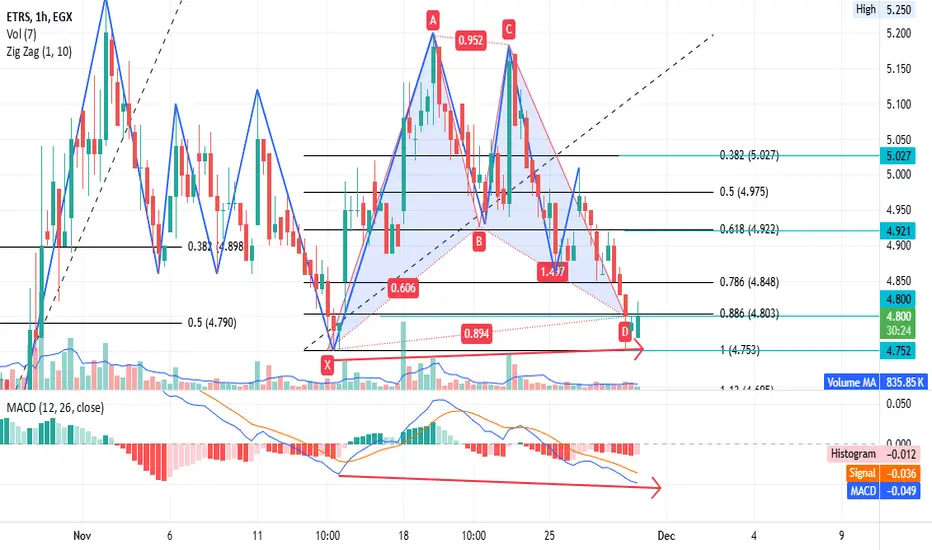
#ETRS Egyptian stock#ETRS time frame 1 hour
created a bullish Gartley pattern
entry level at 4.80
stop loss 4.75
first target at 4.90
second target 5.00
NOTE: if prices closed under 4.75 (1 hour frame) may go down to 4.30
MACD indicator show bottom less than last bottom unlike the data on chart , may that is support our idea.
NOTE : this data according to time frame 1 hour
Its not an advice for investing only my vision according to the data on chart
Please consult your account manager before investing
Thanks and good luck
#EEII Egyptian stock#EEII time frame 1 hour
created a bullish Gartley pattern
entry level at 1.39
stop loss 1.37
first target at 1.45
second target 1.50
MACD indicator show bottom less than last bottom unlike the data on chart , may that is support our idea.
note : this data according to time frame 1 hour
Its not an advice for investing only my vision according to the data on chart
Please consult your account manager before investing
Thanks and good luck
