Egas Jinny Gann Star LevelsHello Dear Traders,
Analysis for Egas Using Jinny Gann
On Chart The Most Important Levels "Horizontal Lines" Works as Support/Resistance .
Gann Star For Possible uptrend Cycles
Vertical Lines marks Important Dates/Reversals..
Trade Wisely ..Important to Trail your profit above every level.
Decisions on Candle Close.
Best Regards

WKOL Important LevelsJinny Gann Fan Levels are on the Chart possible Trendlines my WAY. Jinny Gann Fan/Horizontal Lines Works as Support / Resistance. Important levels for the Big Cycle on the chart.
As you can See.. Currently Important Resistance is : 151.66
Support 132.81 Then 115
Trail Your Stop for Profit Taking with Each level you achive.

MENA is a good setup- Overhead resistance is at 1.890s
- Breaking it and clear sky ahead to 2.10-2.50 and then 3.
- pretty sure enough shares for everyone to bank.
- PS: you dont need 100 indicators on your chart, price action and volume are kings.

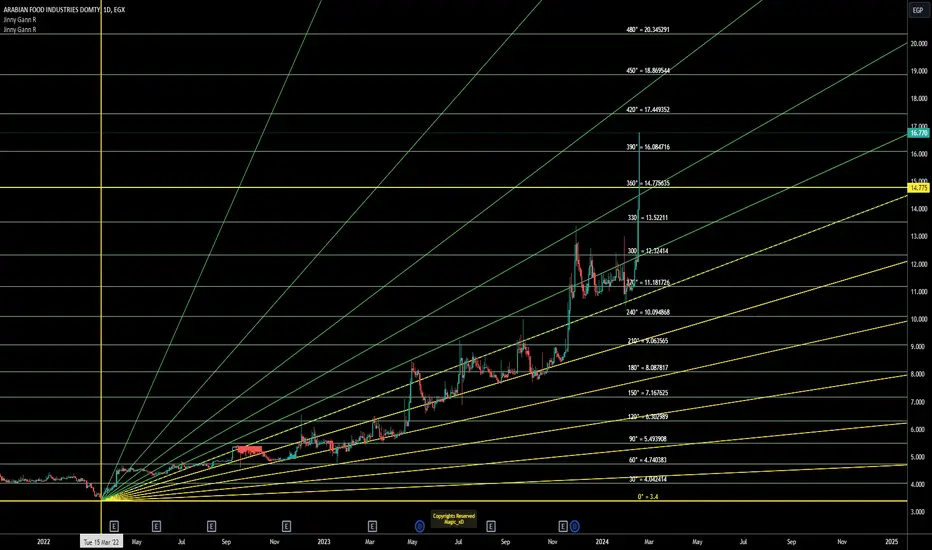
Buy extracted oil The company made profits this year , along side with the triangle pattern price made , i think price will reach his historical resistance soon , to be safe buy if price could reach 3.45 and closes above it

HeliJinny Gann Fan Levels are on the Chart possible Trendlines my WAY.
Jinny Gann Fan/Horizontal Lines Works as Support / Resistance.
Important levels for the Big Cycle on the chart.
Trade Wisely.

Domt Jinny Gann Fanz - Important LevelsJinny Gann Fan Levels are on the Chart possible Trendlines my WAY. Jinny Gann Fan/Horizontal Lines Works as Support / Resistance. Important levels for the Big Cycle on the chart. Trade Wisely.
COSG is preparing to breakout..Daily chart, the stock has positive signs that it will cross the Resistance line R soon, then the target will be 0.423 after beating the next resistance line R1
Closing above R1 for 2 days will push the price towards 0.560
Stop loss below SL line 0.315


buy ekhoathe 4 hr chart is making a prefect cup & handle pattern - the price will soon target 60 l.e then 70 l.e
i would take 50% off profit @ 60 L.E

Afdi Levels and GridHello Dear Traders.
Support 32.15
Next Resistance 36.79 then 41.74
Long Term Target is Between 52.5 - 64.6
On The Chart:
Horizontal Levels : Gann square of 9 Levels! very Important.
Jinny Gann Fan
Jinny Gann Grid
Best Regards

Afdi Complex ChartHello Dear Traders.
Support 32.15
Next Resistance 36.79 then 41.74
Long Term Target is Between 52.5 - 64.6
On The Chart:
Horizontal Levels : Gann square of 9 Levels! very Important.
Jinny Gann Fan
Jinny Gann Grid
Best Regards

Roto Automatic Channels on Daily..
Important levels are on the chart
Table with Important values for Todays Candle.
good luck Trading

EEII Jinny Gann Grid + Levels + ChannelzJinny Gann Grid
Gann square of 9 Levels for Current cycle.
Channels classic way..
All Programed..
Levels on the Chart
Horizontal lines are Support/Resistance Regarding The Price action.
Too Many Lines.. But zoom in and try to get it.
Best Of Luck to you all.

SWDY should target 39 after breakoutDaily chart, the stock is trying to beat a tough (cluster) resistance zone. Crossing this zone, and closing 2 days above 32.5 will activate the target 39.0
Resistance cluster zone: Resistance line R1 (blue) + Long term RL (dashed green)
Stop loss to be considered below S1 line.

ETEL, BINV, & MTIEAfter CBE approval raising Vodafone’s share in Basata to 20%, this will have spill over impact in share prices of 3 companies traded in the Egyptian stock market which are as follows:ETEL, BINV, and MTIE.
Technical analysis on the spill over impact on these 3 shares.
t.me

HI Return = HI RISKGravity is virtue, but not for Hi-Rollers & desperates.
it's a Market maker game; be smart investor

CRITICAL POINT = 81.8-82.1EGPMAKE IT OT BREAK IT ...
FVG @81.8-82.1EGP is the breaking point to go long or short
FOREX IS A VIRTUE
COMI is THE key driver for EGX30, its weight is almost 30%, followed by the Fertilizers sector (MFPC & ABUK).
When COMI outbreaks, Ferts are SHY.

77K bought @14:25 will change the market structureBuyers' confidence that MPCO reached its bottom price @74.6 -74.9, will lead to the upswing

Targeting 156EGP .. still uptrendingone complete Marubozo above 128.4 EGP is the driver to short term target of 135 EGP, and the the ultimate outbreak to the Golden target of 156 EGP

one complete Marubozo on daily timeframe will make my dayone complete Marubozo on daily timeframe will make my day @24.5 EGP will lead to a breakout toward the all-time high

ASCM is expected to target 78.9 after beating ResistanceDaily chart, trading in a triangle, the stock is expected to target 78.9 after crossing the Resistance..
After closing for 2 days above 57, the target will be 91.5
Stop loss below 48 should be considered.

Will ETRS cross the Resistance and see the 6 level?30-min chart, the stock is trading in a tough zone; there are 2 strong Resistance levels 4.84 and 5.19
So, be careful with this stock; as it flips quickly!
Closing and trading 3 candlesticks above 5.21 will activate the target of 6.04, then 6.20
Stop loss below 4.68 - should be considered.

EPCO Jinny GANNJinny Gann Fan Levels are on the Chart possible Trendlines my WAY.
Jinny Gann Fan/Horizontal Lines Works as Support / Resistance.
Current Support: 5.06 - 4.81
Resistance:5.38 , 5.97
Important levels for the Big Cycle on the chart.
Long Term Target 8.66
Trade Wisely.
Wish You Best of LUCK.
