Get on board Cib The aeroplane will fly to 100 next daysAs we can see after end of correction of Elliot waves, tomorrow will be critical for the target of 100egp

AMOC, has positive signs of up movement, to target 11AMOC, EGX,
On daily chart, the support level is building up at 8 - 8.15
Crossing the upper channel line at 8.6 will push the stock to higher targets, 9.2, 10, 11

CIB to target 100Weekly chart, the stock is forming a parabolic pattern, to target 100 after crossing 87
BE CAREFUL: Stop loss level should be raised at every up movement.

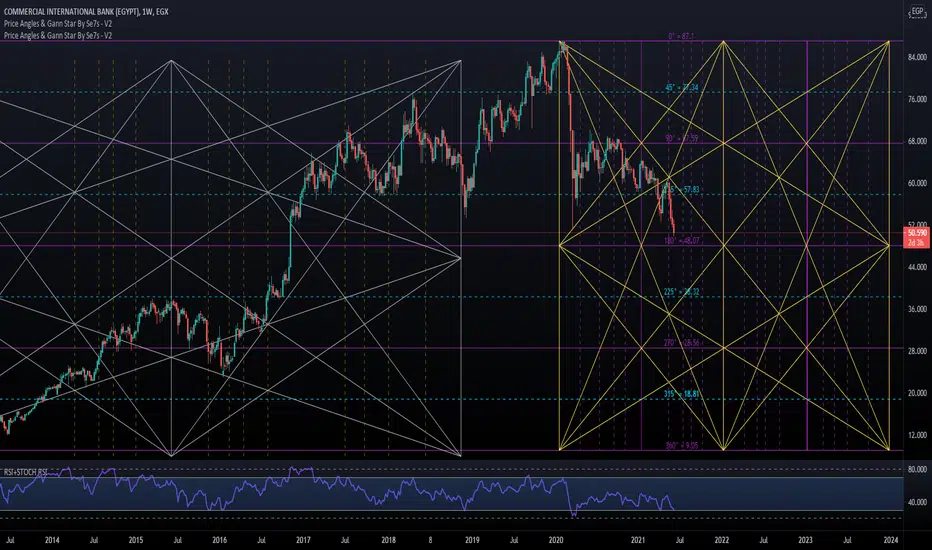
CIB ??? LONG term ChartDOOOOM
LONG term...
support and resistance lines..
horizontal lines are Support/Resistance .
Vertical lines are time pivots .
Appreciate your Comments.
GL
MFPCAbove 83 is good as per scenario on the Chart..
I am expecting strong resistance around 95.94 then might retest lower to 83~ then back to 103 - 115
Best Entry was breaking above 83. or if retested and reversed again from it.
Good Luck Everyone.

CSAG to target 42.3 after testing supportCSAG, on the weekly chart, is seen to have some correction, then resume upwards to 42.3
Stop loss should be considered at 34.2
Note: The indicator RSI is in the over-bought area, that is a SELL or REDUCE watching signal !

GBCO to target 7.50 after crossing the blue lineGBCO
30-min chart, the stock is drawing a pattern, to go down to support line (red) at 6.60 then back to test resistance line (blue), .. and so on, until crossing the blue line up. The target will be 7.50.
Stop loss should be considered.

CERA to target 1.06 after crossing 0.97On 30-minute chart, the pattern and technical indicators RSI and MACD are supporting the following:
CERA is expected to test 0.966 then go up to 0.967
After crossing 0.970, the target will be 1.06
Stop Loss 0.860

ADIB Abu Dhabi to target 46 after crossing 39 (blue line)ADX:ADIB
ADIB (ADX ), on the 1-hour chart, is seen as trying to cross the resistance line (blue) at 39, then the target will be 46.
EITHER Buy here, and stop loss is 37.6
OR Buy after crossing the blue line at 39, and Stop Loss at 38.8
Another scenario is going to test the support (red line) at 35.5, then it is a buy opportunity to go up to 39.5 (blue).
Stop Loss is 35.4
Either ways, it is a nice trading opportunity.

Say hi to the golden eggAs we can see from the long time of Loss. The company shareholder has collecting that stocks under 1.6 EGP, targeting the mid range and long range at five EGP so collect as you can before the stock reach 2.00 EGP And enjoy the ride.

BTFH on uptrend, to target 6.2 in 3.5 - 4 monthMonthly chart..
BTFH is showing an uptrend to target 6.2 in 3.5 - 4 months.
After crossing the resistance line, above 6.2, the target will be 12.3 (May 2025).
Stop loss (red line) should be considered.

ISMA to target 16.9 after crossing the blue line :)On the daily chart, ISMA stock is trading between the blue and red lines, trying to cross either.
The technical indicator RSI showing the higher possibility to go up, then the target will be 16.9, then 18.5
Stop loss should be considered.

The Big Bang Theory, indeed. As we can see if the breakout from upper line of the flag happened. The rocket will launch to its final target, 1 Pound.

Ezz and the goal of the flag As we can see. If it Crossing. 82. It will confirm. The attack of the final goal. 120.

AMOC is building support, to target 10.61 in 2-3 daysAMOC , on the 1-hour chart, is showing signals to move away up from the support level of 10 - 10.02 and the target will be 10.61 in 2 - 3 days.
Stop loss at 10.0 should be considered.


COSG to test support 0.230, then rebound to 0.292COSG to test support 0.230, then rebound to 0.292
Daily chart
The next target after crossing the resistance blue line is 0.477
Stop loss 0.230 - 0.227

AMOC to target 13.95 soonAMOC is preparing to cross up 11 - 11.1, then the target will be 13.95 - 14
There are technical indicators including RSI; to support this view.
Note: Stop loss level 10.6 (closing below for 60 minutes)

AMIA to target 2.3 in few daysOn the daily chart, AMIA stock is showing up movement to reach the upper channel at 2.3 to 2.35.
Crossing this resistance, will drive the stock to target 3.0

EKHO to target 1.4 (medium term)EKHO is getting into the strong buy area.
On the weekly chart, the RSI and channel pattern are supporting this view.
The target is 1.4
Stop loss line is shown in red, znd should be noted.

RREI (ALICO) to target 1.28ARAB REAL ESTATE INVESTMENT CO.-ALICO
Weekly chart.. RREI is preparing to cross 0.81 upwards, then the target will be 1.28 - 1.29 in few weeks
The technical pattern is expected to complete soon..
Stop loss level 0.7

COMI in rally leading the EGX 30the Commercial International Bank (COMI) is leading the EGX 30 with weight of 26.21% to a historical high points that was not been reached before. We can see from the chart that still having a potential rally after breaking the level of 58. However, the volumes is low and the rally to the uptrend is not as sharp as before. It is moving in an uptrend channel, not that perfect, but giving a close view in the short term.
It is expected to continue in it's direction reaching new levels around 75.
on the other hand, if the stock returned below the 58, it will fall dramatically to the next level around 47.5, and may continue to 40.
According to the economical data and the current situation in the region, specially the war in Gaza, we can not say that or predict the time that we can say that the EGX30 reached it's peak, so I recommend the investors to keep in consideration the risk ratio and distribute the portfolio on several stocks with a suitable risk management.
