AREH Still In DowntrendHello, according to my graphical analysis Of the EGYPTIAN REAL ESTATE GROUP
, there is a high probability of a drop in the coming weeks.

AspiWe can see the Wolfe wave has been completed and the price is above the strongest level in pivot so we are targeting 0.265 with stop loss 0.237

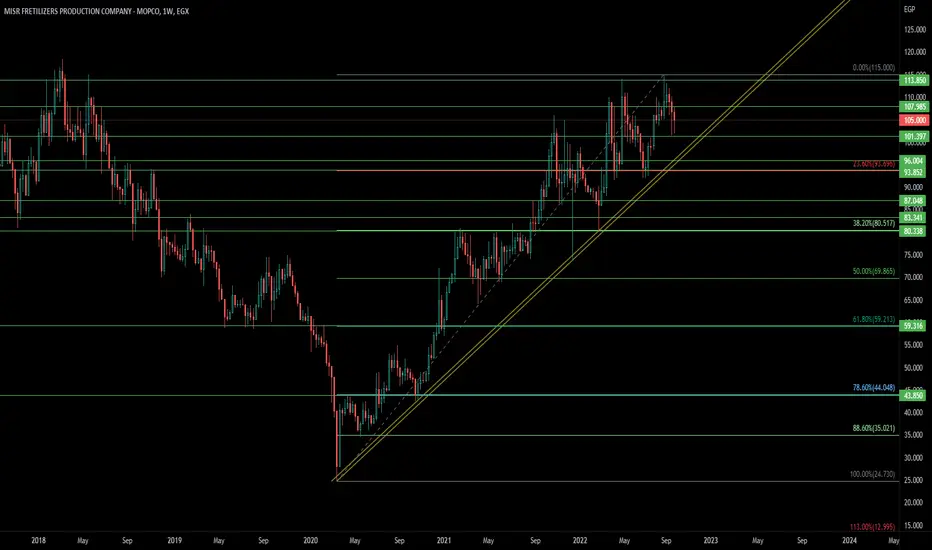
MFPC WeeklyPlease be aware of breaking below the Yellow UP Trendline That will be Bearish.
Levels for possible support and resistance depending where price is located to the level on the chart.
Near Resistance 108
Near support 102
Breaking below 83 Consider it officially Bear Trend.

#prmhgood opportunity for long term target up to 1.80 EGP
and short term target up to 0.75 EGP
stop loss 0.44 EGP

ATLAS- Channel - part 2 As shared last week, I guess. The stock is moving down and will continue to reach the area around 0.26 depending on whether the whole market continues falling the next week based on today's market session or will bounce back up if the market stops rectification.

ARVA Rounding bottom and channel chartAs we can see down below the stock is moving between the prices of a channel and is continuing with the rounding bottom chart formation. Almost hit the high of the channel might test it again and might go to the down line to bounce back to a higher high accordingly. to be followed

Reversed head and shoulders confirmedAs we can seen now and speculated yesterday that the pattern will continue to be formed on the chart. We can now see a clear reversed head and shoulders with the target. pattern is 100% confirmed once it breaks the shoulder lines upwards. an order to buy will be put around 0.198 and 0.20. Best of luck

Reversed head and shouldersAs we can see, we can speculate that the char will continue to form the other shoulder so a reversed head and shoulder is drawn and can set a goal for it around 0.23-0.24
Anyway chart is not completed yet however a trade can be done till the other shoulder is drawn on the chart and if it continues, you will have bought the stock in a lower price than u would have got it if you bought after waiting for the other shoulder to appear

ETRSCorrection levels.
and possible Channel.
Fib levels
Support & Resistance Lines Depends on Where the price is to the line.


ATLAS - up trend channel ATLAS can be seen moving in an uptrend channel, best time to buy when touching the down line for the channel, sell by moving down from this channel, keep when moving up till hit (near) the upward channel.

reversed head and shoulders clear reversed head and shoulders and the pattern is 100% confirmed after it breaks the second shoulder and the target is represented in the green line

#AIH#AIH analysis this chart very strong supported by 4 pattern inverted head $shoulers/ double bottom /shark pattern / break down channal entry in green zone stop loss 0.29 EGP target 51 EGP then red zone

#ACAMDAnalysis Of #ACAMD
Bullish Wedge Target 0.69 EGP
Bullish Head^Shoulders Target 0.69 EGP
Bullish buter fly pattern Target 0.62 EGP

Long Term QalaThis Chart Take Years to Accomplish .
Monthly time frame.
Big triangle lower barrier is arround .93
Near support 1.182 , 1.14
Good buy area. ^ ^
Resistance levels on the chart
also considered resistance the upper boundary of the triangle.
Wish you best of luck.

ARABAnalysis of #ARAB
There is a douple bottom pattern forming on the daily timeframe and crab pattern supported by upper channal
Entry Point 0.393 EGP
I am looking to take profit at 0.47 EGP and Take Care Stop loss 0.35 EGP

Important Levels for IFAPImportant Levels For support and Resistance for IFAP
Broke Uptrend Line from March 2020.
AND a Possible Head & Shoulders Pattern Under Construction.

GOCOAccumulation Phase.
GOCO is In Buying area for long term Hold.
Targets are on the Chart with Profit Percentage awaiting.
Buy but dont let them notice you lol.
GL


EHDRAnalysis of #EHDR
There is a douple bottom pattern forming on the daily timeframe and crab pattern supported by upper channal
Entry Point 0.44EGP
I am looking to take profit at 0.52 / 0.57 /0.60 and closing all trade 0.65/0.67 EGP Please Take Care Stop loss 0.375 EGP

MENAUnique Opportunity Crab pattern Entry Point Closing up 0.86 EGP Taregets Black Lines To Orange Zone
Supported by Green UP Trend and Head^Shoulders Tareget Orange Zone
Stop Loss 0.70 EGP
