NEXT MARKET MOVE UP TO 2023NEXT MARKET MOVE UP TO 2023
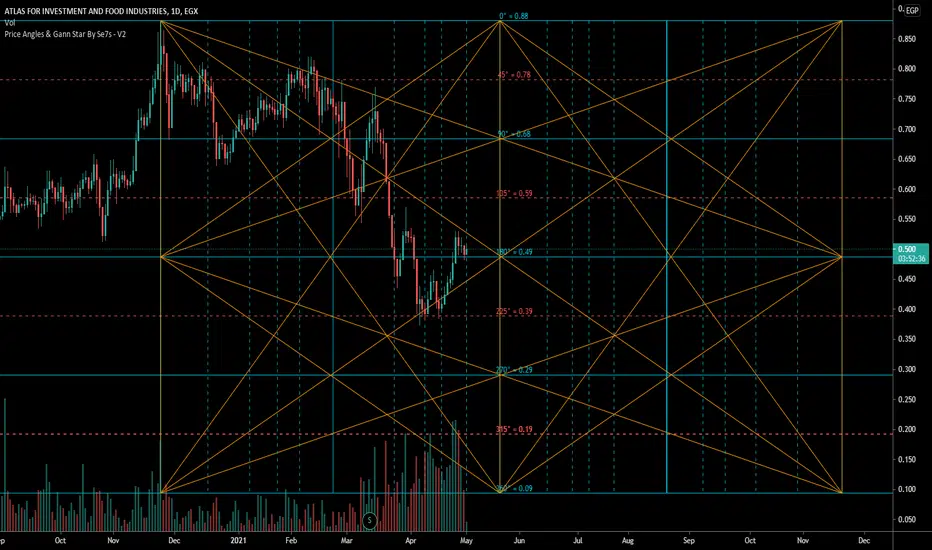
At the bold black line, a major area,
At the orange line, a sub area
WE CAN UPDATE AFTER BROKEN

NEXT MARKET MOVE UP TO 2023NEXT MARKET MOVE UP TO 2023
At the bold black line, a major area,
At the orange line, a sub area
WE CAN UPDATE AFTER BROKEN

ISPHi tried to add the indicators that i think they would give the accurate signals i need for my strategy


turning points 2support and resistance lines..
horizontal lines are Support/Resistance .
Vertical lines are time pivots .
Appreciate your Comments. GL
Long ATQAPossible support and resistance . GL. horizontal lines are Support/Resistance . Vertical lines are time pivots

UASGsupport and resistance lines.. horizontal lines are Support/Resistance . Vertical lines are time pivots . Appreciate your Comments. GL

ALICOsupport and resistance lines..
horizontal lines are Support/Resistance .
Vertical lines are time pivots .
Appreciate your Comments.
GL

xDCrossed Downtrend Line from March TOP.
FIb Levels on the chart.
Possible Head And shoulder Pattern.
Stop close under the left shoulder. or nearest level.
always take your orders near a level.

EBSC in Accumulation. SHHHH don't tell anybody!Accumulation in progress.
Good Entry Between .422 .455
Targets on The chart.

Sugr Long Term Levels for ever.LONG TERM Important LEVELS.
horizontal lines are Support/Resistance .
Appreciate your Comments.
GL

An analysis for COMI StockFrist, we show on the top 4 Resistance lines in yellow and on the bottom one support line in green .
and we show a pattern of Two heads but upside down .
and the result of that, that the price of COMI Stock will increase to more than 51.000


PALM HILLS 4/27 TO 28/4 The last day of Thursday in the stock market. Please sell today, it will be blood red.
EGX:EGX30


OBOUR LAND FOR FOOD INDUSTRIES next 2 daysOBOUR LAND FOR FOOD INDUSTRIES for the next 2 days
EGX:EGX30


Rameda stock analysisThis is a personal expectation of the future of the stock. You are the first and last responsible for your opinion of entering or exiting


Fawry long termFawry is trading inside down channel we have to break the resistance to become bullish again
